
A 50/50 live traffic experiment using Harness FME showed PostgreSQL reduced average query execution time by 84%, despite a few slower query patterns. Once validated, Harness DB DevOps manages schema changes, while Harness FME enables a controlled migration with a kill switch.
Databases have been crucial to web applications since their beginning, serving as the core storage for all functional aspects. They manage user identities, profiles, activities, and application-specific data, acting as the authoritative source of truth. Without databases, the interconnected information driving functionality and personalized experiences would not exist. Their integrity, performance, and scalability are vital for application success, and their strategic importance grows with increasing data complexity. In this article we are going to show you how you can leverage feature flags to compare different databases, and later, how Harness DB DevOps takes over once you're ready to act on what the experiment tells you.
Setting Up the MariaDB vs. PostgreSQL Experiment
Let's say you want to test and compare two different databases against one another. A common use case could be to compare the performance of two of the most popular open source databases: MariaDB and PostgreSQL.

Let's think about how we want to do this. We want to compare the experience of our users with these different databases. In this example we will be doing a 50/50 experiment. In a production environment doing real testing in all likelihood you already use one database and would use a very small percentage based rollout to the other one, such as a 90/10 (or even 95/5) to reduce the blast radius of potential issues.
Building the Feature Flag
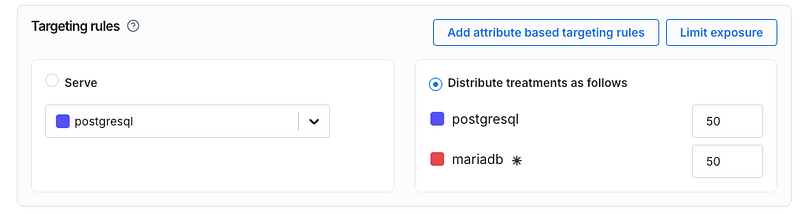
To do this experiment, first, let's make a Harness FME feature flag that distributes users 50/50 between MariaDB and PostgreSQL.
Generating Sample Data
Now for this experiment we need to have a reasonable amount of sample data in the db. In this sample experiment we will actually just load the same data into both databases. In production you'd want to build something like a read replica using a CDC (change data capture) tool so that your experimental database matches with your production data.
Our code will generate 100,000 rows of this data table and load it into both before the experiment. This is not too big to cause issues with db query speed but big enough to see if some kind of change between database technologies. This table also has three different data types - text (varchar), numbers, and timestamps.
Building the Test Application
Now let's make a basic app that simulates making our queries. Using Python we will make an app that executes queries from a list and displays the result.
Below you can see the basic architecture of our design. We will run MariaDB and Postgres on Docker and the application code will connect to both, using the Harness FME feature flag to determine which one to use for the request.

The sample queries we used can be seen below. We are using 5 queries with a variety of SQL keywords. We include joins, limits, ordering, functions, and grouping.
We use the Harness FME SDK to do the decisioning here for our user id values. It will determine if the incoming user experiences the Postgres or MariaDB treatment using the get_treatment method of the SDK based upon the rules we defined in the Harness FME console above.
Afterwards within the application we will run the query and then track the query_execution event using the SDK's track method.
See below for some key parts of our Python based app. This code will initialize our Split (Harness FME) client for the SDK.
We will generate a sample user ID, just with an integer from 1–10,000.
Now we need to get whether our user will be using Postgres or MariaDB. We also do some defensive programming here to ensure that we have a default if it's not either postgres or mariadb.
Now let's run the query and track the query_execution event. From the app you can select the query you want to run, or if you don't it'll just run one of the five sample queries at random.
The db_manager class handles maintaining the connections to the databases as well as tracking the execution time for the query. Here we can see it using Python's time to track how long the query took. The object that the db_manager returns includes this value.
Tracking the event allows us to see the impact of which database was faster for our users. The signature for the Harness FME SDK's track method includes both a value and properties. In this case we supply the query execution time as the value and the actual query that ran as a property of the event that can be used later on for filtering and, as we will see later, dimensional analysis.
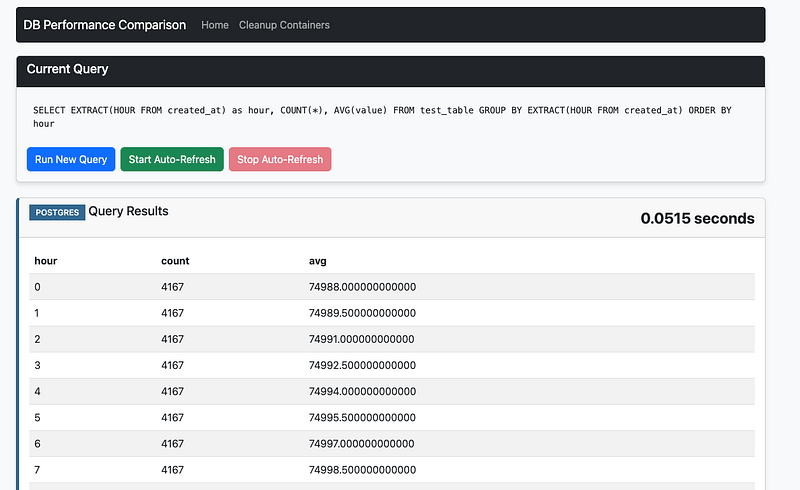
You can see a screenshot of what the app looks like below. There's a simple bootstrap themed frontend that does the display here.
Defining the Performance Metric
The last step here is that we need to build a metric to do the comparison.
Here we built a metric called db_performance_comparison. In this metric we set up our desired impact - we want the query time to decrease. Our traffic type is of user.
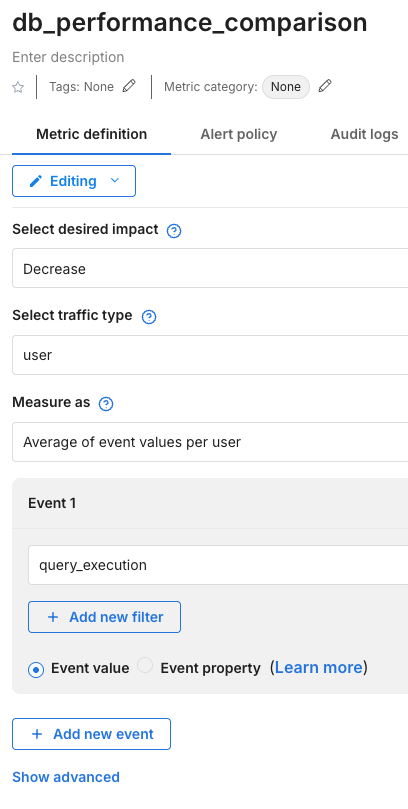
One of the most important questions is what we will select for the Measure as option. Here we have a few options, as can be seen below.
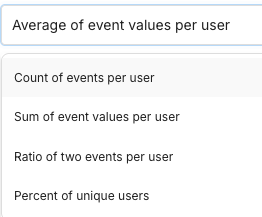
We want to compare across users, and are interested in faster average query execution times, so we select Average of event values per user. Count, sum, ratio, and percent don't make sense here.
Lastly, we are measuring the query_execution event, so we added this metric as a key metric for our db_performance_comparison feature flag.

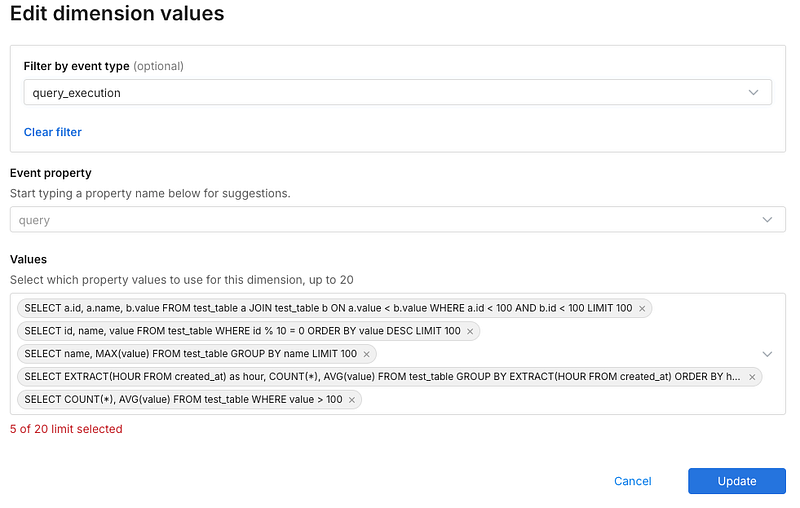
One additional thing we will want to do is set up dimensional analysis, like we mentioned above. Dimensional analysis will let us drill down into the individual queries to see which one(s) were more or less performant on each database. We can have up to 20 values in here. If we've already been sending events they can simply be selected as we keep track of them internally - otherwise, we will input our queries here.
Now that we have our dimensions, our metric, and our application set to use our feature flag, we can now send traffic to the application. For this example, I've created a load testing script that uses Selenium to load up my application. This will send enough traffic so that I'll be able to get significance on my db_performance_comparison metric. I got some pretty interesting results, if we look at the metrics impact screen we can see that Postgres resulted in a 84% drop in query time.


Even more, if we drill down to the dimensional analysis for the metric, we can see which queries were faster and which were actually slower using Postgres.
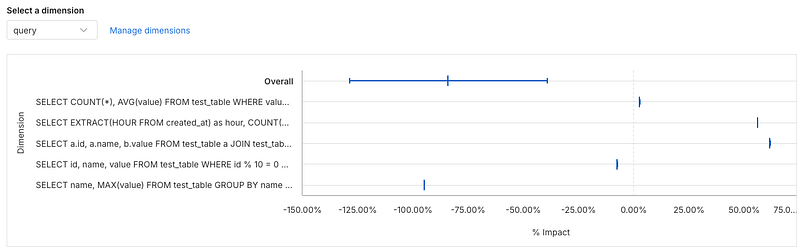
So some queries were faster and some were slower, but the faster queries were MUCH faster. This allows you to pinpoint the performance you would get by changing database engines.
You can also see the statistics in a table below - seems like the query with the most significant speedup was one that used grouping and limits.
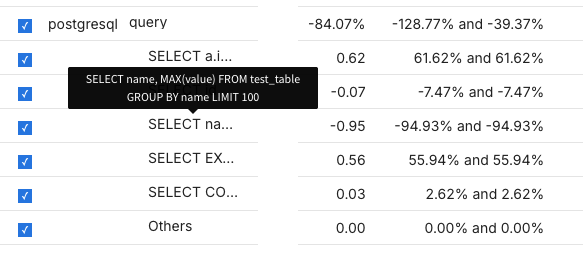
However, the query that used a join was much slower in Postgres - you can see it's the query that starts with SELECT a.i..., since we are doing a self-join the table alias is a. Also the query that uses EXTRACT (an SQL date function) is nearly 56% slower as well.
From Experiment to Migration: Where Harness DB DevOps Fits In
The experiment above answers one question: which database is faster for your workload. It doesn't answer the second question every DBA asks next: how do we actually get production traffic there without an incident. That's where Harness DB DevOps comes in, and why we're calling it out here.
A full engine migration, like a MariaDB-to-PostgreSQL cutover, carries three separate layers of risk:
1. Data Movement
Moving rows to the new engine, converting types, and replicating ongoing changes. This layer is typically owned by ETL and CDC (change data capture) tools like AWS DMS, Debezium, or Striim, not by Harness.
2. Schema Governance on the Destination
Every table, index, and constraint on the new database needs to be created, reviewed, and versioned before traffic ever reaches it. Harness DB DevOps treats these changes the same way you'd treat application code: changesets live in Git, get promoted through CI/CD, and pass through policy checks before they deploy. OPA (Open Policy Agent) policies can block risky operations such as DROP COLUMN in production, and approval workflows can route changes through Jira or ServiceNow.
3. Traffic Cutover and Validation
This is the layer this post already demonstrated. Harness FME routes a percentage of live traffic to the new database, measures the difference with a metric like our db_performance_comparison, and gives you an instant kill switch back to the old engine if something looks wrong.
Expand, Contract, and Govern the Whole Path
The same expand/contract pattern used for application schema changes applies here too. Add the new schema elements alongside the old ones, ship code that can write to both, use FME to activate the new path for a cohort, validate, then contract by retiring what's no longer needed. Harness DB DevOps versions every one of those steps, including raw SQL changesets for things a migration script doesn't have a ready-made shortcut for, like a sync trigger, so the schema stays audited end to end. FME controls when and for whom the new path goes live, and gives you the kill switch if the cohort data says otherwise.
For our MariaDB-to-PostgreSQL comparison, that means the 50/50 (or 90/10) traffic split isn't just a testing convenience. It's the same mechanism that would carry a real cutover, backed by a governed, version-controlled schema on the Postgres side instead of a set of manual scripts and hope.
Try it for yourself!
There are so many uses for feature flags and experimentation beyond that traditional use cases. Not to mention AI configs and code configs so you can change parameters on the fly and see the impact right away. If you want to learn more and try it out for yourself you can get started right now by signing up and creating your first feature flag with Harness in just a few minutes.
FAQ
What is Harness FME used for in database testing?
Harness FME (Feature Management & Experimentation) lets you route a percentage of live traffic between two database engines using a feature flag, then measure the difference with a metric - such as query execution time - to see which one performs better for your real workload.
How do you measure database query performance with feature flags?
You track a query_execution event with the query's execution time as the value, then build a metric (e.g., "Average of event values per user") to compare that value between the two treatment groups. Dimensional analysis lets you break results down by individual query.
What's the difference between Harness FME and Harness DB DevOps?
Harness FME manages the experiment and traffic cutover - who sees which database and when. Harness DB DevOps manages the schema itself - versioning, reviewing, and policy-checking every schema change on the destination database before and during a migration.
Is a 50/50 traffic split safe for a real migration?
For an initial experiment it's fine, but for a production cutover most teams start with a small percentage (90/10 or 95/5) to limit the blast radius, then increase it as confidence grows - the same mechanism used in this post's test.
Why was PostgreSQL slower on some queries in this test?
In this experiment, a self-join query and a query using the EXTRACT date function were both slower on PostgreSQL than MariaDB (the latter by about 56%), even though PostgreSQL was faster overall. This is why dimensional, per-query analysis matters more than a single aggregate number.
Conclusion
Running experiments on backend infrastructure like databases using Harness FME can yield significant insights and performance improvements. In this test, PostgreSQL showed an 84% drop in average query time compared to MariaDB - but dimensional analysis also surfaced the exceptions: join-heavy queries and EXTRACT-based date queries were actually slower on Postgres. That's the real value of this kind of test: it tells you not just whether to migrate, but which parts of your workload would benefit and which might not. A team with a lot of join-based queries or heavy use of SQL date functions might find MariaDB is still the better fit for them, even if Postgres wins on average.
If your numbers point toward a migration, the experiment above is only half the story. Harness DB DevOps governs the schema changes on the destination database with the same rigor - Git-versioned changesets, policy checks, and an audit trail - so the cutover Harness FME manages is backed by a database that was deployed safely in the first place.
Ready to see it for yourself? Start a free trial of Harness FME to run your own database comparison, or explore how Harness DB DevOps governs schema changes before your next migration.
The full code for our experiment lives here: https://github.com/Split-Community/DB-Speed-Test

All this author’s posts
Joshua Klein has helped product companies deliver high-quality software to their customers by architecting and implementing scalable, reliable solutions, over the course of his career.