.png)
GCP Cloud Monitoring probe let you transform your existing GCP metrics into automated pass/fail validation for chaos experiments, eliminating subjective observation in favor of objective measurement. With flexible authentication options (workload identity or service account keys) and PromQL query support, you can validate infrastructure performance against defined thresholds during controlled failure scenarios. This creates an audit trail of system behavior under stress and enables automated resilience testing in CI/CD pipelines.
Running infrastructure on Google Cloud Platform means you're already collecting metrics through Cloud Monitoring. But here's the question: when you deliberately break things during chaos experiments, how do you know if your systems actually stayed healthy?
The GCP Cloud Monitoring probe in Harness Chaos Engineering answers this by letting you query your existing GCP metrics using PromQL and automatically validate them against your SLOs. No manual dashboard watching, no guessing whether that CPU spike was acceptable. Just automated, pass/fail validation of whether your infrastructure held up during controlled chaos.
The Challenge with GCP Infrastructure Testing
Here's a common scenario: you run a chaos experiment that kills pods in your GKE cluster. You watch your GCP Console, see some metrics fluctuate, and everything seems fine. But was it actually fine? Did CPU stay under 80%? Did memory pressure trigger any OOM kills? Did disk I/O queues grow beyond acceptable levels?
Without objective measurement, you're relying on gut feel. GCP Cloud Monitoring probes solve this by turning your existing monitoring into automated test assertions for chaos experiments.
The beauty is that you're already collecting these metrics. GCP Cloud Monitoring tracks everything from compute instance performance to Cloud Run request latency. These probes simply tap into that data stream during chaos experiments and validate it against your defined thresholds.
What You'll Need
Before configuring a GCP Cloud Monitoring probe, ensure you have:
- An active GCP account with Cloud Monitoring enabled for your project
- Network access to the GCP Cloud Monitoring API from your Kubernetes execution plane
- Either a chaos infrastructure with IAM and workload identity configured, or GCP service account credentials with the monitoring.timeSeries.list permission
The authentication flexibility here is powerful. If you've already set up workload identity for your chaos infrastructure, you can leverage those existing credentials. Otherwise, you can use a specific service account key for more granular control.
Setting Up Your GCP Cloud Monitoring Probe
Creating the Probe
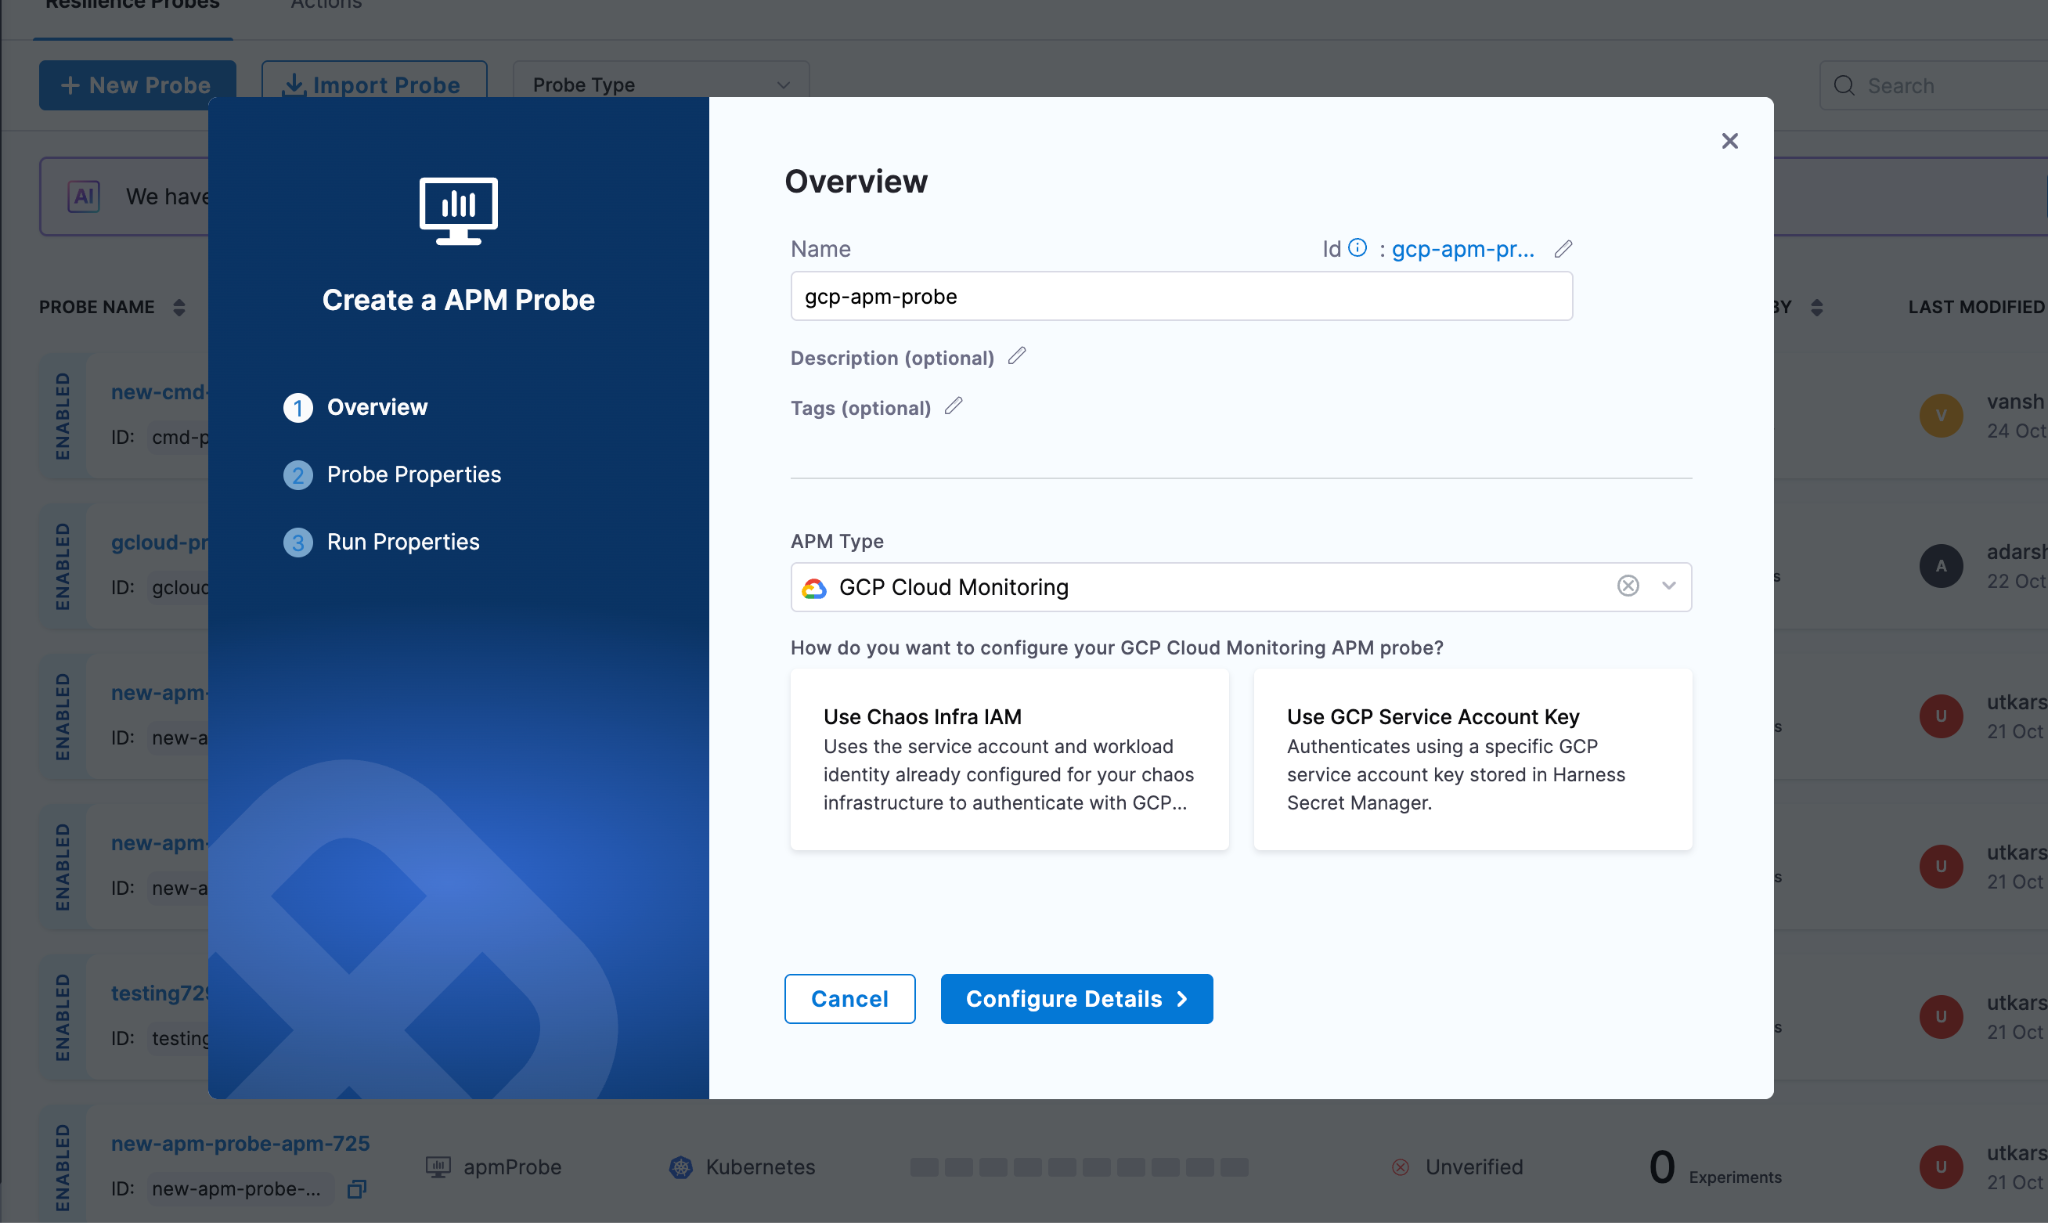
Navigate to the Probes & Actions section in the Harness Chaos module and click New Probe. Select APM Probe, give it a descriptive name, and choose GCP Cloud Monitoring as the APM type.

Authentication: IAM or Service Account Keys?
One of the nice things about GCP Cloud Monitoring probes is the authentication flexibility. You get two options, and the right choice depends on your security posture and infrastructure setup.
Chaos Infra IAM with Workload Identity
If your chaos infrastructure already runs in GCP with workload identity configured, this is the path of least resistance. Your chaos pods inherit the service account permissions you've already set up. No additional secrets to manage, no credential rotation headaches. The probe just works using the existing IAM context.
This approach shines when you're running chaos experiments within the same GCP project (or organization) where your chaos infrastructure lives. It's also the more secure option since there's no long-lived credential sitting in a secret store.
GCP Service Account Keys
Sometimes you need more control. Maybe your chaos infrastructure runs outside GCP, or you want specific experiments to use different permission sets. That's where service account keys come in.
You create a dedicated service account with just the monitoring.timeSeries.list permission (usually through the Monitoring Viewer role), generate a JSON key, and store it in Harness Secret Manager. The probe authenticates using this key for each query.
The tradeoff is credential management. You're responsible for rotating these keys and ensuring they don't leak. But you gain the ability to run chaos from anywhere and fine-tune permissions per experiment type.
Defining Your Probe Logic
Once authentication is configured, specify what metrics to monitor and what constitutes success.
Setting Your Project Context
Enter your GCP project ID, which you can find in the GCP Console or extract from your project URL. This tells the probe which project's metrics to query. For example: my-production-project-123456.
Crafting Your PromQL Queries
GCP Cloud Monitoring speaks PromQL, which is good news if you're already familiar with Prometheus. The query structure is straightforward: metric name, resource labels for filtering, and time range functions for aggregation.
Let's say you're chaos testing a Compute Engine instance and want to ensure CPU doesn't exceed 80%. Your query might look like:
avg_over_time(compute.googleapis.com/instance/cpu/utilization{instance_name="my-instance"}[5m])
This averages CPU utilization over 5 minutes for a specific instance. The time window should match your chaos duration. If you're running a 5-minute experiment, query the 5-minute average.
For GKE workloads, you might monitor container memory usage across a cluster:
avg(container.googleapis.com/container/memory/usage_bytes{cluster_name="production-cluster"})
The metric path follows GCP's naming convention: service, resource type, then the specific metric. Resource labels let you filter to exactly the infrastructure under test.
Defining Pass/Fail Thresholds
Once you have your query, set the success criteria. Pick your data type (Float for percentages and ratios, Int for counts and bytes), choose a comparison operator, and set the threshold.
For that CPU query, you'd set: Type=Float, Operator=<=, Value=80. If CPU stays at or below 80% throughout the chaos, the probe passes. If it spikes to 85%, the probe fails, and your experiment fails.
Tuning Probe Behavior
The runtime properties control how aggressively the probe validates your metrics. Getting these right depends on your experiment characteristics and how quickly you expect problems to surface.
Interval and Timeout work together to create your validation cadence. Set interval to 5 seconds with a 10-second timeout, and the probe checks metrics every 5 seconds, allowing up to 10 seconds for each query to complete. GCP Cloud Monitoring is usually fast, but if you're querying large time ranges or hitting rate limits, increase the timeout.
Initial Delay is critical for chaos experiments where the impact isn't immediate. If you're gradually increasing load or waiting for cache invalidation, delay the first probe check by 30-60 seconds. No point in failing the probe before the chaos has actually affected anything.
Attempt and Polling Interval handle transient failures. Set attempts to 3 with a 5-second polling interval, and the probe retries up to 3 times with 5 seconds between attempts if a query fails. This handles temporary API throttling or network blips without marking your experiment as failed.
Stop On Failure is your circuit breaker. Enable it if you want the experiment to halt immediately when metrics exceed thresholds. This prevents prolonged disruption when you've already proven the system can't handle the chaos. Leave it disabled if you want to collect the full time series of how metrics degraded throughout the experiment.
Making GCP Metrics Actionable During Chaos
The real power of GCP Cloud Monitoring probes isn't just automation. It's turning passive monitoring into active validation. Your GCP metrics go from "interesting data to look at" to "the definitive measure of experiment success."
When a probe executes, it:
- Queries your GCP project's Cloud Monitoring data using the PromQL you defined
- Extracts the metric value from the time series results
- Evaluates it against your threshold (<=80%, >1000ms, etc.)
- Records a pass or fail for that check
- Aggregates all checks to influence the experiment's final verdict
This creates an audit trail. You can prove that during the January 15th chaos experiment, CPU never exceeded 75% even when you killed 30% of pods. Or you can show that the December deployment broke something because memory usage spiked to 95% during the same test that passed in November.
That historical data becomes valuable for capacity planning, SLO refinement, and arguing for infrastructure budget. You're not just doing chaos for chaos's sake. You're building a quantitative understanding of your system's limits.
Start with Your Dashboard Metrics
The easiest way to begin using GCP Cloud Monitoring probes is to look at your existing dashboards. What metrics do you check during incidents? CPU, memory, request latency, error rates? Those are your probe candidates.
Pick one critical metric, write a PromQL query for it, set a reasonable threshold, and add it to your next chaos experiment. Run the experiment. See if the probe passes or fails. Adjust the threshold if needed based on what you learn.
Over time, you'll build a suite of probes that comprehensively validate your infrastructure's resilience. And because these probes use your existing GCP monitoring data, there's no additional instrumentation burden. You're just making better use of what you already collect.
Remember, the goal of chaos engineering is learning. GCP Cloud Monitoring probes accelerate that learning by giving you objective, repeatable measurements of how your systems behave under failure conditions. And objective measurements beat subjective observations every time.

All this author’s posts
Ashutosh Bhadauriya is a senior Developer Relations Engineer.