.svg)
Ship with Confidence Using AI Powered, Enterprise-Grade Resilience Testing
Leverage automated chaos, load, and DR testing to generate real-time Resilience Scores and uplift your business resilience posture

Chaos Testing
- Inject controlled faults
- Identify weak points
- Validate system behavior under stress
- Proactive failure simulation
Load Testing
- Simulate high user traffic
- Measure performance limits
- Ensure scalability & stability
- Identify bottlenecks
DR Testing
- Verify backup & restore procedures
- Test failover mechanisms
- Ensure business continuity
- Minimize downtime


Measure Your Resilience Posture
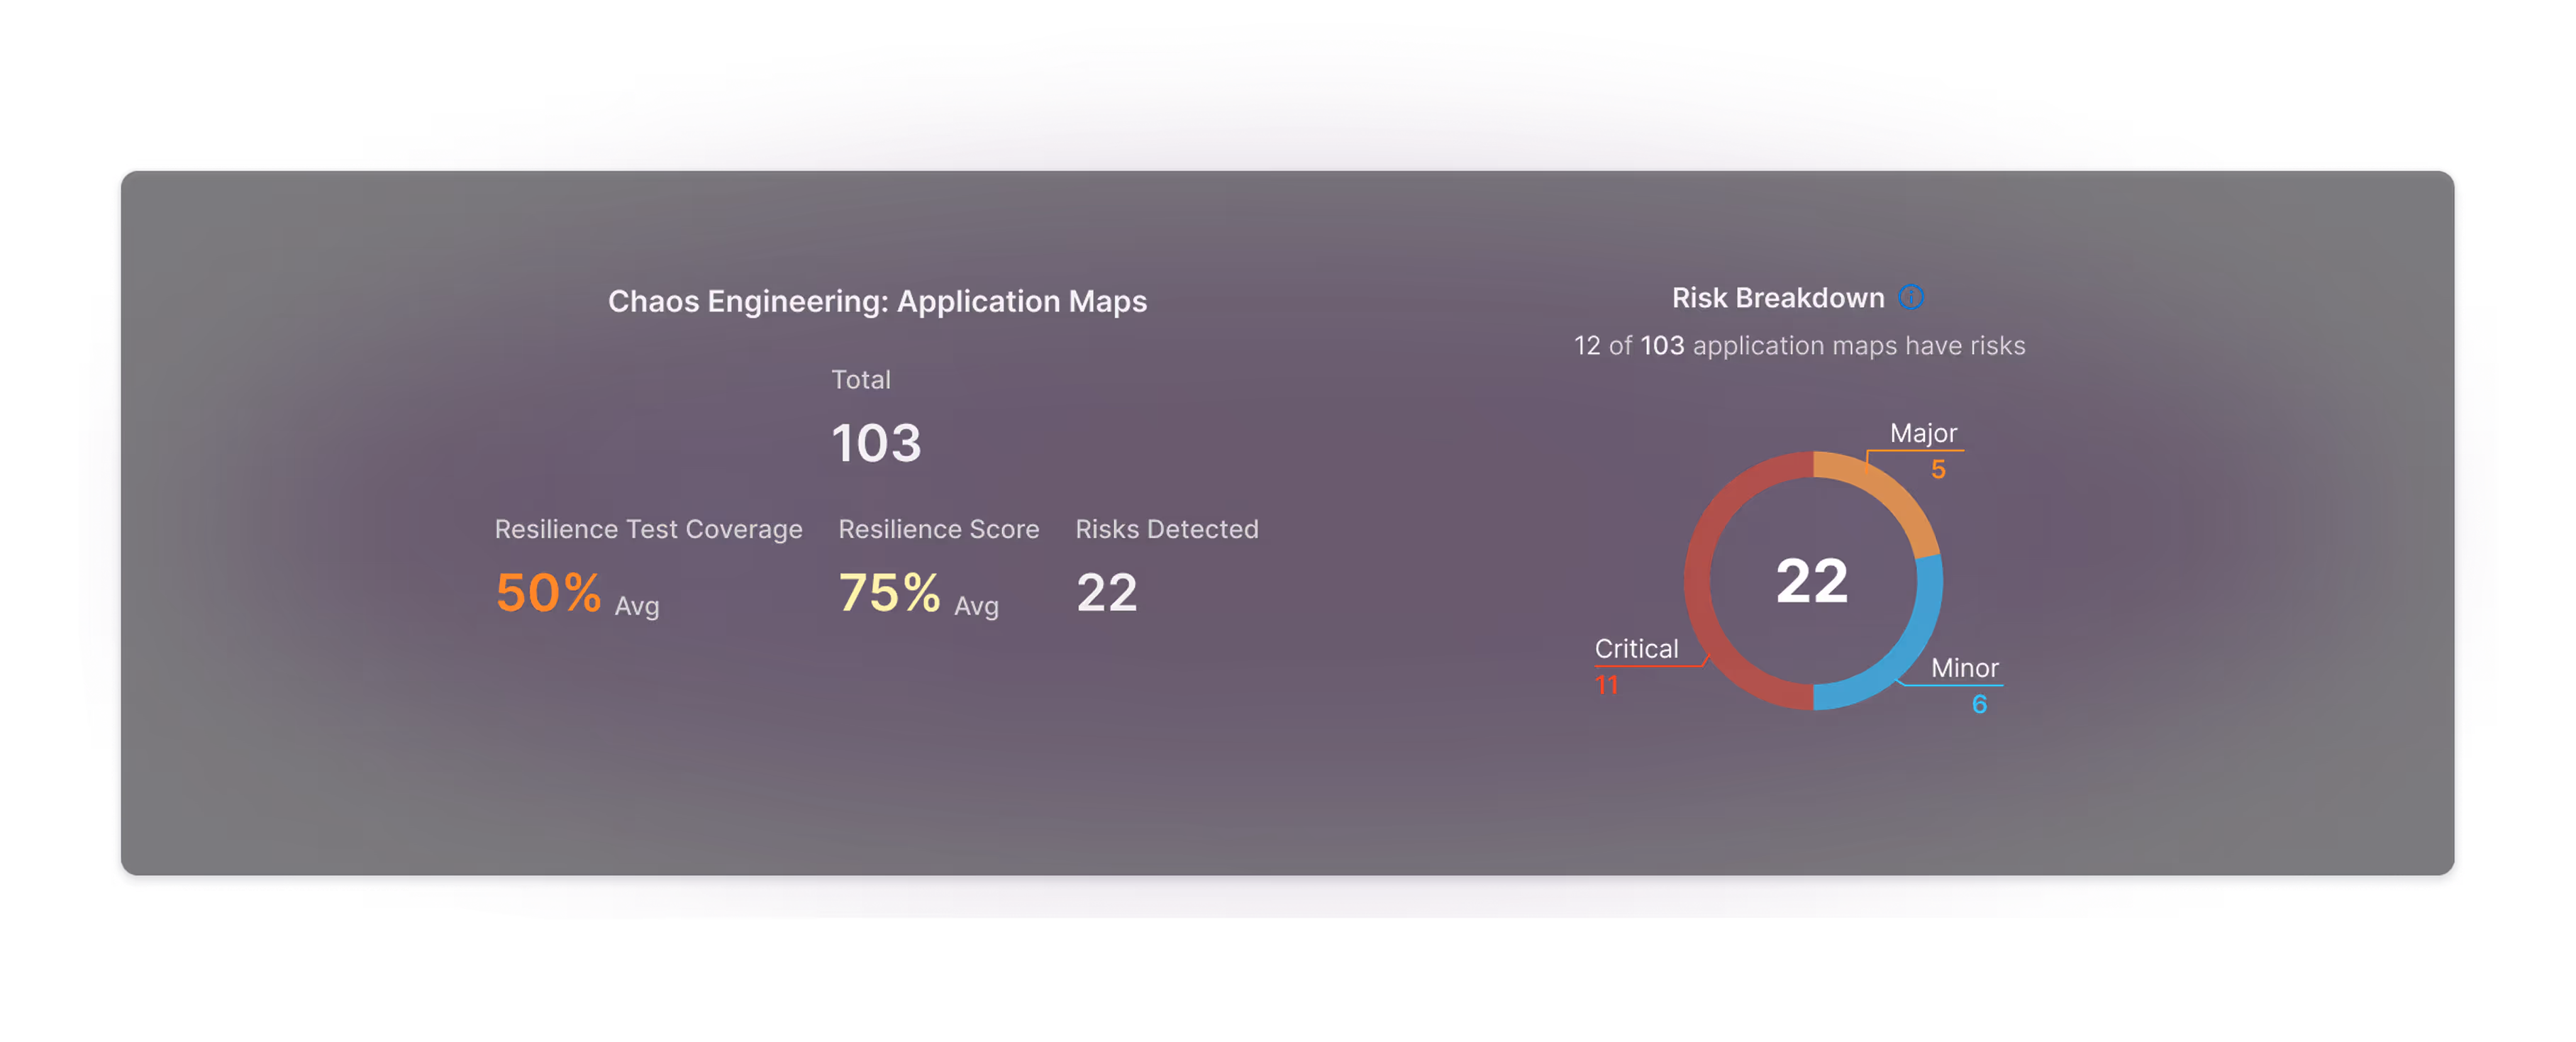
See What You’re Relying On
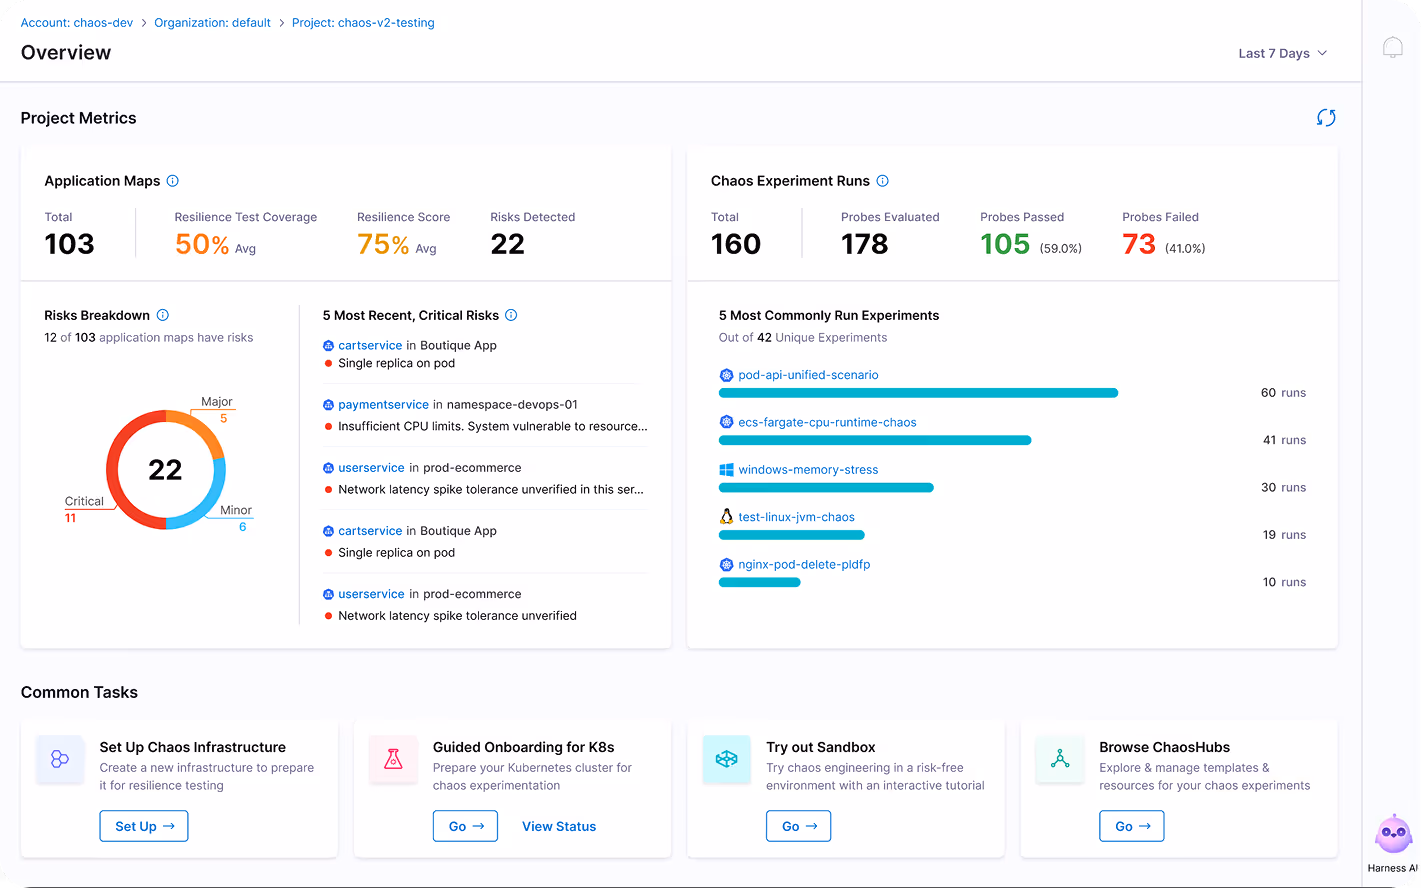
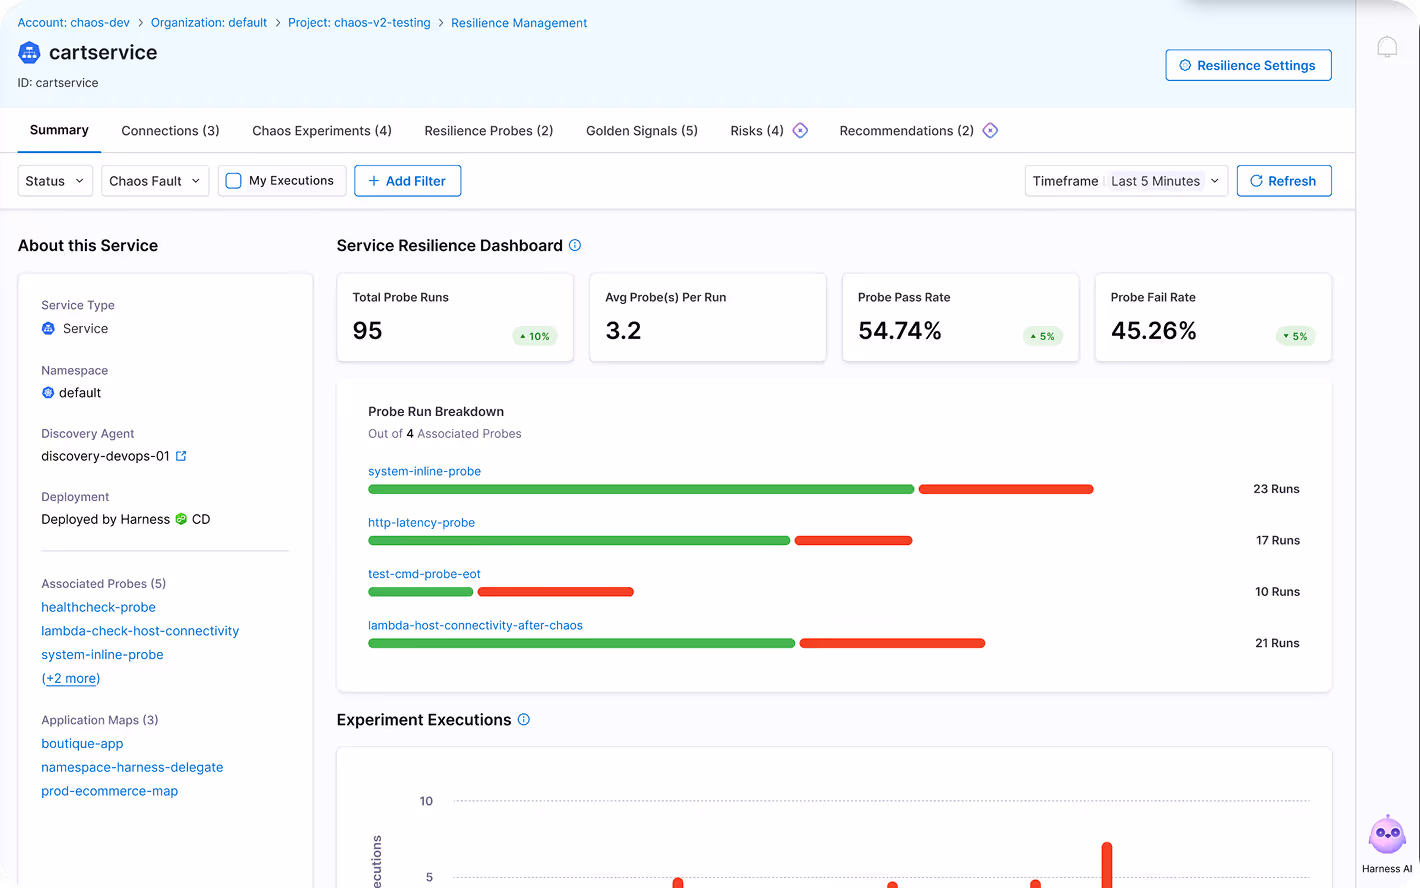
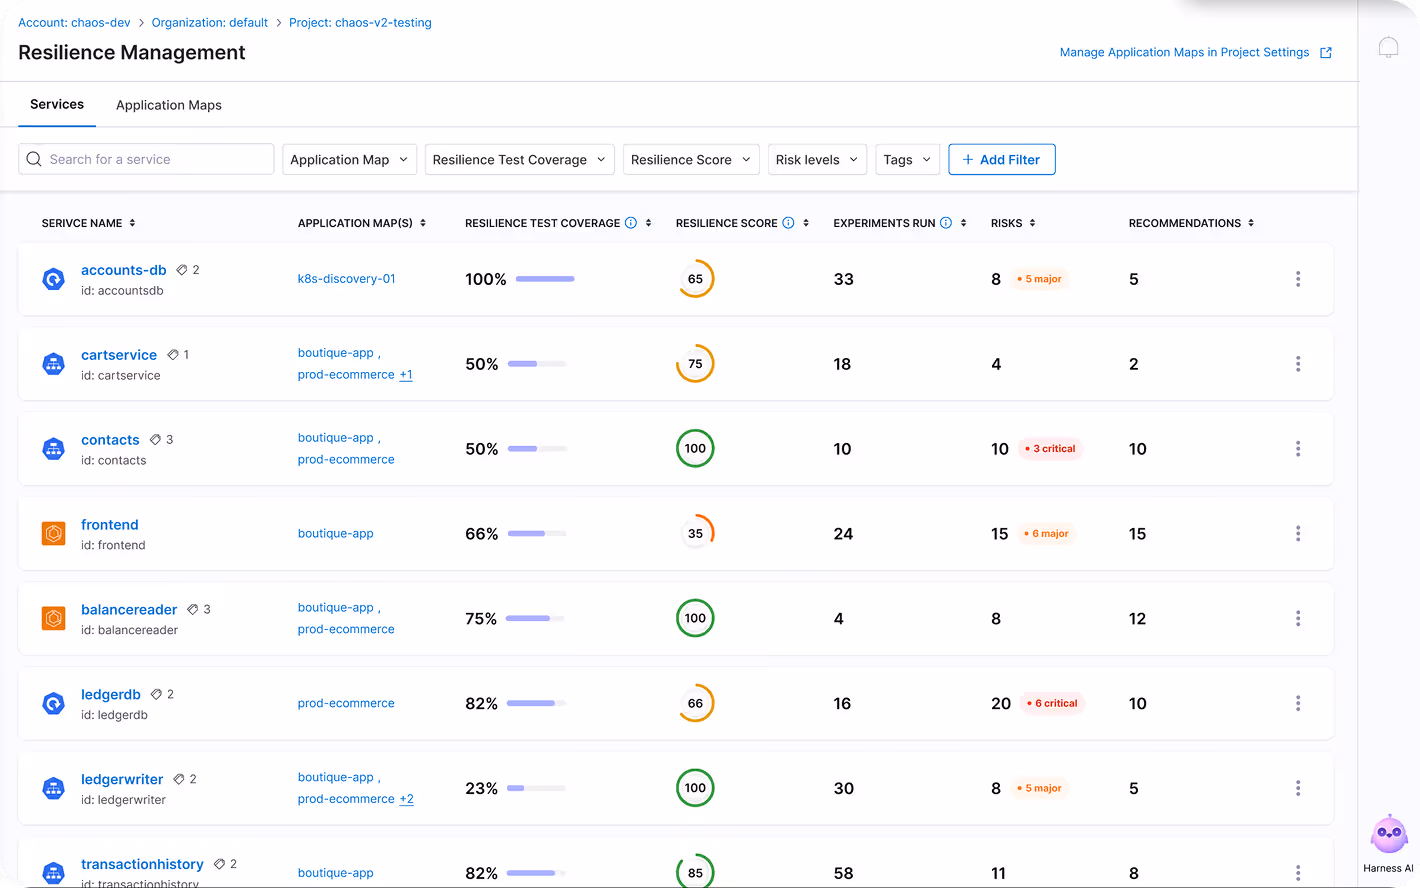
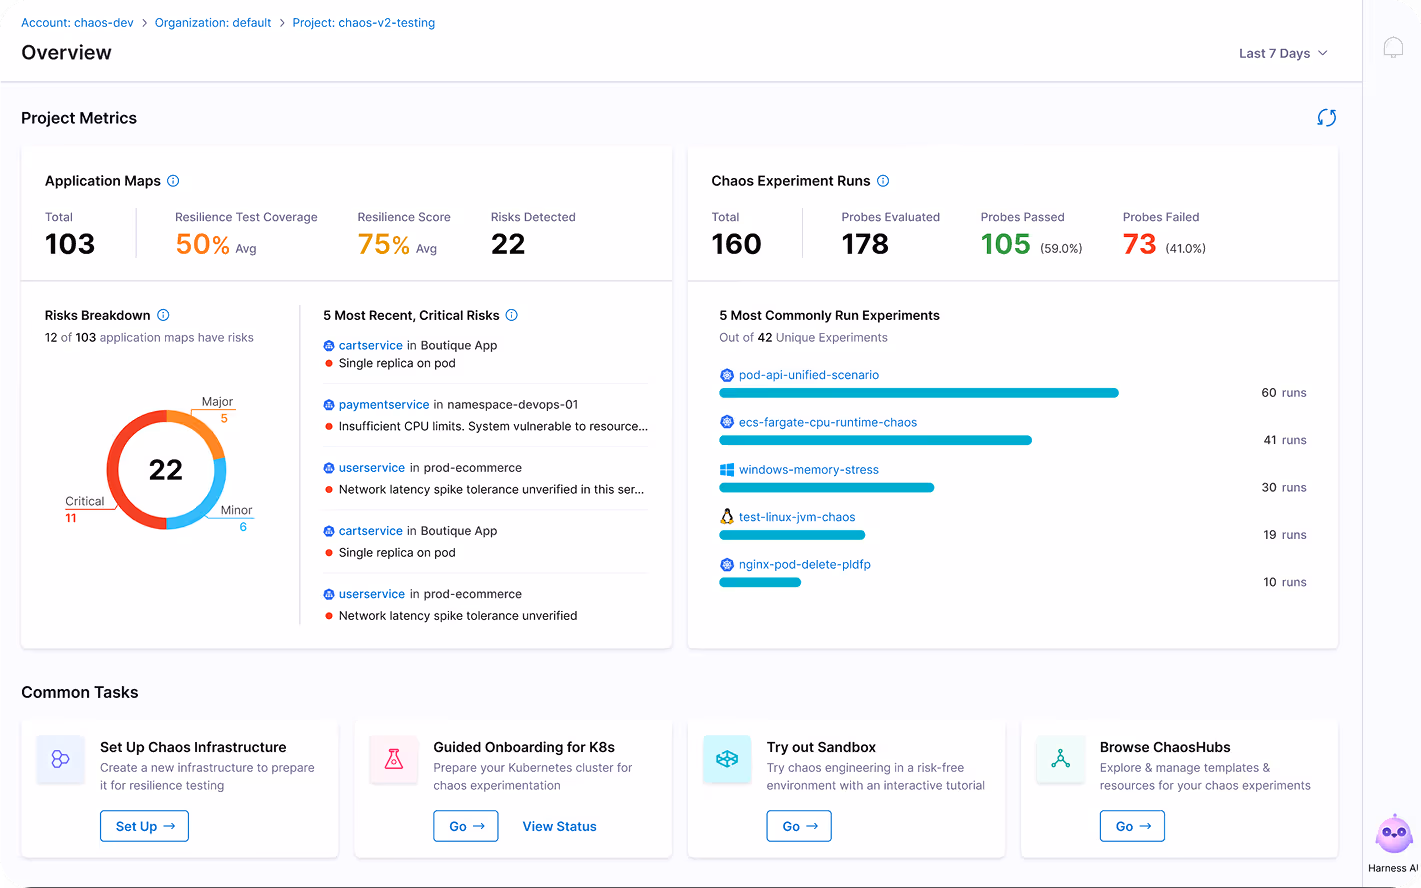
Harness automatically maps out your microservices, APIs, and infrastructure, highlighting dependencies and coverage gaps. This dynamic topology gives QA, Performance Engineers, and SREs immediate visibility into where resilience risks live.
Governed by Design. Secure by Default.
Chaos Engineering should be safe, controlled, and compliant. Harness includes guardrails, access controls, and policy enforcement to ensure resilience testing never puts your business at risk.
Define What’s Allowed And What’s Not
Harness uses OPA and custom policies to enforce rules for chaos experiments.
Streamlined Team Control & Insights
Assigning roles to control chaos experiments and ensure accountability.
Built-In Protections to Prevent Accidents
Using ChaosGuard and Admission Controllers to block unsafe experiments and ensure safety.
Agentless by Default, Secure by Design
Providing agentless resilience testing, simplifying security with no sidecars or persistent agents.
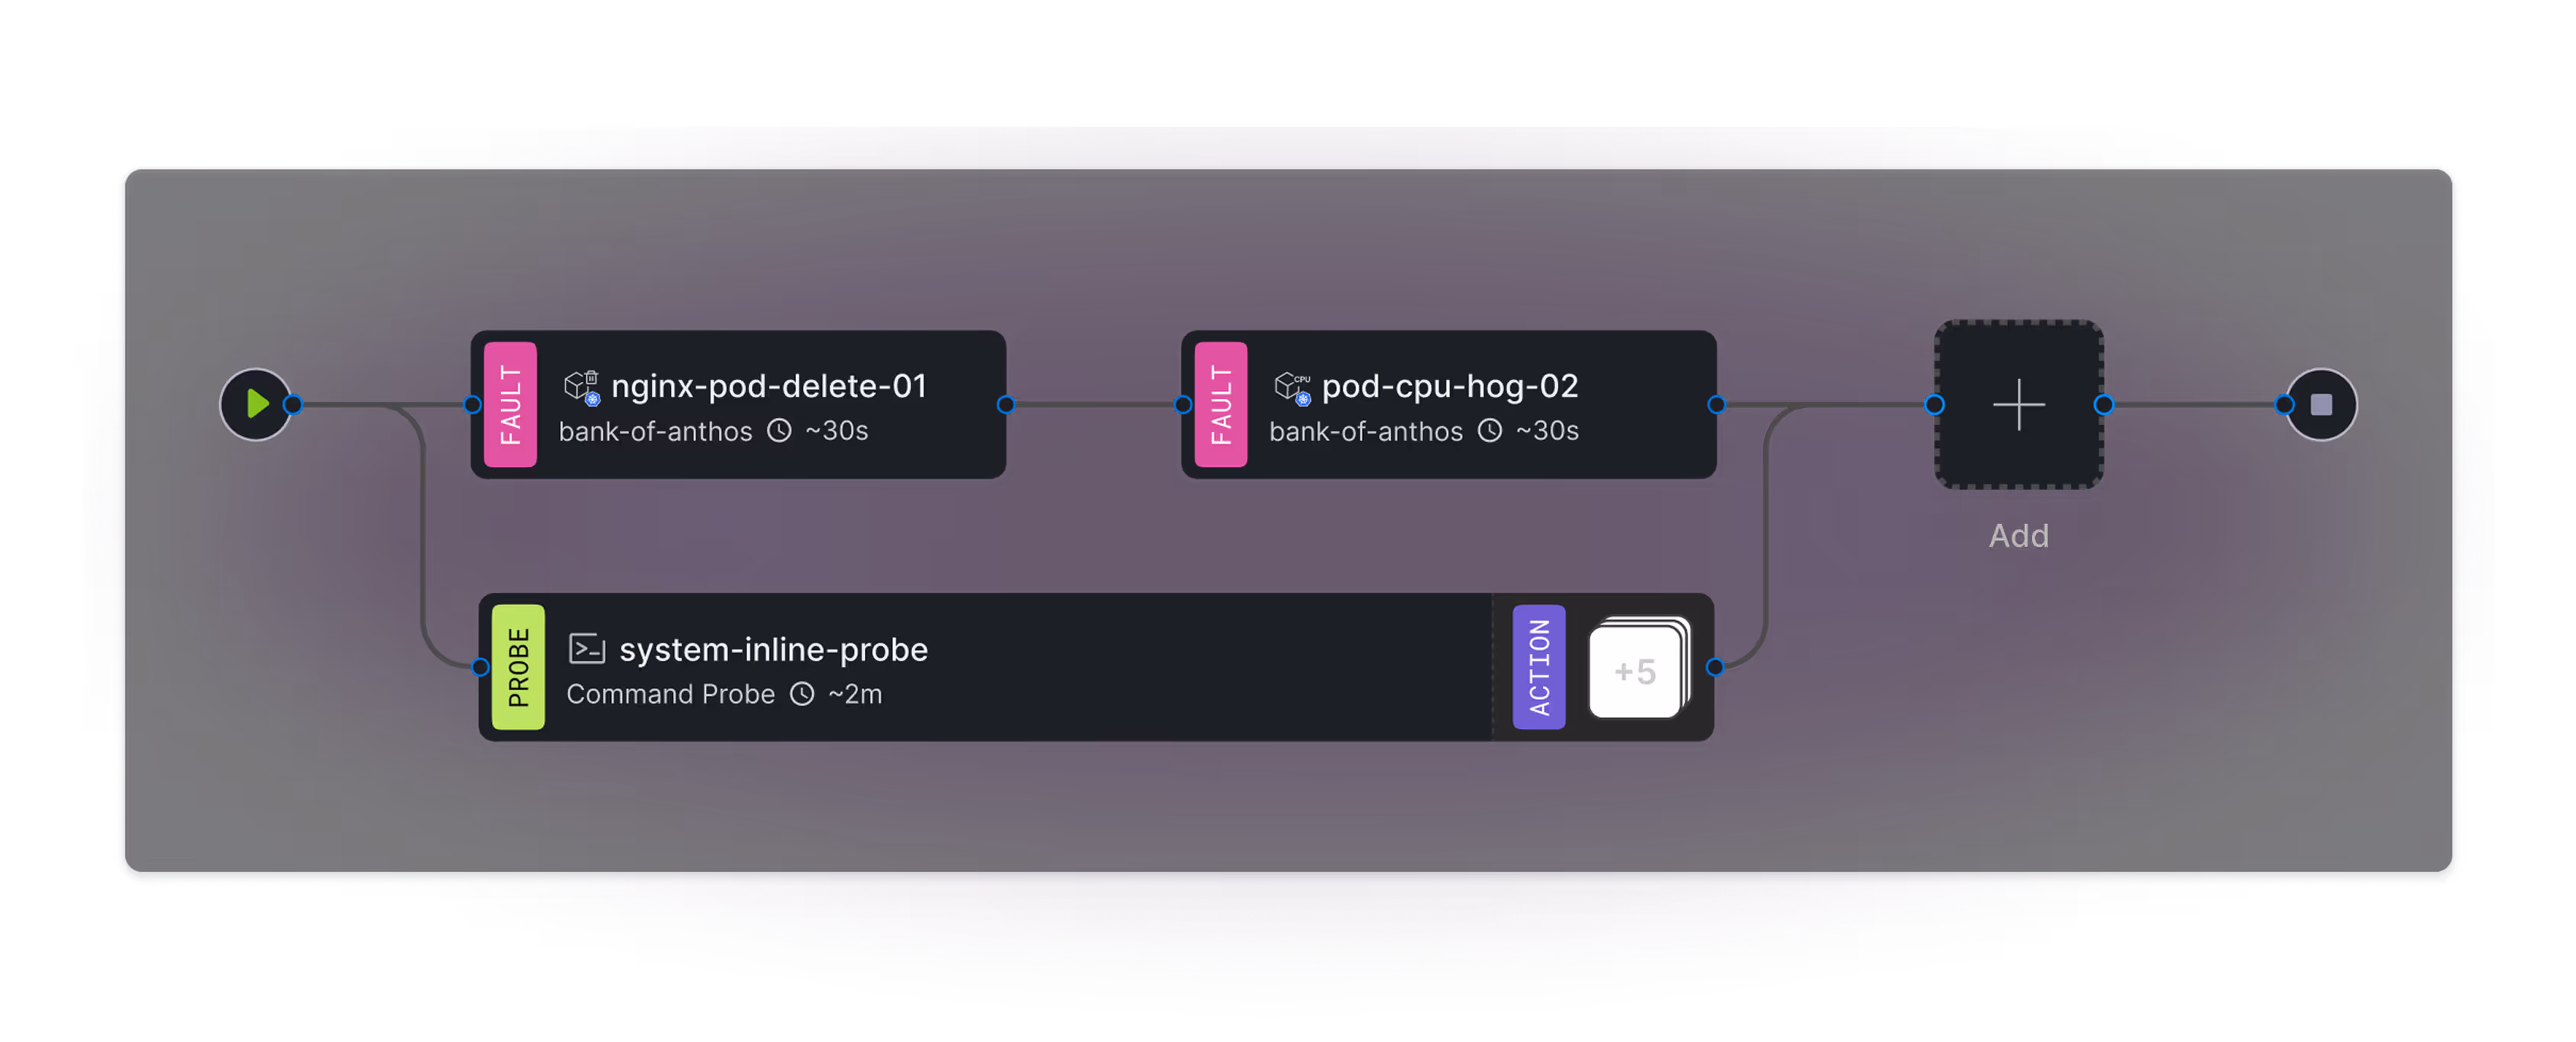
Largest Suite of Resilience Tests
Harness Resilience Testing offers the broadest test coverage for QA teams, performance engineers, and SREs—empowering teams to test everything from APIs and microservices to Kubernetes clusters, cloud infrastructure, and disaster recovery scenarios.
One Platform, Hundreds of Tests, Zero Gaps

QA Engineers
- Test APIs and dependencies for real-world behavior
- Validate functionality under degraded conditions
- Integrate chaos into automated functional test flows

Performance Engineers
- Run CPU, memory, and disk I/O stress tests
- Simulate network latency, packet loss, or throttling
- Combine with load testing to identify performance bottlenecks

SREs & Platform Teams
- Validate runbooks, alerting, and incident response
- Simulate regional cloud failures and infra downtime
- Recreate past incidents for root cause validation
QA Engineers
- Test APIs and dependencies for real-world behavior
- Validate functionality under degraded conditions
- Integrate chaos into automated functional test flows
Performance Engineers
- Run CPU, memory, and disk I/O stress tests
- Simulate network latency, packet loss, or throttling
- Combine with load testing to identify performance bottlenecks
SREs & Platform Teams
- Validate runbooks, alerting, and incident response
- Simulate regional cloud failures and infra downtime
- Recreate past incidents for root cause validation
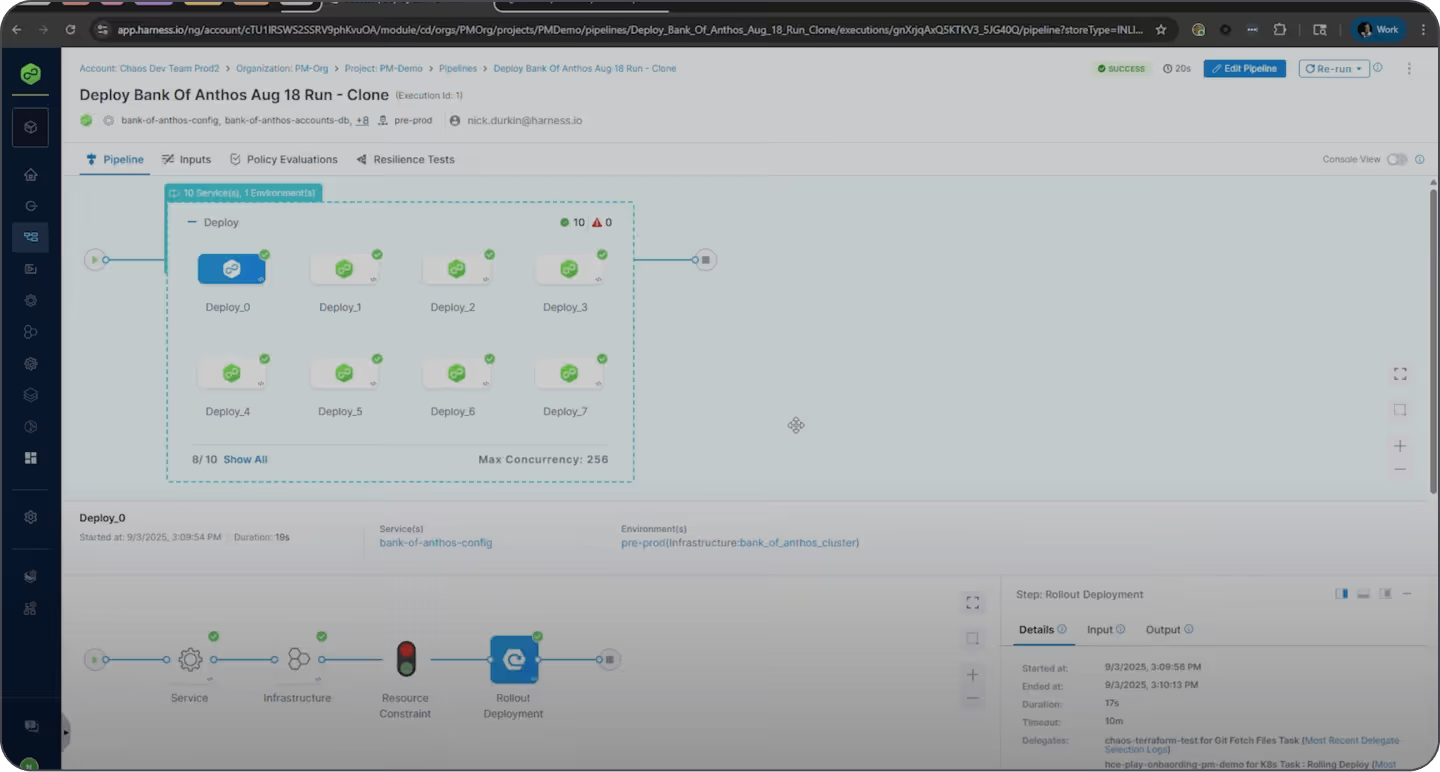
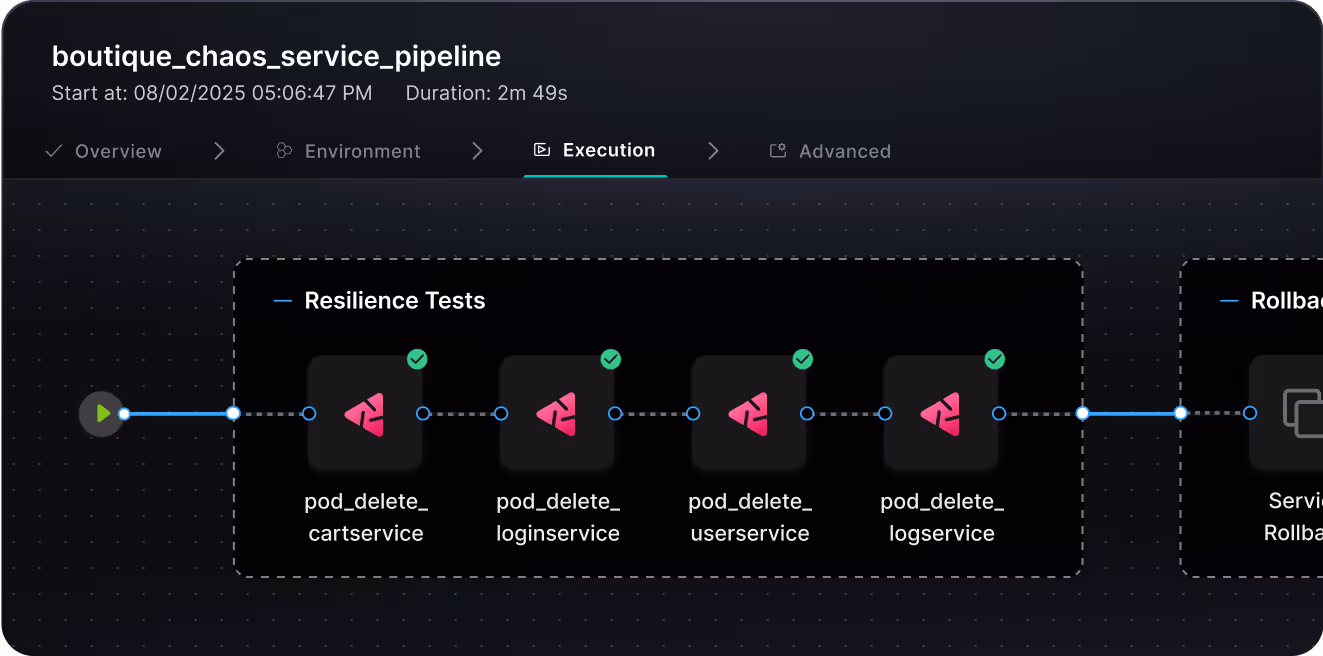
Automated Resilience Testing
Resilience shouldn’t depend on manual effort. Harness integrates seamlessly with your CI/CD pipelines and load testing tools to automatically validate resilience with every build, deploy, or scale event.

Shift from Reactive to Proactive with AI-Powered Automation
Automated Resiliency Testing in Every Pipeline
Harness automatically runs chaos tests before and after deployments to catch issues early and ensure rollback readiness.
- Trigger chaos tests in CI/CD pipelines
- Validate resilience and rollback behavior
- Auto-detect service changes with AI
- Compatible with Jenkins, Gitlab, GitHub Actions, Harness CI/CD, and more
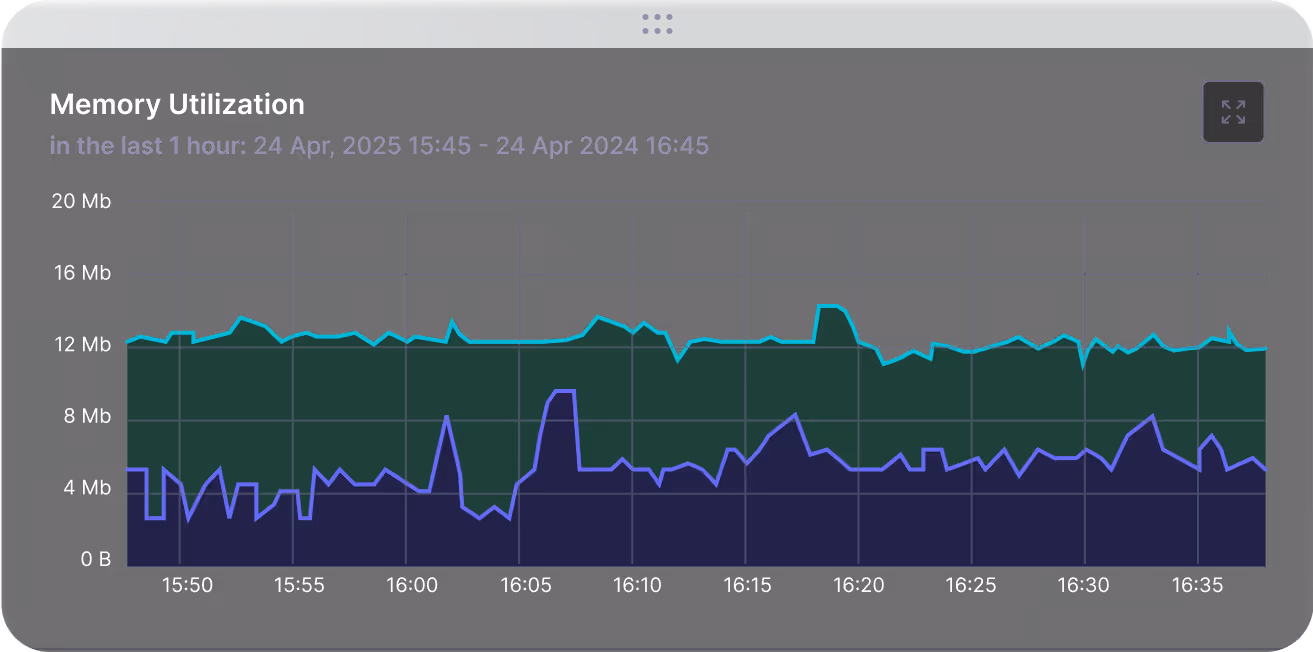
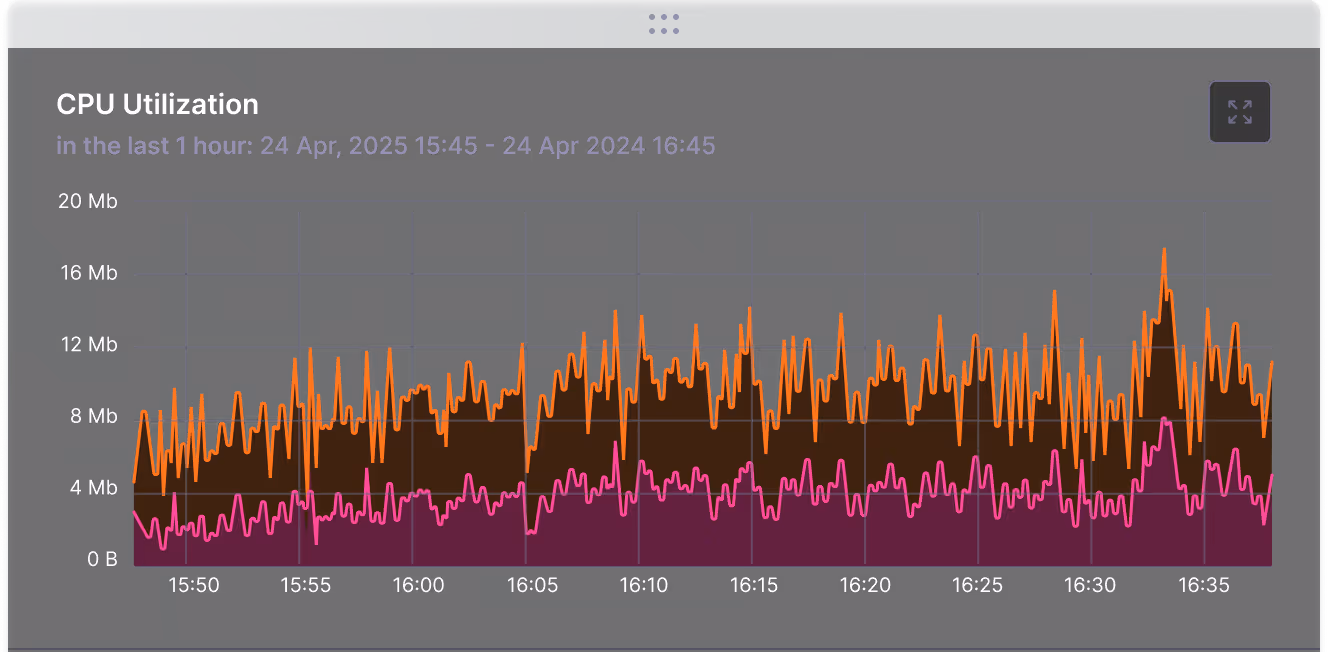
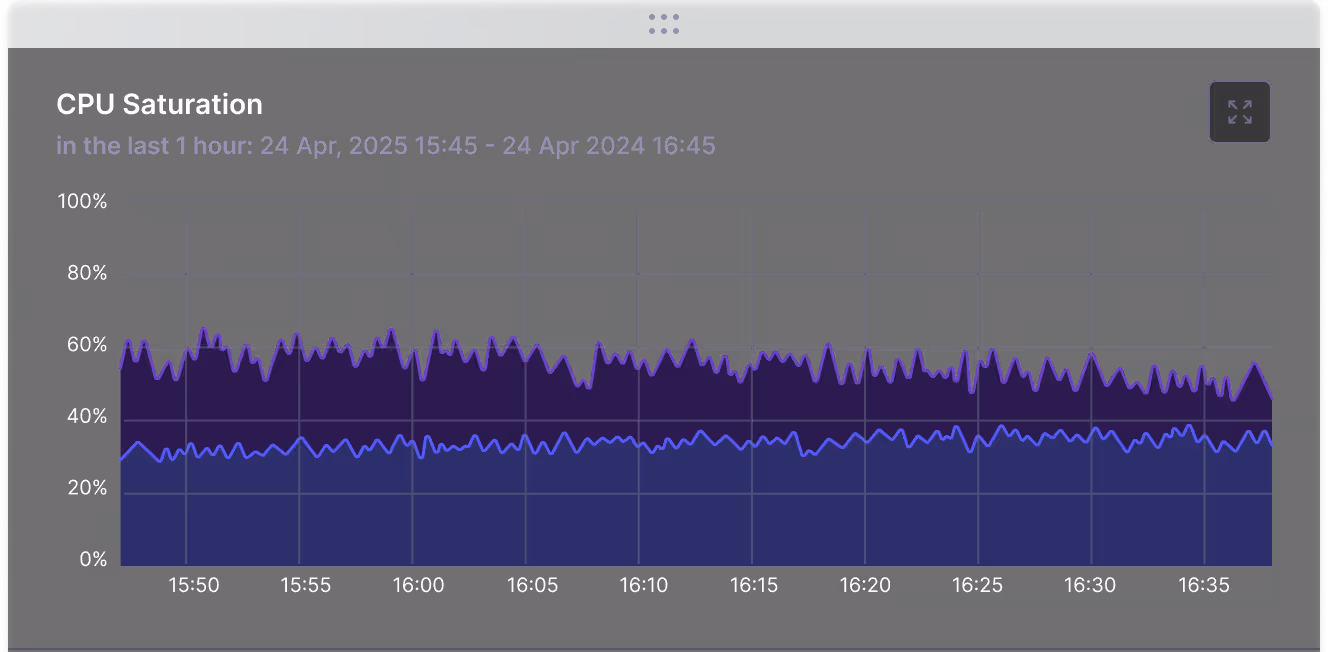
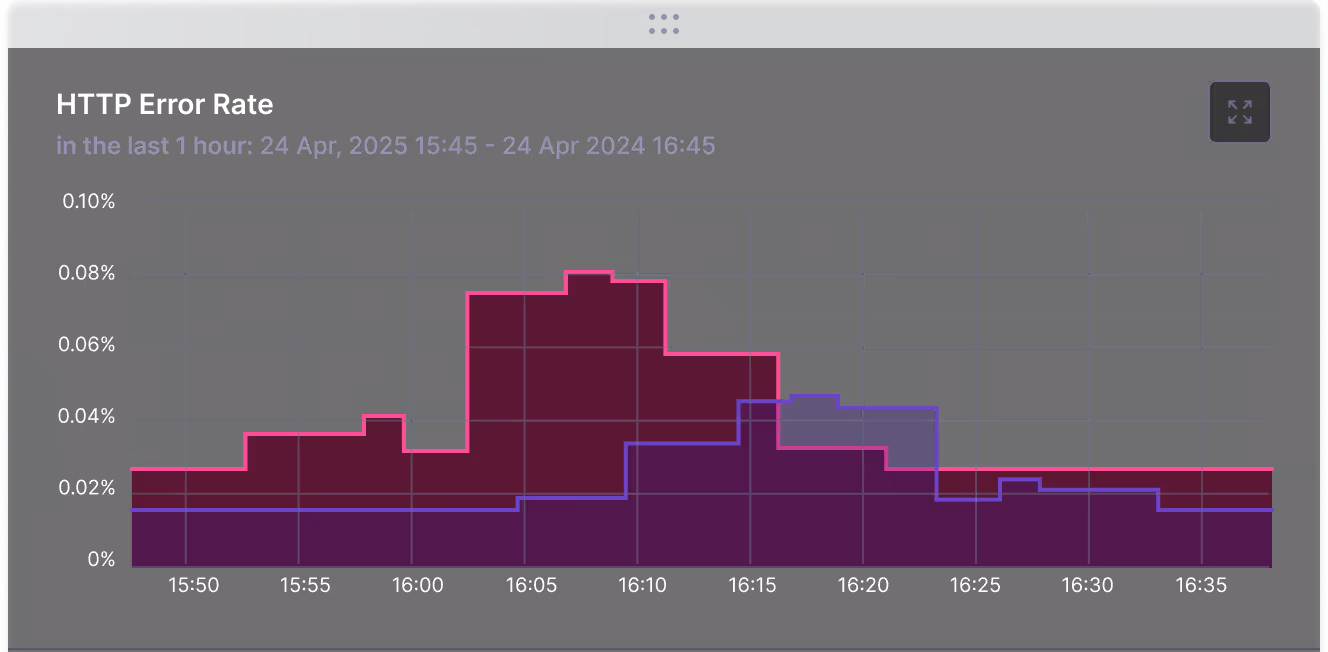
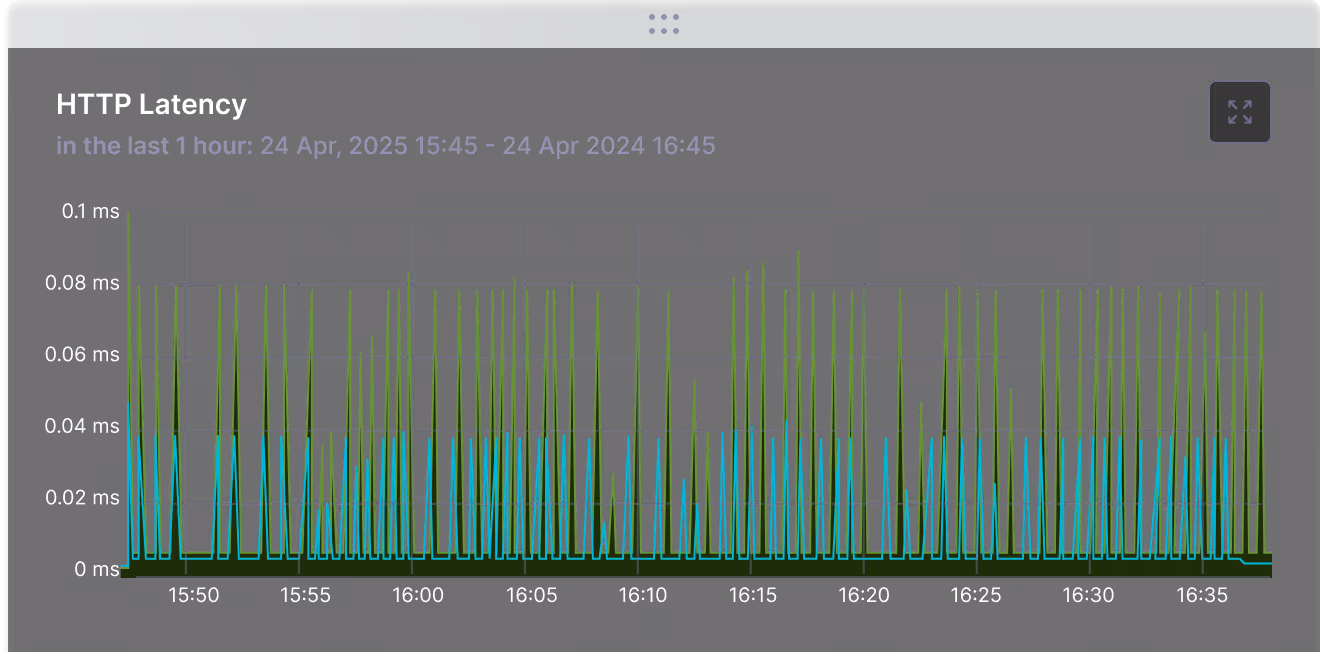
Real-World Resilience with Load + Chaos Test Under Pressure, Not in Production
Simulate real traffic and failures by combining load testing with chaos engineering.
- Auto-run chaos during load tests (e.g., k6, JMeter)
- Validate system response to latency, errors, recovery
- Monitor golden signals via dashboards or APMs
See How Harness Keeps Chaos Safe
Book a demo to walk through our governance and security architecture.
Frequently Asked Questions
How can we continuously test system resilience by integrating Resilience Testing into the CI/CD pipeline?
Harness Resilience Testing integrates automated fault injection directly into the CI/CD pipeline, allowing organizations to conduct continuous resilience testing at multiple stages of development. This proactive approach simulates failures, validates system architecture against defined SLOs, and helps teams identify single points of failure, bottlenecks, and areas requiring improved error handling before they affect production.

What are the prerequisites to setup/onboard Harness Resilience Testing?
Basic prerequisites to get started with Harness Resilience Testing include fulfilling specific requirements mapped to categories like infrastructure connectivity, permissions, and environment configuration before executing chaos experiments. You'll need to configure your Harness account and connect your infrastructure to set up your environment. For automated onboarding, you simply select an environment and infrastructure, and Harness handles discovering services, creating experiments, and executing them.
Can all the chaos operations be managed via APIs (agent, experiment life cycles etc.)?
Yes, all chaos operations can be managed using APIs, including agent management and experiment lifecycles. Harness provides comprehensive APIs for experiments, faults, results, and infrastructure management, with complete GraphQL schema documentation available.
Can a new Kubernetes experiment run on old Kubernetes infrastructure?
Yes, existing chaos experiments can execute without changes even on older infrastructure, as the changes are backward-compatible. However, new experiments created after version 1.38.0 will only work on updated infrastructure .
How is licensing counted for services across different environments with Harness Resilience Testing?
Licensing is counted separately for each service in different environments. For example, if chaos experimentation is conducted on a service named "login-service" in both QA and Production environments within the same 30-day cycle, it consumes two chaos service licenses.