This technical deep-dive reveals how Harness engineers discovered and fixed a critical Go memory leak where reassigning context variables in worker loops created invisible chains that prevented garbage collection across thousands of goroutines, ultimately consuming gigabytes of memory in their CI/CD delegate service.
🧩 The Mystery: A Troubling Correlation Between CPU and Memory
In our staging environment, which handles the daily CI/CD workflows for all Harness developers, our Hosted Harness delegate was doing something curious: CPU and memory rose and fell in a suspiciously tight correlation, perfectly tracking system load.
(For context, Harness Delegate is a lightweight service that runs inside a customer’s infrastructure, securely connecting to Harness SaaS to orchestrate builds, deployments, and verifications. In the Hosted Delegate model, we run it in Harness’s cloud on behalf of customers, so they don’t have to manage the infrastructure themselves.)
At first glance, this looked normal. Of course, you expect CPU and memory to rise during busy periods and flatten when the system is idle. But the details told a different story:
- Memory didn’t oscillate. Instead of rising and falling, it climbed steadily during high-traffic periods and then froze at a new plateau during idle, never returning to baseline.
- Even more telling, CPU perfectly mirrored that memory growth. This near-perfect lockstep hinted that cycles weren’t just spent on real work—they were being burned by garbage collection, constantly fighting against an ever-growing heap.
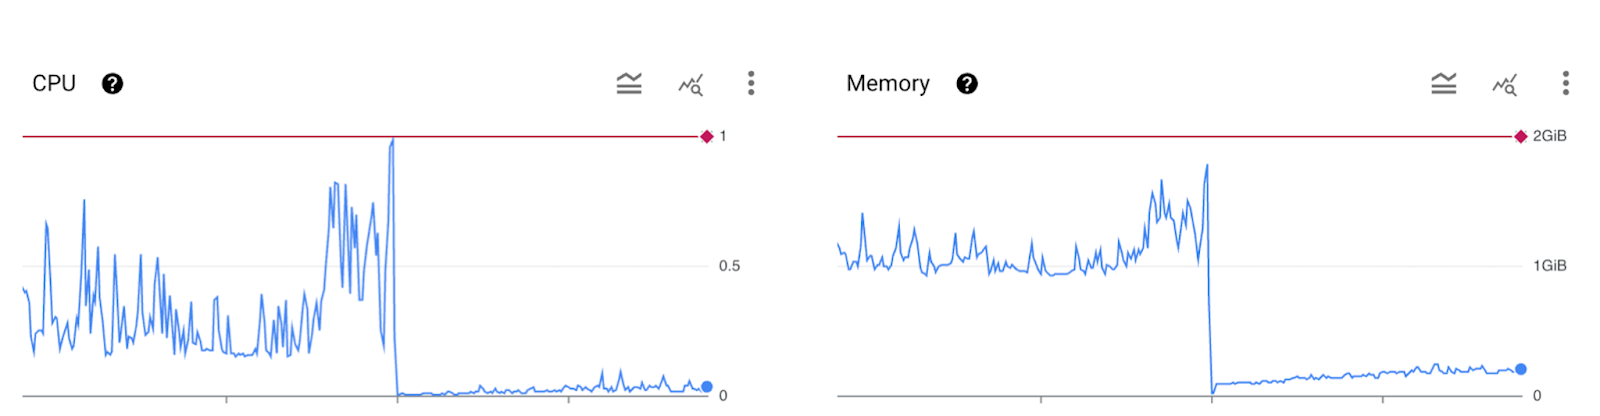
In other words, what looked like “a busy system” was actually the fingerprint of a leak: memory piling up with load, and CPU spikes reflecting the runtime’s struggle to keep it under control.
🔍 The Investigation: Following the Breadcrumbs
The next step was to understand where this memory growth was coming from. We turned our attention to the core of our system: the worker pool. The delegate relies on a classic worker pool pattern, spawning thousands of long-running goroutines that poll for and execute tasks.
On the surface, the implementation seemed robust. Each worker was supposed to be independent, processing tasks and cleaning up after itself. So what was causing this leak that scaled perfectly with our workload?
We started with the usual suspects—unclosed resources, lingering goroutines, and unbounded global state—but found nothing that could explain the memory growth. What stood out instead was the pattern itself: memory increased in perfect proportion to the number of tasks being processed, then immediately plateaued during idle periods.

To dig deeper, we focused on the worker loop that handles each task:
This seemed innocent enough. We were just reassigning ctx to add task IDs for logging and then processing each incoming task.
⚡The Eureka Moment: An Invisible Chain
The breakthrough came when we reduced the number of workers to one. With thousands running in parallel, the leak was smeared across goroutines, but a single worker made it obvious how each task contributed.
To remove the noise of short-lived allocations, we forced a garbage collection after every task and logged the post-GC heap size. This way, the graph reflected only memory that was truly retained, not temporary allocations the GC would normally clean up. The result was loud and clear: memory crept upward with each task, even after a full sweep.
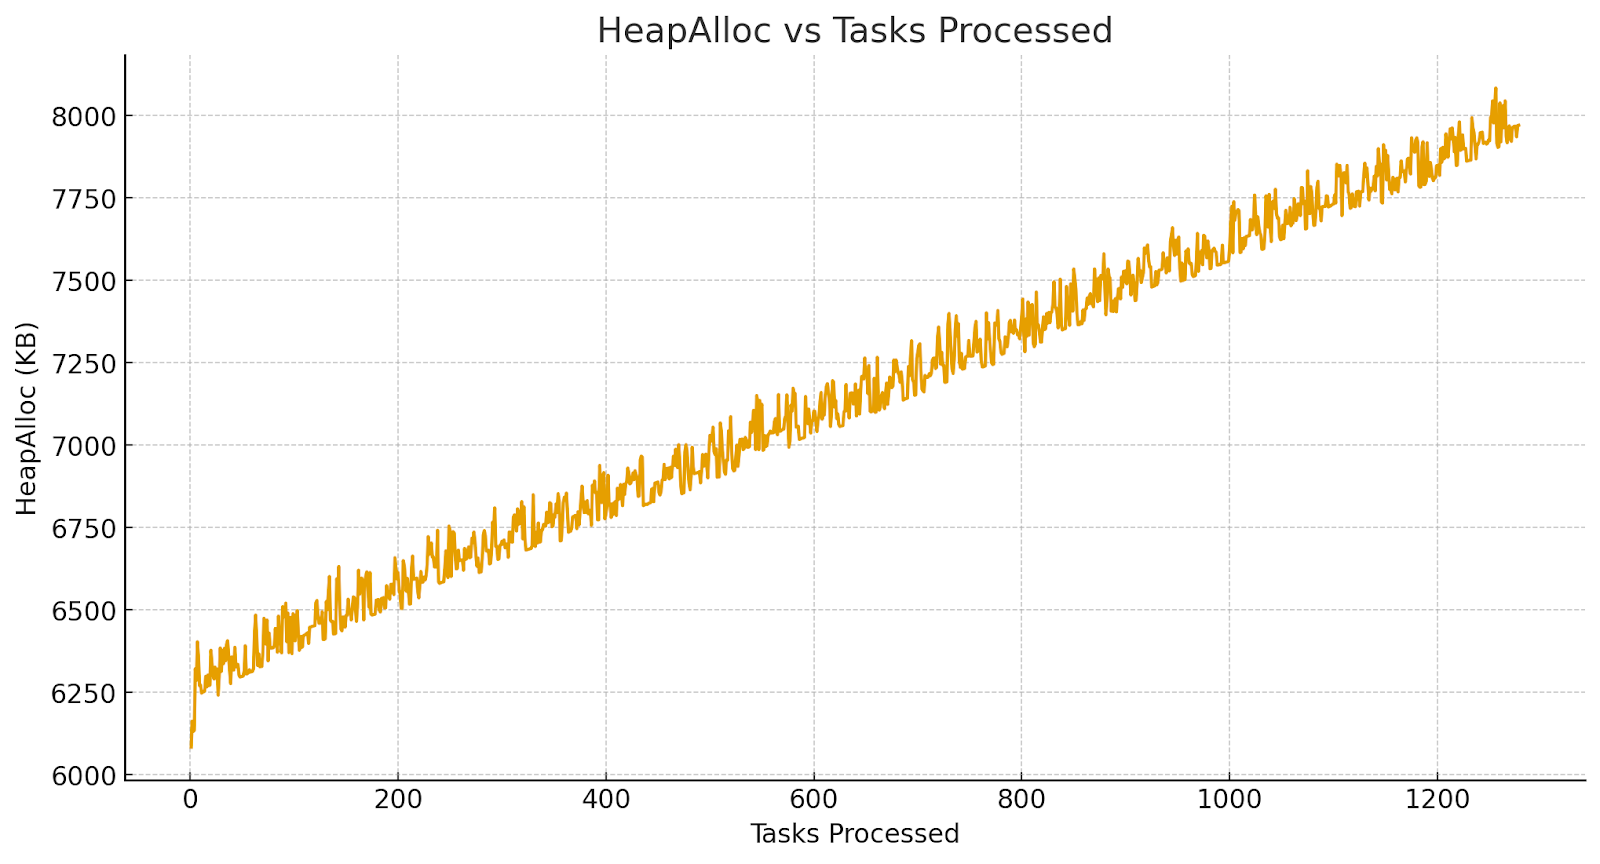
That was the aha moment 💡. The tasks weren't independent at all. Something was chaining them together, and the culprit was Go's context.Context.
A context in Go is immutable. Functions like context.WithValue doesn't actually modify the context you pass in. Instead, they return a new child context that holds a reference to its parent. Our AddLogLabelsToContext function was doing exactly that:
This is fine on its own, but it becomes dangerous when used incorrectly inside a loop. By reassigning the ctx variable in every iteration, we were creating a linked list of contexts, with each new context pointing to the one from the previous iteration:
Each new context referenced the entire chain before it, preventing the garbage collector from ever cleaning it up.
💣 The Damage: A Leak Multiplied
With thousands of goroutines in our worker pool, we didn't just have one tangled chain—we had thousands of them growing in parallel. Each worker was independently leaking memory, one task at a time.
A single goroutine's context chain looked like this:
- Task 1: ctx1 → initialContext
- Task 2: ctx2 → ctx1 → initialContext
- Task 100: ctx100 → ctx99 → ... → initialContext
...and this was happening for every single worker.
📦 Impact (Back-of-the-Envelope Math)
- 1,000 workers × 500 tasks/worker/day = 500,000 new leaked context objects per day.
- After one week: 3.5 million contexts stuck in memory across all workers.
Each chain lived as long as its worker goroutine—effectively, forever.
🔧 The Fix: Breaking the Chain
The fix wasn't concurrency magic. It was simple variable scoping:
The problem wasn't the function itself, but how we used its return value:
❌ ctx = AddLogLabelsToContext(ctx, ...) → chain builds forever
✅ taskCtx := AddLogLabelsToContext(ctx, ...) → no chain, GC frees it
The Universal Anti-pattern (and Where it Hides)
The core problem can be distilled to this pattern:
It's a universal anti-pattern that appears anywhere you wrap an immutable (or effectively immutable) object inside a loop.
Example 1: HTTP Request Contexts
Example 2: Logger Field Chains
Same mistake, different costumes.
📌 Key Takeaways
- Scope variables in loops carefully: Never reassign an outer-scope variable with a "wrapped" version of itself inside a long-running loop. Always use a new, locally-scoped variable for the wrapped object.
- Leaks can be parallel: One small mistake × thousands of goroutines = disaster.
- Simplify to debug: Reducing our test environment to a single worker made the memory growth directly observable and the root cause obvious. Sometimes the best debugging technique is subtraction, not addition.
👀 What's Next?
After fixing this memory leak, we enabled the profiler for the delegate to get better visibility into production performance. And guess what? The profiler revealed another issue - a goroutine leak!
But that's a story for the next article...🕵️♀️
Stay tuned for "The Goroutine Leak Chronicles: When Profilers Reveal Hidden Secrets 🔍🔥"

All this author’s posts
Kiruthika Meena Ravichandran is a DevEx-focused narrative engineer and Senior Software Engineer at Harness, where she builds the core Pipeline and Delegate components that power the Harness platform. Previously, she held engineering roles at VMware and Infoview Technologies.