Blog
Resilience Testing

How to Implement AI-Powered Chaos Engineering Using Natural Language in Your IDE | Harness Blog

Democratize chaos engineering with Harness MCP + Cursor. Execute resilience tests through natural language prompts in your AI-powered IDE.

TL;DR

  • AI-powered chaos engineering eliminates the complexity barrier by enabling resilience testing through natural language conversations instead of manual configuration and vendor-specific training.
  • The Harness MCP Server provides six specialized tools that automate the complete chaos engineering lifecycle, from experiment discovery to result analysis and resilience scoring.
  • Cursor's AI-first development environment makes chaos testing a seamless part of the coding workflow, eliminating context switching between documentation, configuration interfaces, and analysis tools.
  • Teams can execute sophisticated fault injection experiments including pod deletion, network latency, and resource exhaustion without vendor-specific expertise or extensive chaos engineering training.
  • This integration democratizes resilience testing across DevOps, QA, and SRE functions, making proactive system hardening accessible to every developer rather than specialized reliability teams only.

AI-powered chaos engineering with Harness MCP Server and Cursor eliminates the complexity of resilience testing by enabling teams to discover, execute, and analyze chaos experiments through simple natural language prompts. This integration democratizes chaos engineering across DevOps, QA, and SRE teams, allowing them to build robust applications without deep vendor-specific knowledge.

The complexity of modern distributed systems demands proactive resilience testing, yet traditional chaos engineering often presents a steep learning curve that can slow adoption across teams. What if you could perform chaos experiments using simple, natural language conversations directly within your AI-powered code editor?

The integration of Harness Resilience Testing with Cursor through the Model Context Protocol (MCP) makes this vision a reality. This powerful combination enables DevOps, QA, and SRE teams to discover, execute, and analyze chaos experiments without deep vendor-specific knowledge, accelerating your organization's journey toward building a resilience testing culture.

Simplifying Chaos Engineering

Chaos engineering has proven its value in identifying system weaknesses before they impact production. However, traditional implementations face common challenges:

Technical Complexity: Setting up experiments requires deep understanding of fault injection mechanisms, blast radius calculations, and monitoring configurations.

Learning Curve: Teams need extensive training on vendor-specific tools and chaos engineering principles before becoming productive.

Context Switching: Engineers constantly move between documentation, experiment configuration interfaces, and result analysis tools.

Skill Scaling: Organizations struggle to democratize chaos engineering beyond specialized reliability teams.

The Harness MCP integration changes this landscape by bringing chaos engineering capabilities directly into your AI-powered development workflow with Cursor.

Understanding Harness Resilience Testing MCP Tools

The Harness Resilience Testing MCP server provides six specialized tools that cover the complete chaos engineering lifecycle:

Core Experiment Tools

chaos_experiments_list: Discover all available chaos experiments in your project. Perfect for understanding your resilience testing capabilities and finding experiments relevant to specific services.

chaos_experiment_describe: Get details about any experiment, including its purpose, target infrastructure, expected impact, and success criteria.

chaos_experiment_run: Execute chaos experiments with intelligent parameter detection and automatic configuration, removing the complexity of manual setup.

chaos_experiment_run_result: Retrieve detailed results including resilience scores, performance impact analysis, and actionable recommendations for improvement.

Advanced Monitoring Tools

chaos_probes_list: Discover all available monitoring probes that validate system health during experiments, giving you visibility into your monitoring capabilities.

chaos_probe_describe: Get detailed information about specific probes, including their validation criteria, monitoring setup, and configuration parameters.

Setting Up Harness MCP Server with Cursor

Prerequisites

Before beginning the setup, ensure you have:

  • Cursor IDE installed
  • Harness Platform access with Chaos Engineering enabled
  • Harness API key with appropriate permissions
  • Go 1.23+ (to build from source)

Step 1: Build the Harness MCP Server Binary

You have multiple installation options. Choose the one that best fits your environment:

Building from Source

For advanced users who prefer building from source:

Clone the Repository:

git clone https://github.com/harness/mcp-server.git
cd mcp-server

Build the Binary:

go build -o cmd/harness-mcp-server/harness-mcp-server ./cmd/harness-mcp-server

Step 2: Configure the Harness MCP Server in Cursor

  1. Navigate to Cursor Settings
  2. Go to MCP tab
  3. Click "Edit Config" to open your MCP configuration

Add the following configuration:

{ "mcpServers": { "harness": { "command": "/path/to/harness-mcp-server", "args": ["stdio"], "env": { "HARNESS_API_KEY": "your-api-key-here", "HARNESS_DEFAULT_ORG_ID": "your-org-id", "HARNESS_DEFAULT_PROJECT_ID": "your-project-id", "HARNESS_BASE_URL": "https://app.harness.io" } } } }

Step 3: Add Your Harness Credentials

Gather the following information and add it to the configuration:

  • Command: Path to your built harness-mcp-server binary
  • API Key: Generate from your Harness account settings (Profile > My API Keys)
  • Organization ID: Found in your Harness URL or organization settings
  • Project ID: The project containing your chaos experiments
  • Base URL: Your Harness instance URL (typically https://app.harness.io)

Step 4: Verify Installation

  1. Restart Cursor: Close and reopen Cursor to load the new configuration
  2. Check MCP Status: In Cursor settings, verify the Harness MCP server appears as connected
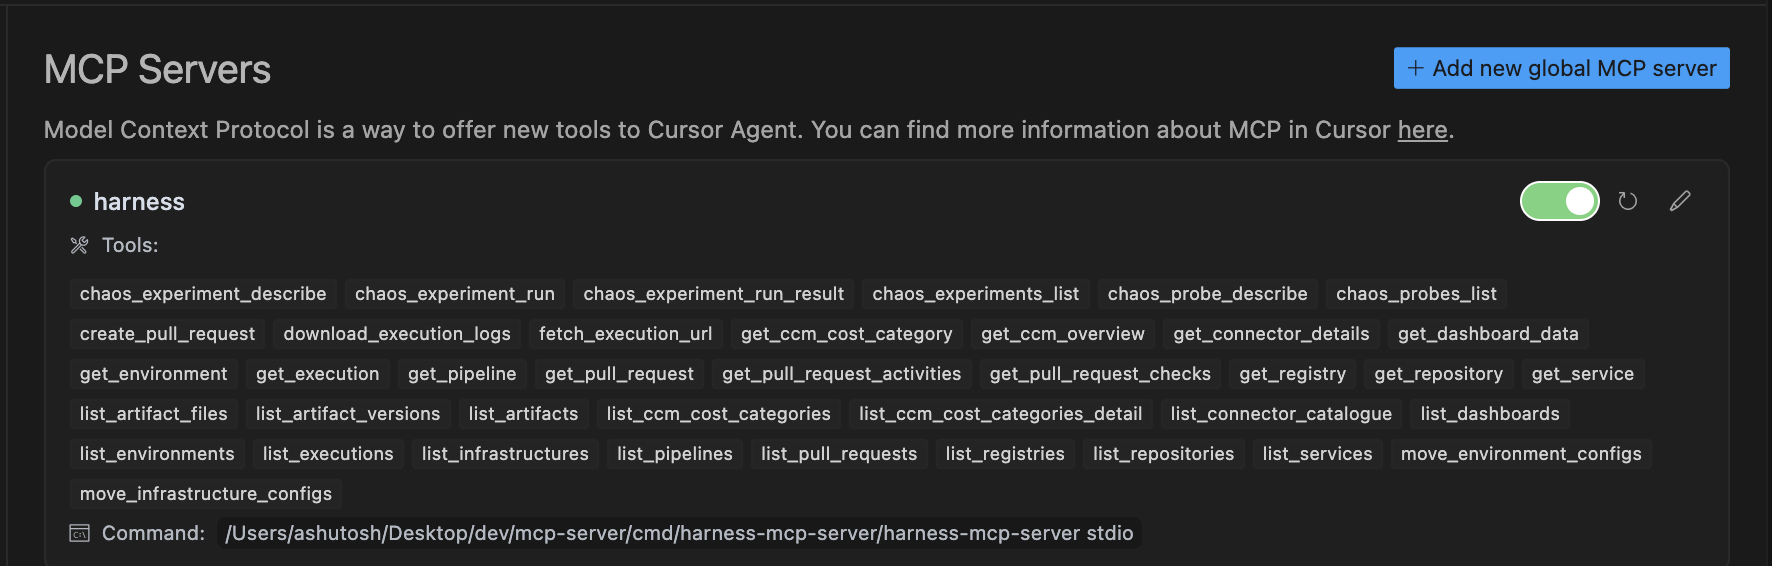
Harness MCP server shown as connected in Cursor settings, displaying a list of available chaos engineering tools
  1. Test Connection: Open Cursor Chat (Cmd/Ctrl + L) and try a simple prompt like:

"List all chaos experiments available in my project"

If successful, you should see chaos-related tools available and receive a response with your experiment list.

AI-Powered Chaos Engineering in Action

With your setup complete, let's explore how to leverage these tools effectively through natural language interactions in Cursor Chat.

Discovery and Learning Phase

Service-Specific Exploration:

"I am interested in catalog service resilience. Can you tell me what chaos experiments are available?"

Expected Output: Filtered list of experiments targeting your catalog service, categorized by fault type (network, compute, storage).

Deep-Dive Analysis:

"Describe briefly what the pod deletion experiment does and what services it targets"

Expected Output: Technical details about the experiment, including fault injection mechanism, expected impact, target selection criteria, and success metrics.

Understanding Resilience Metrics:

"Describe the resilience score calculation details for the network latency experiment"

Expected Output: Detailed explanation of scoring methodology, performance thresholds, and interpretation guidelines.

Experiment Execution Phase

Targeted Experiment Execution:

"Can you run the pod deletion experiment on my payment service?"

Expected Output: Automatic parameter detection, experiment configuration, execution initiation, and real-time monitoring setup.

Structured Overview Creation:

"Can you list the network chaos experiments and the corresponding services targeted? Tabulate if possible."

Expected Output: Well-organized table showing experiment names, target services, fault types, and current status.

Monitoring Probe Discovery:

"Show me all available chaos probes and describe how they work"

Expected Output: Complete catalog of available probes with their monitoring capabilities, validation criteria, and configuration details.

Analysis and Reporting Phase

Result Interpretation:

"Summarise the result of the database connection timeout experiment"

Expected Output: Comprehensive analysis including performance impact, resilience score, business implications, and specific recommendations for improvement.

Probe Configuration Details:

"Describe the HTTP probe used in the catalog service experiment"

Expected Output: Detailed probe configuration, validation criteria, success/failure thresholds, and monitoring setup instructions.

Comprehensive Resilience Assessment:

"Scan the experiments that were run against the payment service in the last week and summarise the resilience posture for me"

Expected Output: Executive-level resilience report with trend analysis, critical findings, and actionable improvement recommendations.

Why Cursor for Chaos Engineering?

Cursor's AI-first approach makes it an ideal platform for chaos engineering workflows:

  • Contextual Intelligence: Cursor understands your codebase, making chaos experiment recommendations more relevant to your specific architecture
  • Seamless Integration: Native AI chat interface eliminates context switching between tools
  • Code-Aware Analysis: Results and recommendations can be directly tied to specific code sections and architectural decisions
  • Real-Time Collaboration: Share chaos engineering insights directly within your development environment

The Road Ahead

The convergence of AI and chaos engineering represents more than a technological advancement - it's a fundamental shift toward more accessible and intelligent resilience testing. By embracing this approach with Harness and Cursor, you're not just testing your systems' resilience, you're building the foundation for reliable, battle-tested applications that can withstand the unexpected challenges of production environments.

The integration of natural language processing with chaos engineering tools democratizes resilience testing, making it accessible to every developer, not just specialized SRE teams. With Cursor's AI-powered development environment, chaos engineering becomes a natural part of your coding workflow.

Start your AI-powered chaos engineering journey today with Cursor and discover how natural language can transform the way your organization approaches system reliability. The future of resilient systems is conversational, intelligent, and integrated directly into your development process.

Important Links:

New to Harness Resilience Testing ?   Signup here

Trying to find the documentation for Chaos Engineering ? Go Chaos Engineering here

Want to build the  Harness MCP server here ? Go GitHub here

Want to know how to setup Harness MCP servers with Harness API Keys ? Go Manage API keys here

← Previous:
Next: →

FAQs

Related Resources

AI-Powered Resilience Testing with Harness MCP Server and Windsurf

Resilience Testing

AI-Powered Resilience Testing with Harness MCP Server and Windsurf

September 15, 2025

Ashutosh Bhadauriya

+ more
Time to Read

The complexity of modern distributed systems demands proactive resilience testing, yet the old-school chaos engineering often presents a steep learning curve that can slow adoption across teams. What if you could perform chaos experiments using simple, natural language conversations directly within your development environment?

The integration of Harness Chaos Engineering with Windsurf through the Model Context Protocol (MCP) makes this vision a reality. This powerful combination enables DevOps, QA, and SRE teams to discover, execute, and analyze chaos experiments without deep vendor-specific knowledge, accelerating your organization's journey toward building a resilience testing culture.

Simplifying Chaos Engineering

Chaos engineering has proven its value in identifying system weaknesses before they impact production. However, traditional implementations face common challenges:

Technical Complexity: Setting up experiments requires deep understanding of fault injection mechanisms, blast radius calculations, and monitoring configurations.

Learning Curve: Teams need extensive training on vendor-specific tools and chaos engineering principles before becoming productive.

Context Switching: Engineers constantly move between documentation, experiment configuration interfaces, and result analysis tools.

Skill Scaling: Organizations struggle to democratize chaos engineering beyond specialized reliability teams.

The Harness MCP integration changes this landscape by bringing chaos engineering capabilities directly into your AI-powered development workflow.

Understanding Harness Chaos Engineering MCP Tools

The Harness Chaos Engineering MCP server provides six specialized tools that cover the complete chaos engineering lifecycle:

Core Experiment Tools

chaos_experiments_list: Discover all available chaos experiments in your project. Perfect for understanding your resilience testing capabilities and finding experiments relevant to specific services.

chaos_experiment_describe: Get details about any experiment, including its purpose, target infrastructure, expected impact, and success criteria.

chaos_experiment_run: Execute chaos experiments with intelligent parameter detection and automatic configuration, removing the complexity of manual setup.

chaos_experiment_run_result: Retrieve detailed results including resilience scores, performance impact analysis, and actionable recommendations for improvement.

Advanced Monitoring Tools

chaos_probes_list: Discover all available monitoring probes that validate system health during experiments, giving you visibility into your monitoring capabilities.

chaos_probe_describe: Get detailed information about specific probes, including their validation criteria, monitoring setup, and configuration parameters.

Setting Up Harness MCP Server with Windsurf

Prerequisites

Before beginning the setup, ensure you have:

  • Windsurf IDE installed 
  • Harness Platform access with Chaos Engineering enabled
  • Harness API key with appropriate permissions
  • Go 1.23+ (to build from source)

Step 1: Build the Harness MCP Server Binary

You have multiple installation options. Choose the one that best fits your environment:

Building from Source

For advanced users who prefer building from source:

  1. Clone the Repository:
git clone https://github.com/harness/mcp-server cd mcp-server

  1. Build the Binary:
go build -o cmd/harness-mcp-server/harness-mcp-server ./cmd/harness-mcp-server

Step 2: Configure the Harness MCP Server in Windsurf

  1. Navigate to your Windsurf Settings, click on Cascade, then Manage MCPs.
Windsurf settings screen showing the Cascade section and the Manage MCPs button
  1. Click on View raw config to open your mcp_config.json file

  1. Add the below configuration to the file
{ "mcpServers": { "harness": { "command": "/path/to/harness-mcp-server", "args": ["stdio"], "env": { "HARNESS_API_KEY": "your-api-key-here", "HARNESS_DEFAULT_ORG_ID": "your-org-id", "HARNESS_DEFAULT_PROJECT_ID": "your-project-id", "HARNESS_BASE_URL": "https://app.harness.io" } } } }

Step 3: Add the Path of your Binary and Harness Credentials

Gather the following information, add it to the placeholders and save the mcp_config.json file.

  • Command: Path to your built harness-mcp-server binary
  • API Key: Generate from your Harness account settings (Profile > My API Keys)
  • Organization ID: Found in your Harness URL or organization settings
  • Project ID: The project containing your chaos experiments
  • Base URL: Your Harness instance URL (typically https://app.harness.io)

Step 4: Verify Installation

  1. Restart Windsurf: Close and reopen Windsurf to load the new configuration
  2. Go back to Mange MCPs, you should see a list of tools available
Windsurf Manage MCP servers screen showing enabled Harness tools like chaos_experiment_describe
  1. Test Connection: Try a simple prompt like:

"List all chaos experiments available in my project"

If successful, you should see chaos-related tools with the "chaos" prefix and receive a response with your experiment list.

AI-Powered Chaos Engineering in Action

With your setup complete, let's explore how to leverage these tools effectively through natural language interactions.

Discovery and Learning Phase

Service-Specific Exploration:

"I am interested in catalog service resilience. Can you tell me what chaos experiments are available?"

Expected Output: Filtered list of experiments targeting your catalog service, categorized by fault type (network, compute, storage).

Deep-Dive Analysis:

"Describe briefly what the pod deletion experiment does and what services it targets"

Expected Output: Technical details about the experiment, including fault injection mechanism, expected impact, target selection criteria, and success metrics.

Understanding Resilience Metrics:

"Describe the resilience score calculation details for the network latency experiment"

Expected Output: Detailed explanation of scoring methodology, performance thresholds, and interpretation guidelines.

Experiment Execution Phase

Targeted Experiment Execution:

"Can you run the pod deletion experiment on my payment service?"

Expected Output: Automatic parameter detection, experiment configuration, execution initiation, and real-time monitoring setup.

Structured Overview Creation:

"Can you list the network chaos experiments and the corresponding services targeted? Tabulate if possible."

Expected Output: Well-organized table showing experiment names, target services, fault types, and current status.

Monitoring Probe Discovery:

"Show me all available chaos probes and describe how they work"

Expected Output: Complete catalog of available probes with their monitoring capabilities, validation criteria, and configuration details.

Analysis and Reporting Phase

Result Interpretation:

"Summarise the result of the database connection timeout experiment"

Expected Output: Comprehensive analysis including performance impact, resilience score, business implications, and specific recommendations for improvement.

Probe Configuration Details:

"Describe the HTTP probe used in the catalog service experiment"

Expected Output: Detailed probe configuration, validation criteria, success/failure thresholds, and monitoring setup instructions.

Comprehensive Resilience Assessment:

"Scan the experiments that were run against the payment service in the last week and summarise the resilience posture for me"

Expected Output: Executive-level resilience report with trend analysis, critical findings, and actionable improvement recommendations.

The Road Ahead

The convergence of AI and chaos engineering represents more than a technological advancement, it's a fundamental shift toward more accessible, and intelligent resilience testing. By embracing this approach with Harness and Windsurf, you're not just testing your systems' resilience, you're building the foundation for reliable, battle-tested applications that can withstand the unexpected challenges of production environments.

Start your AI-powered chaos engineering journey today and discover how natural language can transform the way your organization approaches system reliability.

Harness launches MCP tools to enhance its AI powered Chaos Engineering Capabilities

Resilience Testing

Harness launches MCP tools to enhance its AI powered Chaos Engineering Capabilities

July 10, 2025

Uma Mukkara

+ more
Time to Read

The practice of Chaos Engineering helps in doing resilience testing to get the measurable data for resilience of services or discover the weaknesses in them. Either way, the users will have actionable resilience data around their application services to check compliance and take proactive actions for improvements. This practice is on the rise in recent years because of heavy digital modernisation and move to cloud native systems. A successful adoption of this practice in an Enterprise requires consistent skilling of developers around chaos experimentation and resilience management, which is a challenge in itself.

The uprise in the availability of AI LLMs and associated technology advancements such as AI Agents and MCP Tools make it possible to significantly reduce the skills required to do efficient resilience testing. Users will be able to do the resilience testing successfully with very little knowledge of the vendor tools and the actual chaos experiments details. The MCP tools will do the job of converting simple user prompts in the natural language to the required product API and provide the responses, which then are interpreted nicely by the LLMs.

Harness has published it's MCP server in open source here and the documentation is found here. In this article we are announcing the MCP tools for Chaos Engineering on Harness.

Introducing Chaos MCP tools:

The initial set of chaos tools that is released will help in discovering, understanding and planning the orchestration of chaos experiments for the end users. Following are the tools

  • chaos_experiments_list: List all the chaos experiments for a specific project in the account.
  • chaos_experiment_describe: Get details of a specific chaos experiment.
  • chaos_experiment_run: Run a specific chaos experiment.
  • chaos_experiment_run_result: Get the result of a specific chaos experiment run.

These MCP tools will help the user to start and make progress on resilience testing using simple natural language prompts. 

Following are some of the prompts that user can effectively use with the above tools:

  1. I am interested in catalog service resilience. Can you tell me what chaos experiments are available?
  2. Describe briefly what a particular chaos experiment does?
  3. Describe the resilience score calculation details of a specific chaos experiment?
  4. Can you run a specific experiment for me?
  5. Can you list the network chaos experiments and the corresponding services targeted? Tabulate if possible.
  6. Summarise the result of a particular chaos experiment
  7. Scan the experiments that were run against particular service in the last one week and summarise the resilience posture for me.

An example report would look like the following with Claude Desktop

__wf_reserved_inherit
Resilience Posture report on Claude with Harness MCP Tools

How to setup the Harness MCP Server?

Harness MCP server can be setup in various ways. The installation setup of MCP server is available on the documentation site. Chaos tools are part of the Harness MCP server. Follow the instructions and setup the harness-mcp-server on your AI-editors or local AI desktop application like Claude Desktop. 

How do I get started with resilience testing using Harness MCP tools?

Once MCP server is setup, provide simple natural language prompts to 

  • First, discover the list of chaos experiment capabilities. You can even describe the resilience test scenario that you have in mind and check if your Harness project has suitable chaos experiments
  • Then, understand what each experiment does in detail. 
  • Then, run chaos experiment of your choice and observe the resilience reports
  • Generate resilience summary or brief reports or detailed reports of a particular service or a set of service
  • Tabulate the results of resilience tests

Video Tutorial:

In the below video you can find details of how to configure Harness MCP server on Claude Desktop and do the resilience testing using simple natural language prompts.

Chaos Engineering with Claude Desktop">

Important Links:

New to Harness Chaos Engineering ? Signup here

Trying to find the documentation for Chaos Engineering ? Go here: Chaos Engineering

Want to build the  Harness MCP server here ?  Go here: GitHub

Want to know how to setup Harness MCP servers with Harness API Keys ? Go here: Manage API keys

Load Testing at Scale: Understanding Locust Loadgen in Harness Chaos Engineering

Resilience Testing

Load Testing at Scale: Understanding Locust Loadgen in Harness Chaos Engineering

October 24, 2025

Ashutosh Bhadauriya

+ more
Time to Read

When it comes to building resilient applications, one of the most critical questions you need to answer is this: how will your system perform under heavy load? That's where the Locust loadgen fault in Harness Chaos Engineering comes into play. This powerful chaos experiment helps you simulate realistic load conditions and uncover potential bottlenecks before they impact your users.

What is Locust Loadgen?

Locust loadgen is a chaos engineering fault that simulates heavy traffic on your target hosts for a specified duration. Think of it as a stress test that pushes your applications to their limits in a controlled environment. The fault leverages Locust, a popular open-source load testing tool, to generate realistic user traffic patterns.

The primary goals are straightforward yet crucial. You're stressing your infrastructure by simulating heavy load that could slow down or make your target host unavailable. You're evaluating application performance by observing how your services behave under pressure. And you're measuring recovery time to understand how quickly your systems bounce back after experiencing load-induced failures.

Why Load Testing Matters in Chaos Engineering

Load-related failures are among the most common causes of production incidents. A sudden spike in traffic, whether from a successful marketing campaign or an unexpected viral moment, can bring even well-architected systems to their knees. The Locust loadgen fault helps you answer critical questions.

Can your application handle Black Friday levels of traffic? How does your system degrade when pushed beyond its designed capacity? What's your actual recovery time when load subsides? Where are the weak points in your infrastructure that need reinforcement?

By proactively testing these scenarios, you can identify and fix issues before they affect real users.

Getting Started Prerequisites

Before you can start injecting load chaos into your environment, you'll need a few things in place.

You'll need Kubernetes version 1.17 or higher. This is the foundation that runs your chaos experiments. Make sure your target application or service is reachable from within your Kubernetes cluster.

Here's where things get interesting. You'll need a Kubernetes ConfigMap containing a config.py file that defines your load testing behavior. This file acts as the blueprint for how Locust generates traffic.

Here's a basic example of what that ConfigMap looks like:

apiVersion: v1
kind: ConfigMap
metadata:
  name: load
  namespace: <CHAOS-NAMESPACE>
data:
  config.py: |
    import time
    from locust import HttpUser, task, between
    
    class QuickstartUser(HttpUser):
        wait_time = between(1, 5)
        
        @task
        def hello_world(self):
            self.client.get("")
  

Configuring Your Load Test

The beauty of the Locust loadgen fault lies in its flexibility. Let's walk through the key configuration options that control your chaos experiment.

Target Host

The HOST parameter specifies which application or service you want to test. This is mandatory and could be an internal service URL, an external website, or any HTTP endpoint you need to stress test:

- name: HOST
  value: "https://www.google.com"
  

Chaos Duration

The TOTAL_CHAOS_DURATION parameter controls how long the load generation runs. The default is 60 seconds, but you should adjust this based on your testing needs. For instance, if you're testing autoscaling behavior, you might want a longer duration to observe scale-up and scale-down events:

- name: TOTAL_CHAOS_DURATION
  value: "120"
  

Number of Users

The USERS parameter defines how many concurrent users Locust will simulate. This is perhaps one of the most important tuning parameters. Start conservatively and gradually increase to find your system's breaking point:

- name: USERS
  value: "100"
  

Spawn Rate

The SPAWN_RATE parameter controls how quickly users are added to the test. Rather than hitting your system with 100 users instantly, you might spawn them at 10 users per second, giving you a more realistic ramp-up scenario:

- name: SPAWN_RATE
  value: "10"
  

Custom Load Image

For advanced use cases, you can provide a custom Docker image containing specialized Locust configurations using the LOAD_IMAGE parameter:

- name: LOAD_IMAGE
  value: "chaosnative/locust-loadgen:latest"
  

Seeing It in Action

The real power of the Locust loadgen fault becomes evident when you combine it with observability tools like Grafana. When you run the experiment, you can watch in real-time as your metrics respond to the load surge.

Here's what a complete experiment configuration looks like in practice:

apiVersion: litmuschaos.io/v1alpha1
kind: KubernetesChaosExperiment
metadata:
  name: locust-loadgen-on-frontend
  namespace: harness-delegate-ng
spec:
  cleanupPolicy: delete
  experimentId: d5d1f7d5-8a98-4a77-aca3-45fb5c984170
  serviceAccountName: litmus
  tasks:
    - definition:
        chaos:
          components:
            configMaps:
              - mountPath: /tmp/load
                name: load
          env:
            - name: TOTAL_CHAOS_DURATION
              value: "60"
            - name: USERS
              value: "30"
            - name: SPAWN_RATE
              value: "1000"
            - name: HOST
              value: http://your-load-balancer-url.elb.amazonaws.com
            - name: CONFIG_MAP_FILE
              value: /tmp/load/config.py
          experiment: locust-load-generator
          image: docker.io/harness/chaos-ddcr-faults:1.55.0
      name: locust-loadgen-chaos
      probeRef:
        - mode: OnChaos
          probeID: app-latency-check
        - mode: OnChaos
          probeID: number-of-active-requests
        - mode: Edge
          probeID: app-health-check
  

Notice how this experiment includes probe references. These probes run during the chaos experiment to validate different aspects of your system's behavior, like latency checks, active request counts, and overall health status.

Monitoring the Impact in Grafana

When you run this experiment and monitor your application in Grafana, you'll see the surge immediately. Your dashboards will show operations per second graphs spiking as Locust generates load, access duration metrics increasing as your services come under pressure, request counts climbing across your frontend, cart, and product services, and response times varying as the system adapts to the load.

The beauty of this approach is that you're not just generating load blindly. You're watching how every layer of your application stack responds. You might see your frontend service handling the initial surge well, while your cart service starts showing increased latency. These insights are invaluable for capacity planning and optimization.

Integrating with Chaos Probes

The experiment configuration includes three types of probes that run during chaos.

OnChaos Probes run continuously during the chaos period. In this example, they monitor application latency and the number of active requests. If latency exceeds your SLA thresholds or request counts drop unexpectedly, the probe will catch it.

Edge Probes run at the beginning and end of the experiment. The health check probe ensures your application is healthy before chaos starts and verifies it recovers properly afterward.

This combination of load generation and continuous validation gives you confidence that you're not just surviving the load, but maintaining acceptable performance throughout.

Permissions Required

Security is paramount in any Kubernetes environment. The Locust loadgen fault requires specific RBAC permissions to function properly. Here are the key permissions needed.

You need pod management permissions to create, delete, and list pods for running the load generation. Job management allows you to create and manage Kubernetes jobs that execute the load tests. Event access lets you record and retrieve events for observability. ConfigMap and secret access enables reading configuration data and sensitive information. And chaos resource access allows interaction with ChaosEngines, ChaosExperiments, and ChaosResults.

These permissions should be scoped to the namespace where your chaos experiments run, following the principle of least privilege. The documentation provides a complete RBAC role definition that you can use as a starting point and adjust based on your security requirements.

Best Practices for Load Testing with Locust Loadgen

Start small and scale up. Don't immediately test with production-level loads. Start with a small number of users and gradually increase to understand your system's capacity curve.

Monitor everything. During the chaos experiment, keep a close eye on your application metrics, infrastructure metrics, and logs. The insights you gain are just as important as whether the system stays up.

Test in non-production first. Always validate your chaos experiments in staging or testing environments before running them in production. This helps you understand the fault's impact and refine your configuration.

Customize your load patterns. The default configuration is a starting point. Modify the config.py file to match your actual user behavior patterns for more realistic testing.

Consider time windows. If you do run load tests in production, use the ramp time features to schedule them during low-traffic periods.

Measuring Success

A successful load test isn't just about whether your application survives. Look for response time degradation and how response times change as load increases. Watch error rates to identify at what point errors start appearing. Monitor resource utilization to see if you're efficiently using CPU, memory, and network resources. Observe autoscaling behavior to confirm your horizontal pod autoscalers kick in at the right time. And measure recovery time to understand how long it takes for your system to return to normal once the load subsides.

Wrapping Up

The Locust loadgen fault in Harness Chaos Engineering gives you a powerful tool for understanding how your applications behave under stress. By regularly testing your systems with realistic load patterns and monitoring the results in tools like Grafana, you can identify weaknesses, validate capacity planning, and build confidence in your infrastructure's resilience.

Remember, chaos engineering isn't about breaking things for the sake of it. It's about learning how your systems fail so you can prevent those failures from impacting your users. Load testing with Locust loadgen, combined with continuous monitoring and validation through probes, is an essential part of that journey.

Ready to start your load testing journey? Configure your first Locust loadgen experiment, set up your Grafana dashboards, and watch how your applications respond to pressure. The insights you gain will be invaluable for building truly resilient systems.

Important Links:

New to Harness Chaos Engineering ?  Signup here

Trying to find the documentation for Chaos Engineering ? Go here: Chaos Engineering

Want to build the  Harness MCP server here ? Go here: GitHub

Want to know how to setup Harness MCP servers with Harness API Keys ? Go here: Manage API keys

Get Started

Get Started with Harness AI

Try the full platform free. No module restrictions, no credit card.

Ashutosh Bhadauriya
Senior Developer Relations Engineer
Ashutosh Bhadauriya is a senior Developer Relations Engineer.
ashutosh-bhadauriya
Ashutosh Bhadauriya