
Harness simplifies verifying Kubernetes deployments with its continuous verification feature. Integrating with tools like Prometheus, it ensures deployments meet performance criteria and detects anomalies. This process enables automatic rollbacks, enhances deployment confidence, and maintains service reliability.
Software organizations today are heavily focusing on automation and developer efficiency. No doubt, the DevOps approach gives wings to the software development and delivery teams, but security, logging, and monitoring have become way more important these days. After deploying your application and services to production, it is highly recommended that you monitor them. If any anomalies are detected, correct them then and there before they affect your services and customers. But how can you continuously monitor your services and applications? Need more experienced professionals who understand logging and monitoring; third-party tools are expensive and time-consuming to set up.
Keeping these pain points in mind, Harness (the modern continuous delivery platform) has introduced a feature called continuous verification to help DevOps professionals to verify their deployments through any monitoring tool of their choice.
Today we will talk about continuous verification and show you how to verify your Kubernetes deployments using the Harness continuous verification feature.
What is Continuous Verification?
Continuous Verification (CV) is a practice that involves continuously monitoring and validating the quality of software deployments, making sure that the deployed applications and services are serving as expected. It is a process that ensures that changes made to a software system are deployed successfully and do not negatively impact the system's performance or functionality. In the context of deployments in software, Continuous Verification involves using a monitoring tool such as Prometheus, AppDynamics, NewRelic, Splunk, DataDog, Dynatrace, Cloud Watch, ElasticSearch etc, to validate and confirm that the newly deployed application or service is working correctly. This service/app is always monitored to make sure it always works as expected.
This includes monitoring application performance, and logs, checking for errors and bugs, and ensuring that the application meets all functional requirements. Continuous Verification is a crucial part of the Continuous Delivery (CD) process, which aims to enable software development teams to deliver new software versions rapidly, frequently, and with confidence. By continuously verifying the quality of deployments, development teams can catch issues early, fix them quickly, and ensure that the application is always running smoothly. In case any anomalies are detected, they should be reported and fixed quickly to avoid service downtimes.
Harness Continuous Verification
Harness Continuous Verification is a powerful tool that can help you ensure the quality and performance of your deployments. With Harness, you can easily set up a pipeline to verify your deployments, connecting a variety of monitoring tools of your choice. Once you've set up your verification step in the pipeline, Harness uses unsupervised machine learning to detect anomalies in the deployed applications or services. You can set a threshold for these anomalies, and when they cross the set threshold, the organizations will be able to auto roll back and de-risk their deployments.

The teams get alerts if any issues are detected, and they can view detailed reports on the status of the deployments and take action to fix any issues that arise. Overall, Harness Continuous Verification is an essential feature for any organization that wants to ensure the reliability and quality of their deployments. Harness can do production and post-production deployment verifications to help you make sure that the deployments are taken care of and monitored properly.
To verify deployments in Harness CD with Prometheus, you can follow these simple steps:
- Instrument Your Application: Instrument the relevant components with Prometheus client libraries within your application code. These libraries will expose metrics for Prometheus to scrape. We can wire them through the manifest files.
- Set up Prometheus Endpoints: Ensure you have Prometheus set up and running in your environment to collect and store metrics from your deployments.
- Set Up Verification Step in Harness: Create a verification step in your Harness deployment pipeline. You can integrate the verification step into your deployment pipeline at the desired stage. This verification step should use the Prometheus integration to retrieve metrics from Prometheus and perform checks on the expected values.
Configure Prometheus in Harness Through Connector: Provide the necessary connection details, such as the Prometheus server URL and authentication credentials if required. This step allows Harness to access Prometheus for data retrieval.
Define Verification Criteria with queries: Specify the metrics you want to verify and define the criteria for success or failure. For example, you might verify that a specific metric value remains within an acceptable range or meets a certain threshold. You can configure assertions based on query expressions, comparing values, or checking for specific patterns in the returned metrics.
- Run and Monitor Deployments: Trigger your deployments through Harness CD and monitor the verification step in the pipeline. Harness will automatically retrieve metrics from Prometheus and compare them against the defined criteria and the threshold set. You can view the verification results within Harness or integrate them with other monitoring or notification systems. If any of the metrics exceed the thresholds that you specified, Harness will fail the deployment and you can roll back the deployments.
By following these steps, you can leverage Harness CD's integration with Prometheus to verify your deployments based on the metrics collected by Prometheus.
Let us see how to set up continuous verification functionality practically to verify deployments using Harness CD.
Prerequisites
- Harness account with CD free plan
- Kubernetes cluster access to deploy our sample application
- A Prometheus Endpoint, we will show you how to get it in our tutorial
In this tutorial, we will deploy an application that writes to a Prometheus endpoint and is validated by Harness Continuous Verification.
If you do not have access to Prometheus, you can install the Prometheus on your Kubernetes cluster.
Install Prometheus with Helm.
helm repo add prometheus-community https://prometheus-community.github.io/helm-charts
helm repo update
helm upgrade --install prometheus prometheus-community/prometheus \
--namespace prometheus --create-namespace
The next step would be to expose Prometheus via LoadBalancer.
kubectl expose deployment -n prometheus prometheus-server --type=LoadBalancer --name=prometheus-service
You can easily get the Prometheus endpoints when you expose the service with the LoaddBalancer type, and you can see the endpoints in your dashboard. [I am using GCP to create a cluster]

Tutorial
In this tutorial, you will see how the verification step works with Rolling as well as the Canary deployment strategy.
Sign up for the Harness CD module and get started with creating a pipeline.
Before continuous verification, you should know how to deploy a Kubernetes manifest. Follow this guide and create a simple CD pipeline to deploy a Guestbook application.
Create a project and a CD pipeline, as stated in this tutorial.
After configuring the CD pipeline, you can save and run the pipeline to see a successful deployment.

We successfully deployed our application; Let’s add a verification step to verify the deployment.
Adding Continuous Verification Step
After the successful deployment, edit the pipeline and add a continuous verification step from the step library.

But wait, to be more successful, let’s change the deployment type from Rolling to Canary, as it is considered more effective while releasing new features or a piece of software.

Why Canary Deployment?
Canary deployment is a deployment strategy used in continuous delivery (CD) to mitigate risks and ensure the stability of new releases. It involves gradually rolling out a new version of an application to a subset of users or servers while still routing the majority of traffic to the stable, existing version.
Based on the analysis and verification results, Harness CD can decide whether to proceed with a gradual rollout, increasing the canary deployment's scope, or roll back the deployment entirely if issues are detected. Prometheus metrics play a crucial role in this decision-making process.
By using the canary deployment with Prometheus monitoring in Harness CD, you gain the following benefits:
- Risk Mitigation: Canary deployments allow you to gradually test new versions in a controlled manner, reducing the impact of issues or bugs on your entire user base.
- Performance Validation: Prometheus metrics enable you to evaluate the performance of the new version compared to the stable version, ensuring it meets the desired criteria.
- Automated Decision-making: Integrating Prometheus with Harness CD allows you to automate the analysis and verification process, making deployment decisions based on predefined rules and thresholds.
Even in the ‘Verify’ step, change the ‘Continuous Verification Type’ to ‘Canary’.

You can add the following details to the verification step.
Continuous Verification Type: Canary
Sensitivity: HIGH
Duration: 5 Min
Artifact Tag:
<+serviceConfig.artifacts.primary.tag>

You can click on ‘+ Add’ to add a Health Source. You will be presented with a variety of health and monitoring tools to connect with. Choose the one that is feasible for you. In this tutorial, we will be selecting Prometheus from the list.

Select Prometheus and create a new Prometheus connector. Harness uses Connectors to authenticate and perform operations with a 3rd party tool. Harness uses a Delegate to test the Connector by establishing network connectivity and authentication.

As you can see above, ‘promo-connector’ is my Prometheus connector (you can name whatever you wish). Let’s see how to create this connector and connect with Harness Delegate.

Share your Prometheus endpoint URL.

Connect with the available Delegate.

Make sure the connection to Delegate is successful.

We have successfully added the Prometheus connector.
Click next, and you will land on this query configuration page.

Add all the required details and build your query. You need to create the ‘Group Name’ and you can edit the query tab and add the below query string.
max(
CV_Counter_Example_total {
app="harness-cv-prom-example"
})


Submit, save the pipeline and run the pipeline.
If there are any anomalies detected, you can find them in this console view.

It takes some time to validate the logs, and finally, you can see the successful pipeline with the continuous verification step.

Expand the metric to see the details.

Also, you can easily check the external API calls and execution logs to see the real-time events.


Similarly, you can add other monitoring tools, such as Splunk, NewRelic, DataDog, AppDymanics, etc.
NewRelic Monitoring: Verification Step Failure Scenario
We even took an example of setting up a NewRelic monitoring source with a sample Node.js application.
We followed everything as usual, as we did in the previous tutorial and added NewRelic as the health source in the verification step. The application is getting deployed with the Canary deployment strategy. Would love to show you what happens when the verification step fails. Let’s get started.


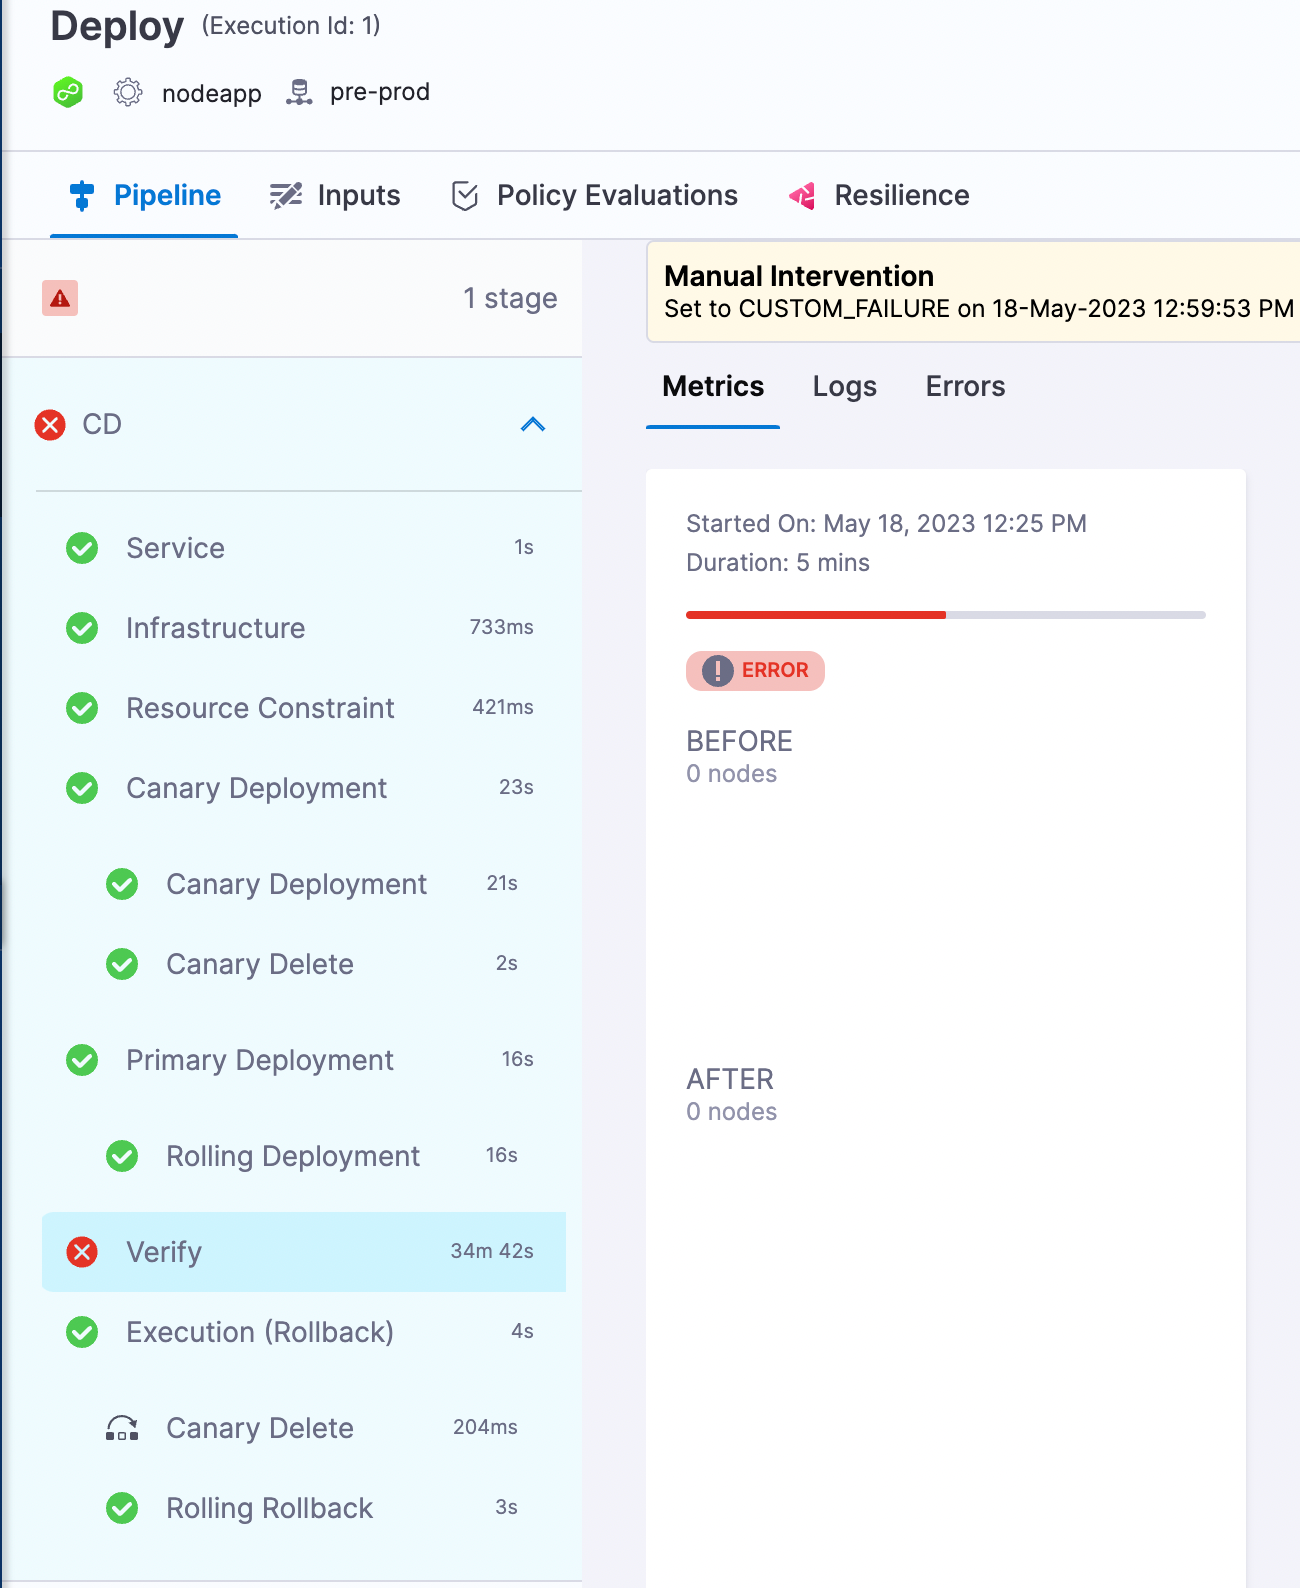
This is what our pipeline looks like.

Purposely we are making the verification step fail here to help you understand how the pipeline works in case of verification failure.

What next? You need to perform an action with the available actions presented. You can rollback, ignore, retry, mark it as a success, abort, proceed with default values or mark it as a failure.
It depends on your team what action you like to perform here in case of verification failure.

In this case, as we said above, you can manually intervene and pick any action that is suitable. Here I picked ‘StageRollback’, and you can see the pipeline execution below.
The Harness continuous verification works really well when you have complex deployments such as multi-service deployments. There are many possibilities with Harness continuous verification to verify your deployments by connecting different logging and monitoring tools. While many organizations don’t take post-deployments and monitoring seriously, this gives you an edge over others to deploy your applications and services confidently.
Learn more: Kubernetes CI/CD Best Practices for Scalable, Secure Deployments

All this author’s posts
Pavan is an award winning developer evangelist.