Featured Blogs
Harness has been recognized as a Leader in the 2026 Gartner® Magic Quadrant™ for DevSecOps Platforms for the third consecutive year. Harness was also positioned furthest on the Completeness of Vision axis in the report.
Our Key takeaways:
- Harness is named a Leader for the third consecutive year
- Harness is positioned furthest on the Completeness of Vision axis
- Harness continues investing in governed, AI-powered DevSecOps
Harness is the AI platform for engineering, security, and operations teams to build, secure, deploy, govern, and optimize software delivery across the SDLC.
We believe our recognition in the Gartner Magic Quadrant for DevSecOps Platforms reflects the continued evolution of the Harness platform and our commitment to helping teams deliver software faster, safer, and with greater governance across the software delivery lifecycle.
We’re thrilled to share this recognition, which we believe reflects the strength of our product strategy, the breadth of our platform, and our continued investment in helping enterprises modernize software delivery with security, reliability, cost management, and AI built into the development lifecycle.
Today, organizations across industries like United Airlines, Ancestry, and Citi rely on Harness to reduce delivery complexity, improve developer productivity, strengthen governance, and accelerate innovation across increasingly complex software environments.
Why This Matters Now
Software delivery has entered a new era. AI coding assistants are helping teams create software faster than ever, but faster code generation also means more changes, more tests, more vulnerabilities, more deployments, and more incidents for organizations to manage. The next era of DevSecOps will not be defined by who can generate code faster. It will be defined by who can safely convert that speed into reliable business outcomes.
Our view is that the future of DevSecOps is autonomous AI agents, governed and directed by expert engineers. As humans and AI agents both contribute to software change, enterprises will need one connected platform to understand, validate, secure, deploy, observe, optimize, roll back, and prove every change across the software delivery lifecycle.
Our Journey
As a pioneer in modern software delivery, Harness offers over 15 platform products and has built one of the industry’s most comprehensive platforms to support the full spectrum of application development, deployment, security, reliability, feature management, cost management, and operations.
Harness has evolved through a combination of product innovation, internal entrepreneurship, open source investment, and strategic acquisitions. We believe our recognition as furthest on the Completeness of Vision axis in the 2026 Gartner® Magic Quadrant™ for DevSecOps Platforms is proof that Harness is solving problems for our customers in a measurable way.
Over the past year, Harness has continued to expand platform capabilities and AI agents across:
- Security and risk management
- AI-native testing capabilities including flaky test detection and AI impact testing
- Feature Management and Experimentation
- Cloud and AI Cost Management
- AI DLC insights
- Resilience Testing, and more
This matters because software delivery is no longer just about building and deploying code. Teams must now manage security risk, release complexity, infrastructure cost, compliance requirements, production reliability, and the growing impact of AI-generated software. The Harness platform allows teams to adopt what they need, when they need it, in one place.
With operations across North America, Europe, APAC, Latin America, and India, Harness serves organizations of all sizes across industries. Customers choose Harness not only for the breadth of the platform but also for the flexibility to adopt individual modules or the full platform based on their needs, maturity, and business priorities.
What’s Next for Harness
This recognition in our opinion is a milestone, and we’re proud, but we’re even more excited by the road ahead.
We build security in the software delivery lifecycle natively, not as a separate stage or disconnected toolchain. As AI increases the volume of code, changes, and security findings, enterprises will need platforms that connect detection, prioritization, policy, remediation, deployment, and runtime defense into a single, governed workflow.
Harness is focused on helping enterprises meet that moment. We will continue investing in AI software delivery to help teams move faster without losing control. Our goal is to help every organization deliver software that is faster to build, safer to release, easier to govern, and more resilient in production.
Thank you to our customers, partners, employees, and community for your continued trust. We’re excited about the journey ahead and can’t wait to show you what’s next.
Learn More
Get a complimentary copy of the 2026 Gartner® Magic Quadrant™ for DevSecOps Platforms.
Or, to talk to someone about Harness, please contact us.
Gartner Disclaimer
Gartner, Magic Quadrant for DevSecOps Platforms, 2026, Keith Mann, Thomas Murphy, Bill Holz, 15 June 2026
Gartner does not endorse any vendor, product, or service depicted in its research publications and does not advise technology users to select only those vendors with the highest ratings or other designation. Gartner research publications consist of the opinions of Gartner’s research organization and should not be construed as statements of fact. Gartner disclaims all warranties, expressed or implied, with respect to this research, including any warranties of merchantability or fitness for a particular purpose.
GARTNER is a registered trademark and service mark of Gartner, and Magic Quadrant is a registered trademark of Gartner, Inc. and/or its affiliates in the U.S. and internationally, and is used herein with permission. All rights reserved.

Today, we're thrilled to announce a significant leap forward in our commitment to AI-driven innovation. Harness, a leader in AI-native software delivery, is proud to introduce three powerful AI agents designed to transform how teams create, test, and deliver software.
Since introducing Continuous Verification in 2018, Harness has been at the forefront of leveraging AI and machine learning to enhance software delivery processes. Our latest announcement reinforces our position as an industry pioneer, offering a comprehensive suite of AI-powered tools that address critical challenges across the entire software delivery lifecycle (SDLC).
Our vision is a multi-agent architecture embedded directly into the fabric of the Harness platform. We’re building a powerful library of ‘assistants’ designed to make software delivery faster, more efficient, and more enjoyable for developers. These AI-driven agents will work seamlessly within our platform, handling everything from automating complex tasks to providing real-time insights, freeing developers to focus on what they do best: creating innovative software.
Let's explore the capabilities of these new AI agents and see how they will reshape the future of software delivery.
AI QA Assistant: End-to-End Test Automation
The Harness AI QA Assistant is a game-changer in the world of software testing. This generative AI agent is purpose-built to simplify end-to-end automation and accelerate the transition from manual to automated testing. End-to-end tests have been plagued by slow authoring experiences that yield brittle tests, which need to be tended to every time the UI changes.

By harnessing the power of AI, this assistant offers a range of benefits that can dramatically improve your testing processes:
- 10x Faster Test Creation: One of the most significant advantages of the AI QA Assistant is its ability to accelerate test creation. Through a generative AI-powered, no-code platform, teams can now create high-quality tests in a fraction of the time it would take to hand-script them. This capability democratizes test creation, enabling team members across various skill levels to contribute to the testing process effectively. Harness will help teams enhance their tests as well. By proactively recommending additional checks and assertions, the assistant makes it easy to improve the depth of your testing.
- 70% Less Test Maintenance: Test maintenance has long been a thorn in the side of QA teams, consuming valuable time and resources. The AI QA Assistant addresses this pain point head-on with AI-driven test execution and self-healing capabilities. The AI understands the intent behind a test. If the UI changes, it will identify the new path to achieving the same intent. By automatically adapting tests to application changes, it minimizes the need for manual maintenance, freeing up your team to focus on more strategic tasks.
- 5x Faster Release Cycles: By eliminating manual testing bottlenecks, the AI QA Assistant paves the way for significantly faster release cycles. Integrating AI-powered automated testing into your CI/CD pipeline streamlines the entire process, allowing you to ship faster and more confidently.
Sign up today for early access to the AI QA Assistant.
AI DevOps Assistant: Better Pipelines Faster
Crafting pipelines can be challenging. You need to consider your core build and deployment activities, as well as best practices around security scans, testing, quality gates, and more. The new Harness AI DevOps Assistant will make creating great pipelines much easier.

- Create Pipelines in Seconds: Gone are the days of spending hours configuring complex pipelines. The AI DevOps Assistant allows you to create comprehensive pipelines in mere seconds. By leveraging AI to understand your application’s requirements and your teams’ preferred tools, policies, and patterns, it can generate optimized pipeline configurations rapidly, saving valuable time and reducing the potential for mistakes.
- Effortless Pipeline Modification with Natural Language: You can also use the DevOps assistant to refine existing pipelines. The AI DevOps Assistant understands natural language commands, allowing you to modify your pipelines effortlessly. Whether you need to add a new stage, adjust deployment parameters, or integrate a new tool, you can simply describe the changes you want, and the assistant will implement them accurately.
- Proactive Suggestions: The DevOps Assistant provides intelligent suggestions to optimize your pipelines. It analyzes your current pipeline configurations against Harness recommended best practices and identifies areas for improvement. These suggestions can help reduce build times, enhance reliability, and ensure your pipelines align with industry standards.
- Automatic Diagnosis and Remediation of Common Failures: Minimizing downtime is crucial. The AI DevOps Assistant excels in this area by automatically diagnosing common pipeline failures and providing immediate remediation steps. This proactive approach to problem-solving can significantly reduce the mean time to recovery (MTTR) for your pipelines, ensuring smoother, more reliable software delivery.
The introduction of the AI DevOps Assistant marks a significant milestone in our mission to simplify and streamline the software delivery process for the world’s developers. By automating complex tasks, and providing intelligent insights, this capability empowers teams to focus on innovation rather than getting bogged down in pipeline management intricacies.
Sign up today for early access to the AI DevOps Assistant.
AI Code Assistant: Boosting Developer Productivity
The Harness AI Code Assistant accelerates developer productivity by streamlining coding processes and providing instant access to relevant information. This intelligent tool integrates seamlessly into the development workflow, offering a range of features that enhance coding efficiency and quality:
- Intelligent Code Completion: As developers write code, the AI Code Assistant recommends relevant code snippets, helping to accelerate the coding process. This feature is particularly useful for repetitive tasks or when working with unfamiliar libraries or frameworks.
- Natural Language Function Generation: Developers can describe the desired functionality using natural language, and the AI Code Assistant will generate entire functions based on that description. This capability bridges the gap between concept and implementation, allowing developers to prototype ideas or tackle complex coding challenges quickly.
- Code Refactoring and Debugging: Harness helps improve code quality by offering refactoring suggestions and helping identify and resolve bugs. This proactive approach to code improvement can lead to more robust and maintainable codebases.
- Interactive Code Explanation: An intuitive chatbot feature allows developers to ask questions about specific pieces of code and receive clear explanations that enhance understanding and facilitate knowledge sharing within teams.
- Semantic Search: When integrated with the Harness Code Repository, the AI Code Assistant enables powerful semantic search capabilities using natural language queries. This feature is particularly valuable for quickly navigating and understanding complex repositories, making it easier for new team members to onboard and for experienced developers to explore unfamiliar parts of the codebase.
- Pull Request Generation: The AI Code Assistant frees up valuable developer time by taking care of routine tasks like generating pull request comments, allowing teams to focus on high-value activities that drive innovation and product improvement.

The Harness AI Code Assistant is more than just a coding tool; it's a comprehensive solution that enhances developer productivity, improves code quality, and fosters a more efficient and collaborative development environment. The AI Code Assistant is available today for all Harness customers at no additional charge.
Embracing the AI-Powered Future of Software Delivery
Software delivery is changing fast. Generative AI has helped organizations code faster than ever. The rest of the delivery pipeline must keep up to take full advantage of these efficiencies.
These tools - the Harness AI QA Assistant, AI DevOps Assistant, and AI Code Assistant represent more than just technological advancements. They embody a shift in how we approach software development, testing, and delivery. By automating routine tasks, providing intelligent assistance, and offering deep insights into development processes, these AI agents eliminate toil, freeing up human creativity and expertise to focus on solving complex problems and driving innovation.
As we move forward, the integration of AI into software delivery processes will become increasingly crucial for organizations looking to maintain a competitive edge. The ability to deliver high-quality software faster, more reliably, and with greater insight will be a key differentiator in the digital marketplace.
Harness is committed to leading this AI-driven transformation of the software delivery landscape. We invite you to join us on this exciting journey toward a future where AI and human expertise work in harmony to create exceptional software experiences.
Stay tuned for more updates as we continue to innovate and shape the future of software delivery. If you want to try any of these capabilities early, sign up here.
Checkout Event: Revolutionizing Software Testing with AI
Checkout Harness AI Code Agent
Explore more resources: 3 Ways to Optimize Software Delivery and Operational Efficiency
Latest Blogs

Harness Launches Two Products to Give Enterprise Teams Full Visibility into ROI of AI Spend
Gartner expects worldwide AI software spending to hit $2.59 trillion in 2026, 47% more than organizations spent last year. The dollars are real and growing fast. But most organizations still can't measure the ROI of that spend.
The problem has two sides: developers and infrastructure. On the developer side, engineers are using AI to write nearly every line of new code, and leaders have no way to tell whether that spend is producing software that ships. On the infrastructure side, agents in production consume tokens with every customer interaction, every resolved ticket, every automated workflow, and the invoice is the only signal on whether any of it is worth what it costs.
Organizations can tell you what they spend on AI. Very few can tell you what they got for it. According to our 2026 State of Engineering Excellence report, 94% of engineering leaders say the metrics that matter most are missing from their current measurement frameworks.
Today, Harness is launching two products to close both gaps.
AI DLC Insights builds on Harness Software Engineering Insights and ties every AI-generated line of code to the PR, ticket, and deployment it produced, so engineering leaders can see where token spend is turning into shipped work and where it isn't.
Cloud & AI Cost Management extends Harness Cloud Cost Management with unit economics, anomaly detection, and budget governance for every dollar of AI infrastructure spend, so the question "is this agent worth what it costs?" finally has a number behind it.
"AI spend isn't the conversation anymore — ROI is. Every dollar we put into AI, from tokens consumed to customers served, has to earn its keep. That's what my executives are asking about today."
Josefa Roche, Sr. Cloud FinOps Engineer, Revionics, an Aptos Company
Developer Token Costs: AI DLC Insights
Every developer writing software today is coding with AI. Copilot, Cursor, Claude, Gemini: the tools vary but the pattern is universal. Adoption is not the problem.
The problem is that token spend has never been connected to efficiency or outcomes. Developers generate code with AI coding agents, a fraction of it ships, prompts are longer than necessary, and generated code gets rejected in review. Engineering leaders have no visibility into any of it — not the ship rate, not the wasted tokens, not the rejected code.
Harness CEO Jyoti Bansal recently described this behavior as tokenmaxxing: an engineer burns 500K tokens generating code that gets rejected in review. By the leaderboard, they beat the engineer who shipped a clean 50-line patch. Tokenmaxxing made sense as a forcing function when adoption was the goal. That phase has an expiration date.
AI DLC Insights includes a new on-machine developer agent that runs directly in the developer's environment. It observes the IDE and terminal in real time, captures every AI-generated line of code, records the token cost per model and tool, and maps that spend through the delivery chain to the PR, the ticket, and the deployment that shipped.
An engineering leader can now say "it cost us $5,200 in AI credits to fix that bug" and mean it. Here’s what’s in the release:
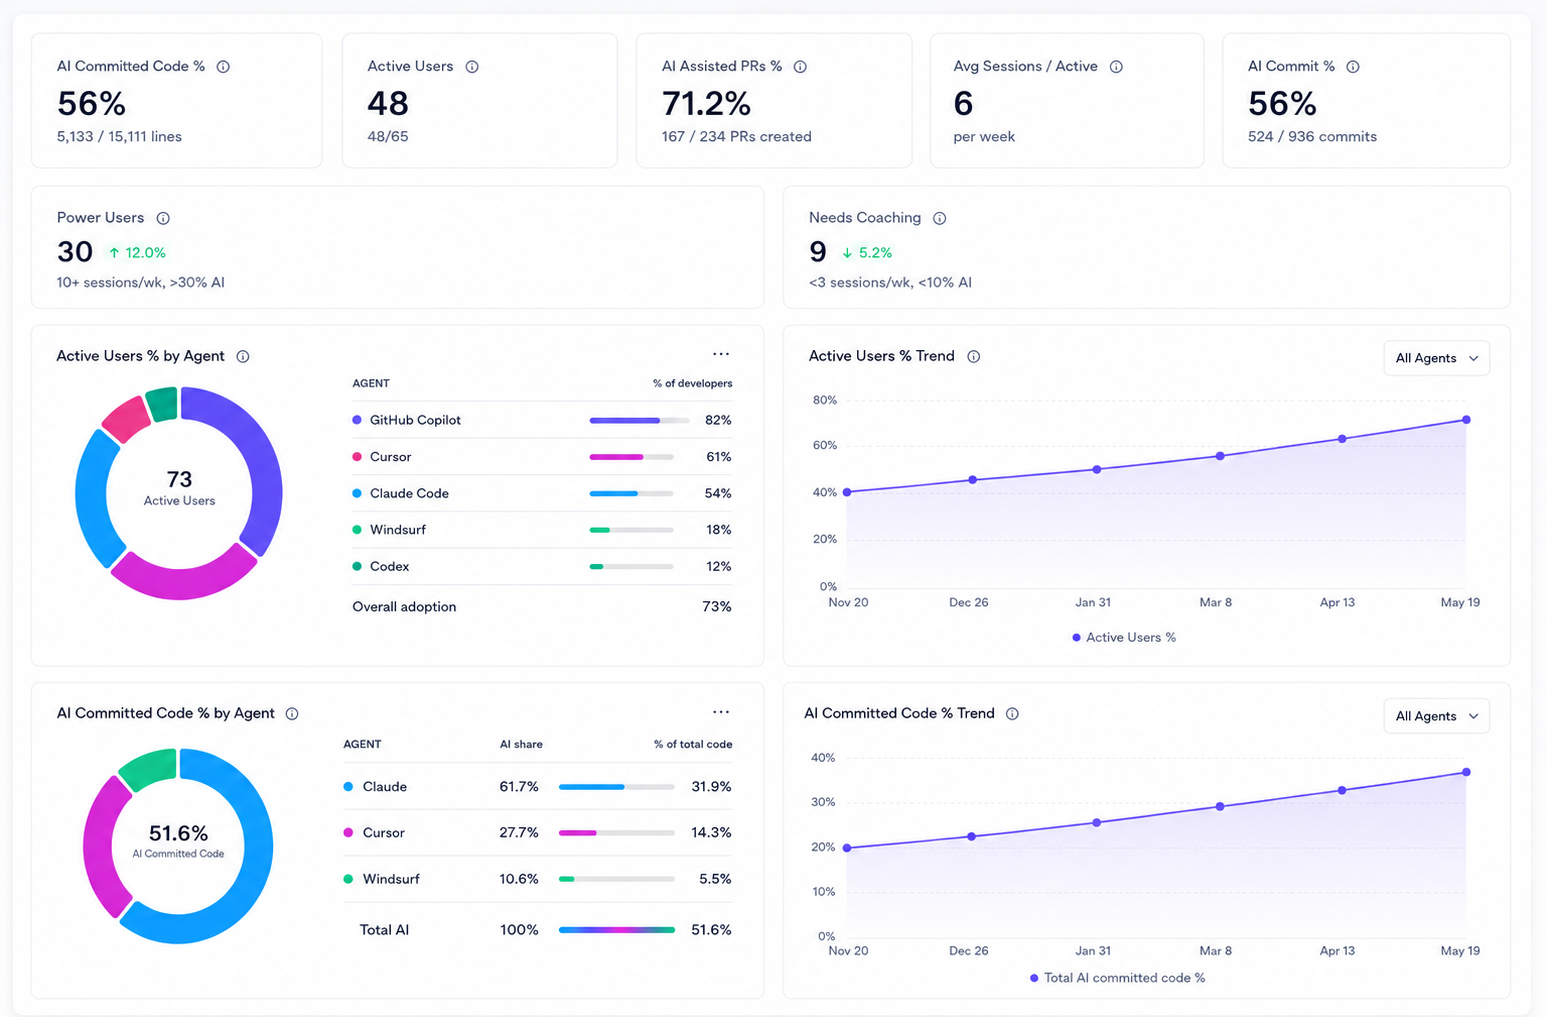
- Unified AI coding adoption visibility — One place to track adoption, sessions, and AI-generated code across every coding agent — Claude Code, Cursor, GitHub Copilot, Windsurf. Which tools your developers actually use, not just which seats you bought.
- Per-developer attribution — Token spend, sessions, and shipped code traced to the developer, agent, repository, team, and business unit behind them, turning bulk AI invoices into per-developer ROI you can act on.
- Wasted spend detection — Tokens burned on abandoned code, bloated prompts, expensive model choices, and missed cache hits surfaced automatically. The first time a team doubles its token bill without shipping more code, you know before the next renewal.
- Coding-to-production impact — Track AI-generated code from prompt to production using ship rate, PR cycle time, and DORA metrics, correlated with incident and vulnerability data. Know whether coding agents are actually making your team faster.
- Benchmarking and governance — Adoption, efficiency, and impact metrics compared across teams against an org baseline, with role-based access control and Harness-native engineering governance included.
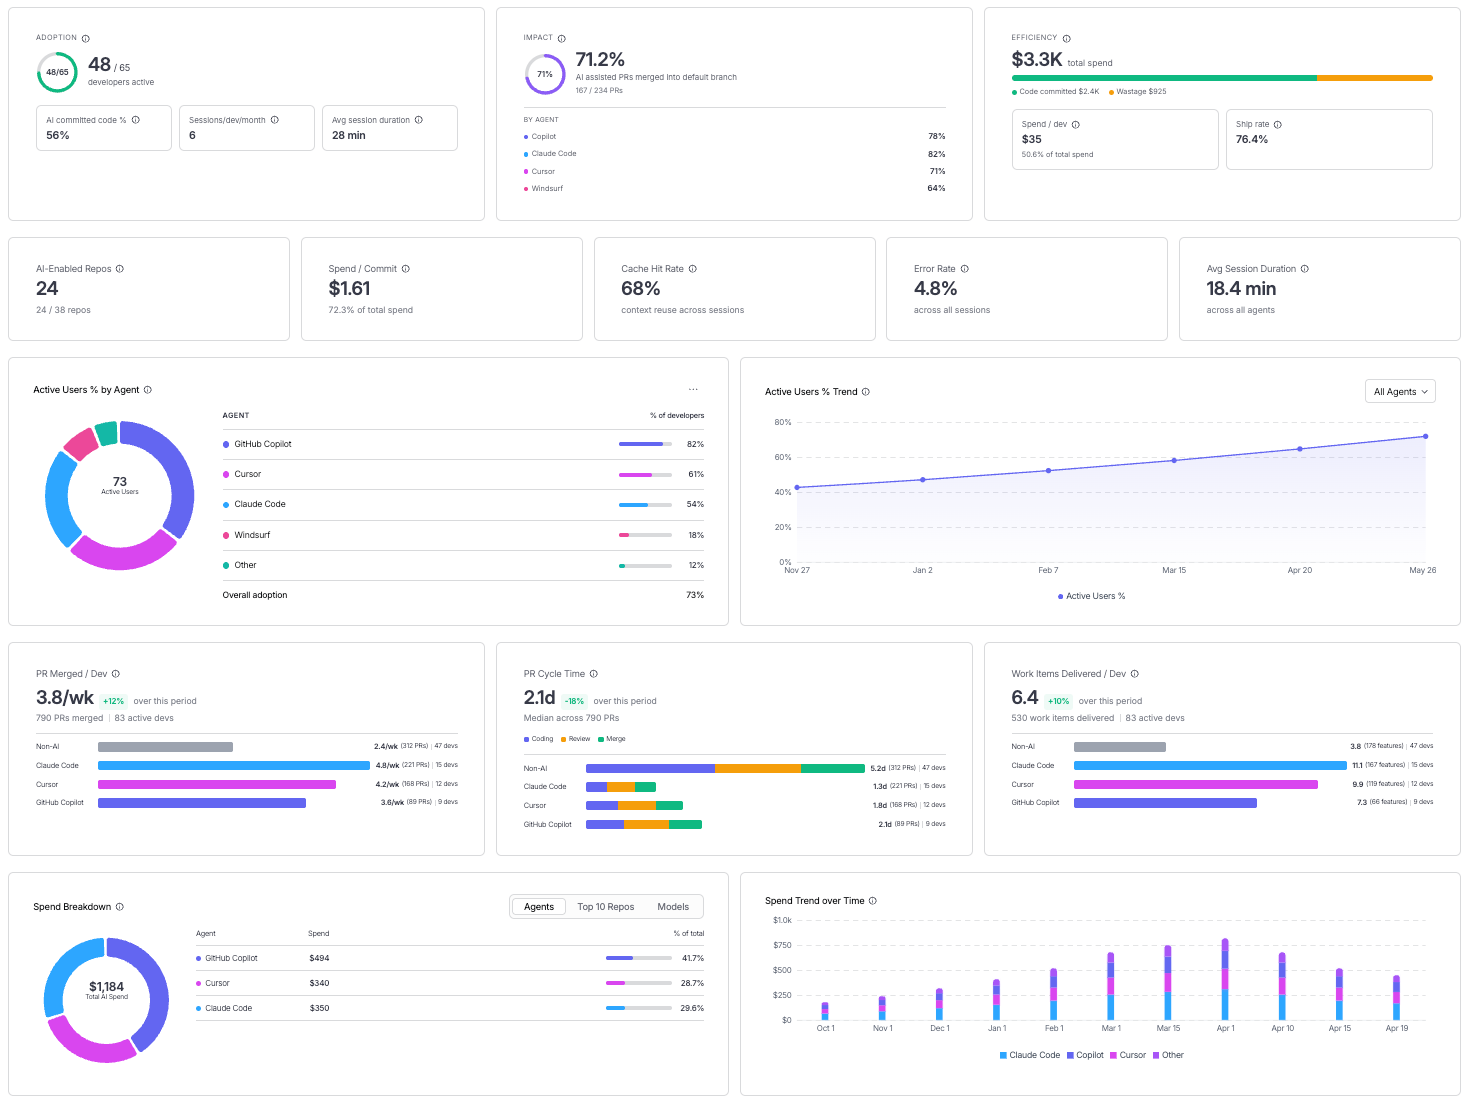
Fig. 1: AI DLC Insights gives engineering leaders a unified view of AI adoption, spend efficiency, and delivery impact across coding agents, teams, and workflows.
AI Infrastructure Costs: Cloud & AI Cost Management
Once an AI agent ships to production, a different cost equation takes over. Every customer interaction, every resolved ticket, every automated workflow triggers inference. The spend is continuous, scales with usage, and in most organizations is visible only at the invoice level. That tells you which line item is growing, but tells you nothing about whether the spend growth is worth it.
A $28,000 monthly spend on a customer support agent is a completely different number depending on how many tickets it resolved. If it cost $0.60 per resolved ticket and the human alternative costs more, it is one of the best investments in your stack. If the math runs the other way, you are paying more for automation than the process it replaced. Most organizations cannot tell the difference today.
Cloud & AI Cost Management closes that gap. Harness connects directly to your AI providers and production agents, capturing spend at the level of each individual request and tying it to the agent, session, or workflow that triggered it. The same cost categories, budgets, and anomaly detection already running on your cloud spend now apply to every AI token your infrastructure consumes.
A finance leader can finally answer the question the business is asking: is this agent worth what it costs? Here’s what’s in the release:
- Unified AI cost visibility — A single view of spend across every AI provider and managed service provider, from OpenAI and Anthropic to AWS Bedrock and GCP Vertex AI.
- Full spend attribution — Cost traced to the agent, model, team, and business unit driving it.
- Anomaly detection — Unusual AI spend spikes are proactively flagged for action.
- Budget and governance — Controls set at the agent, team, or business unit level, extending existing FinOps controls to AI spend.
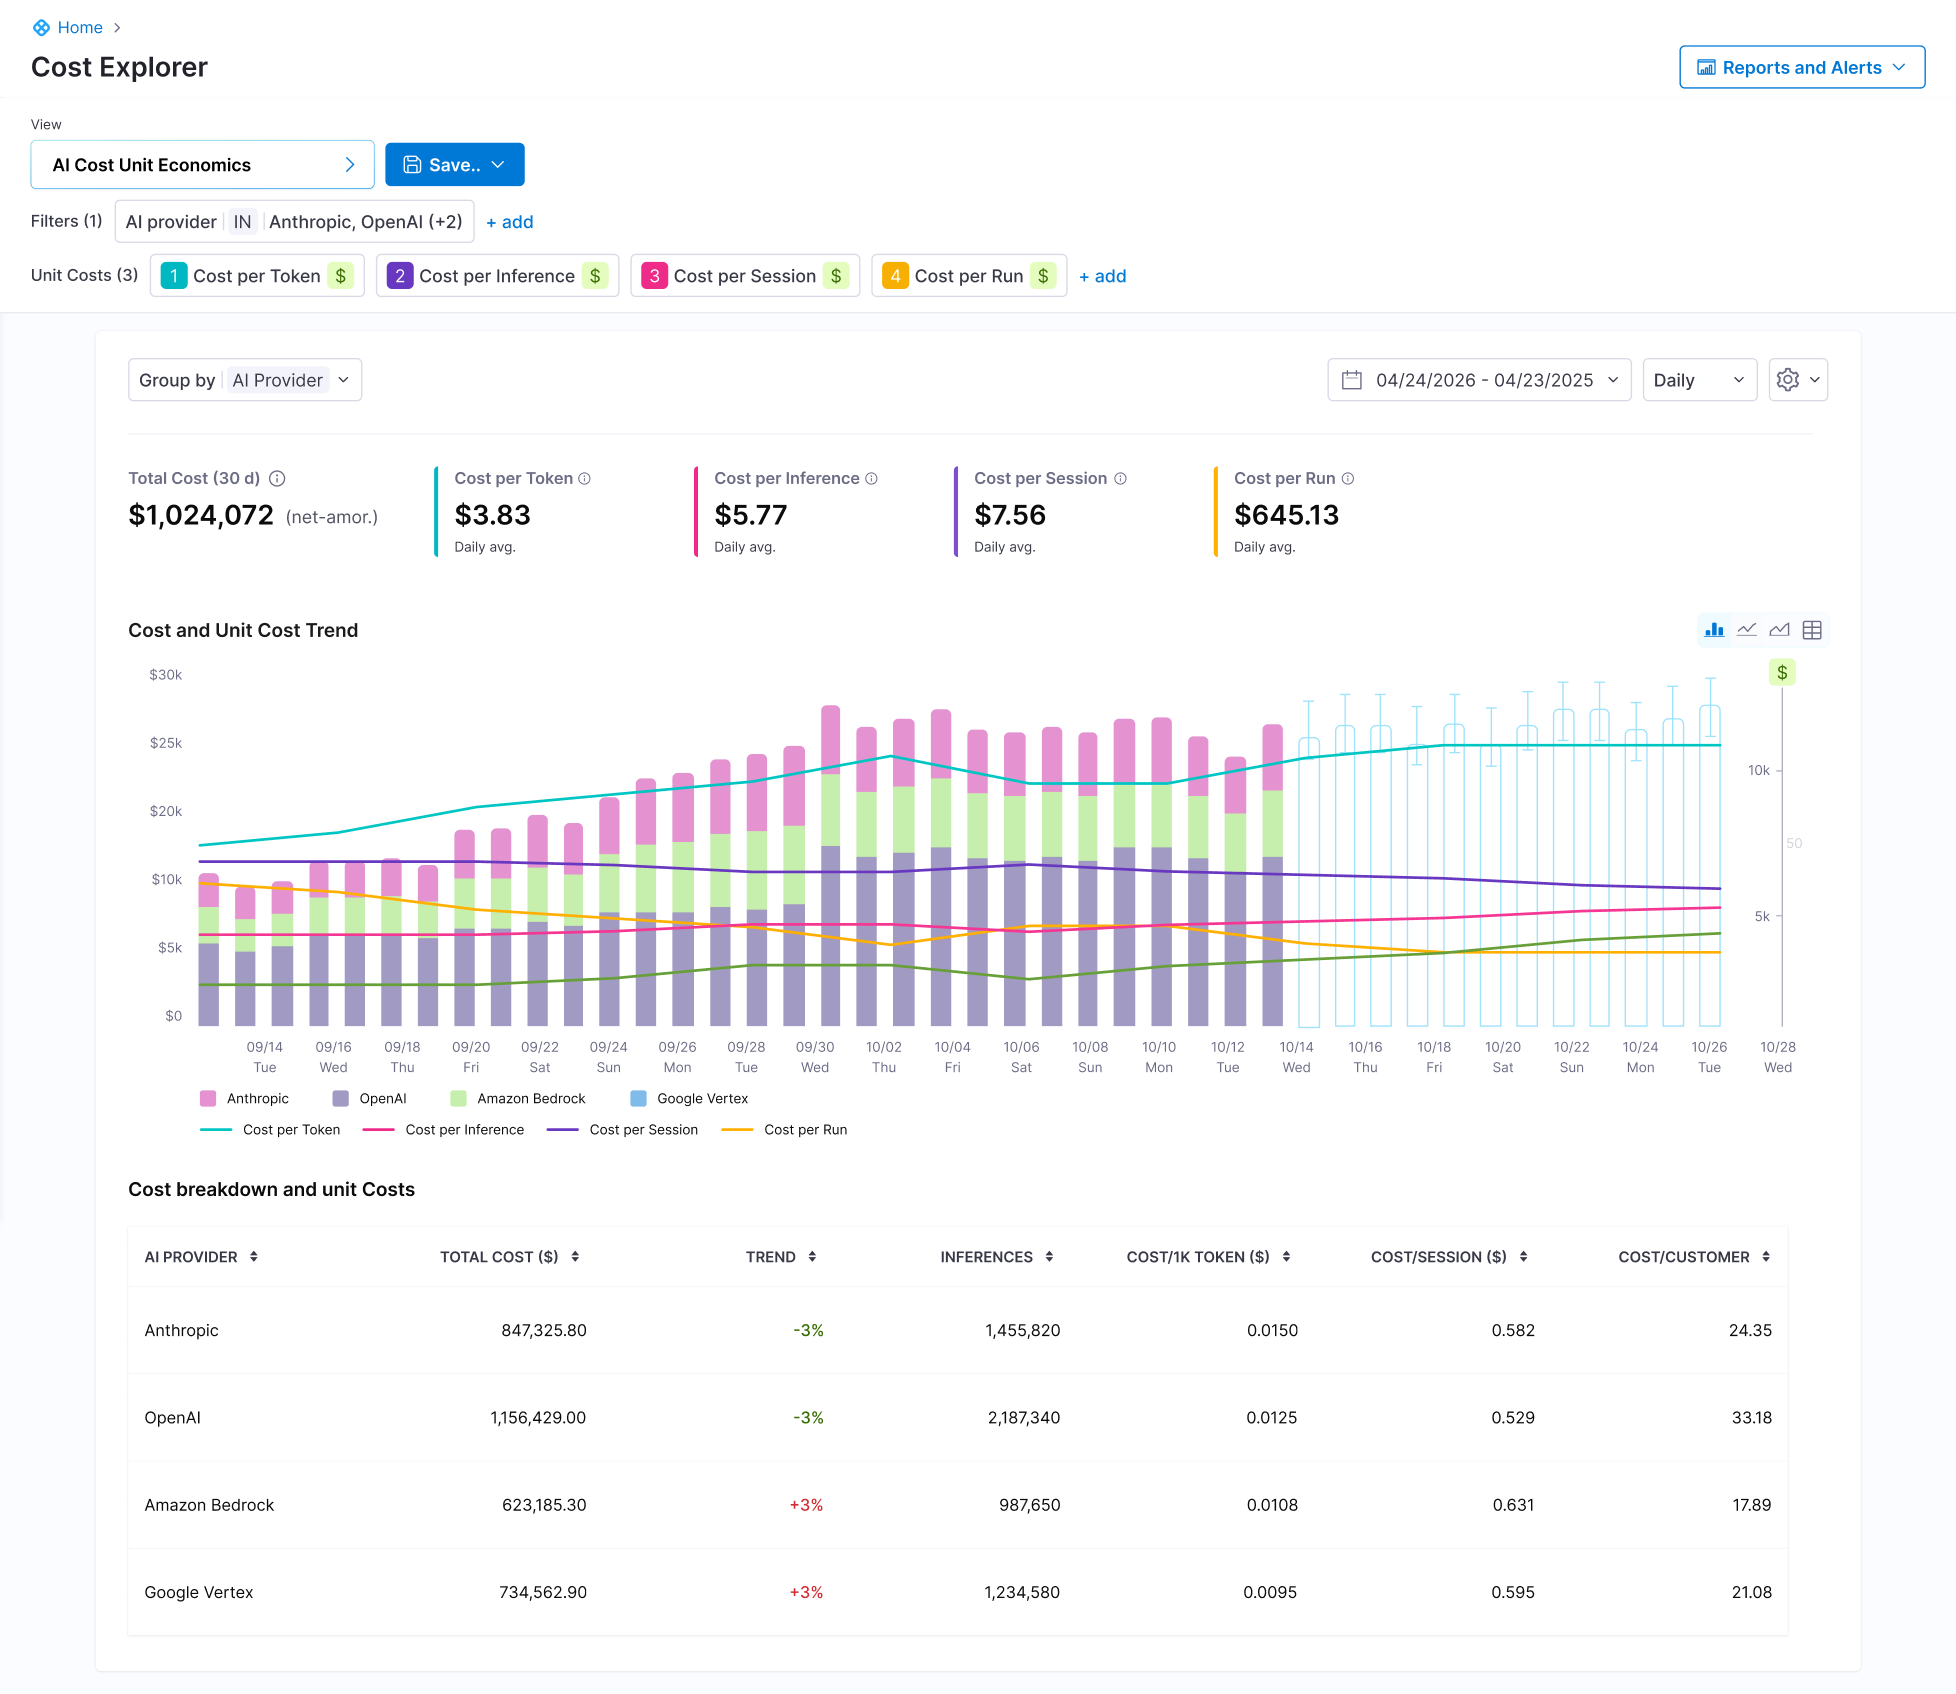
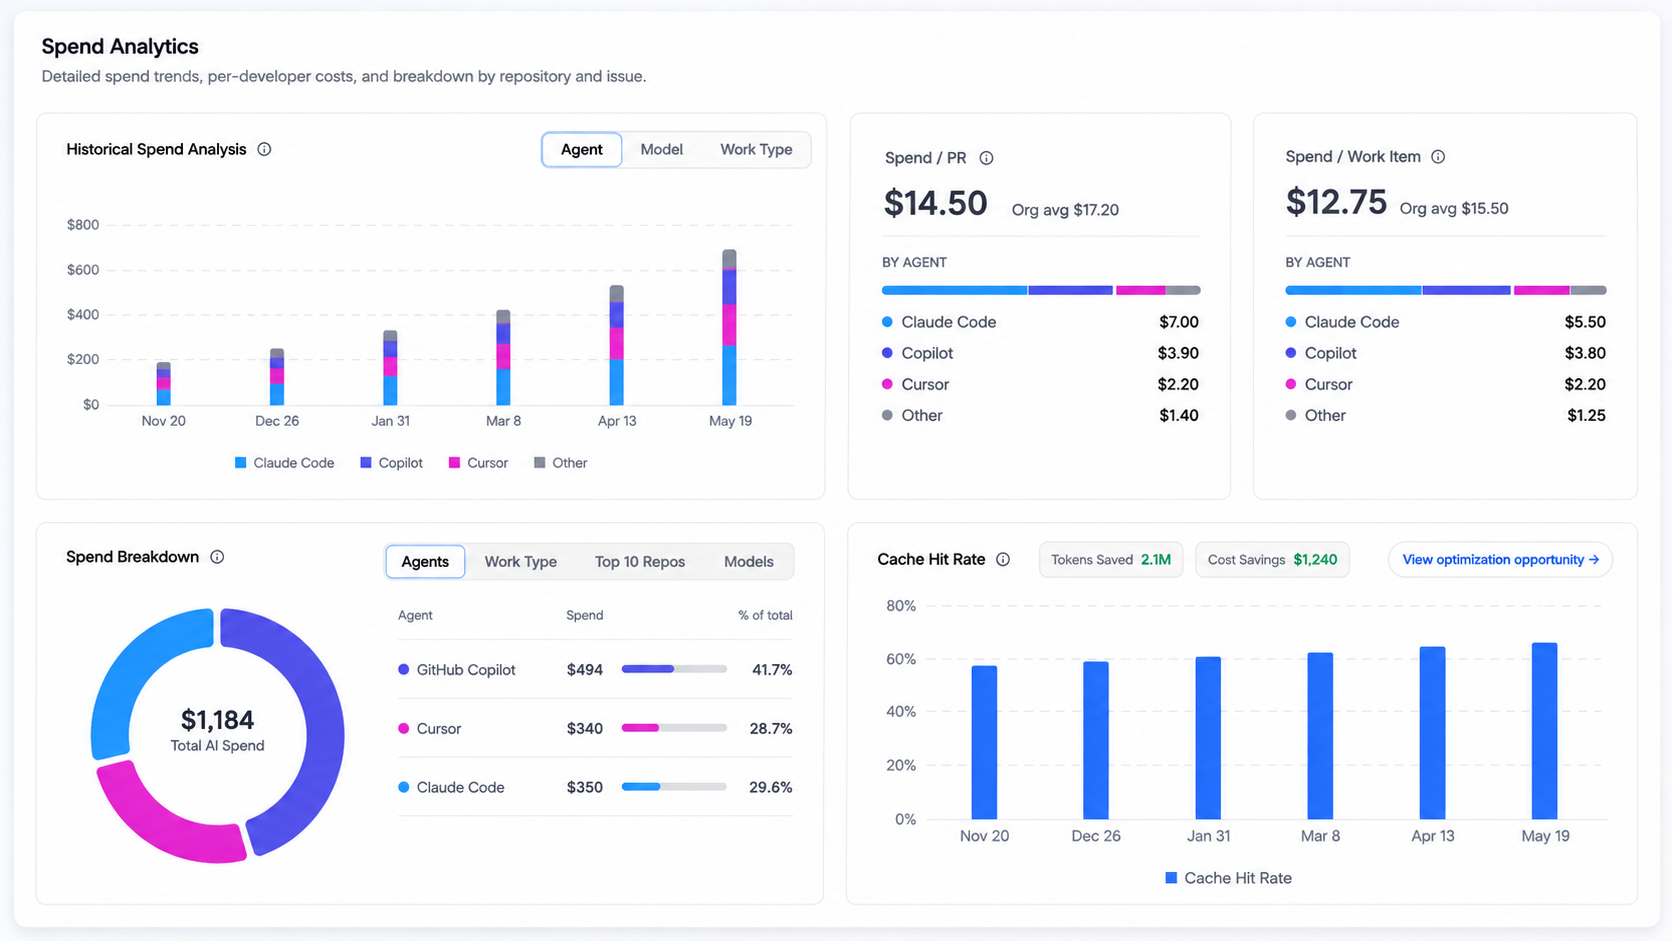
Fig. 2: AI Cost Unit Economics dashboard connects total AI spend to the metrics that matter, giving leaders a cross-provider breakdown of cost per token, per inference, and per session across providers.
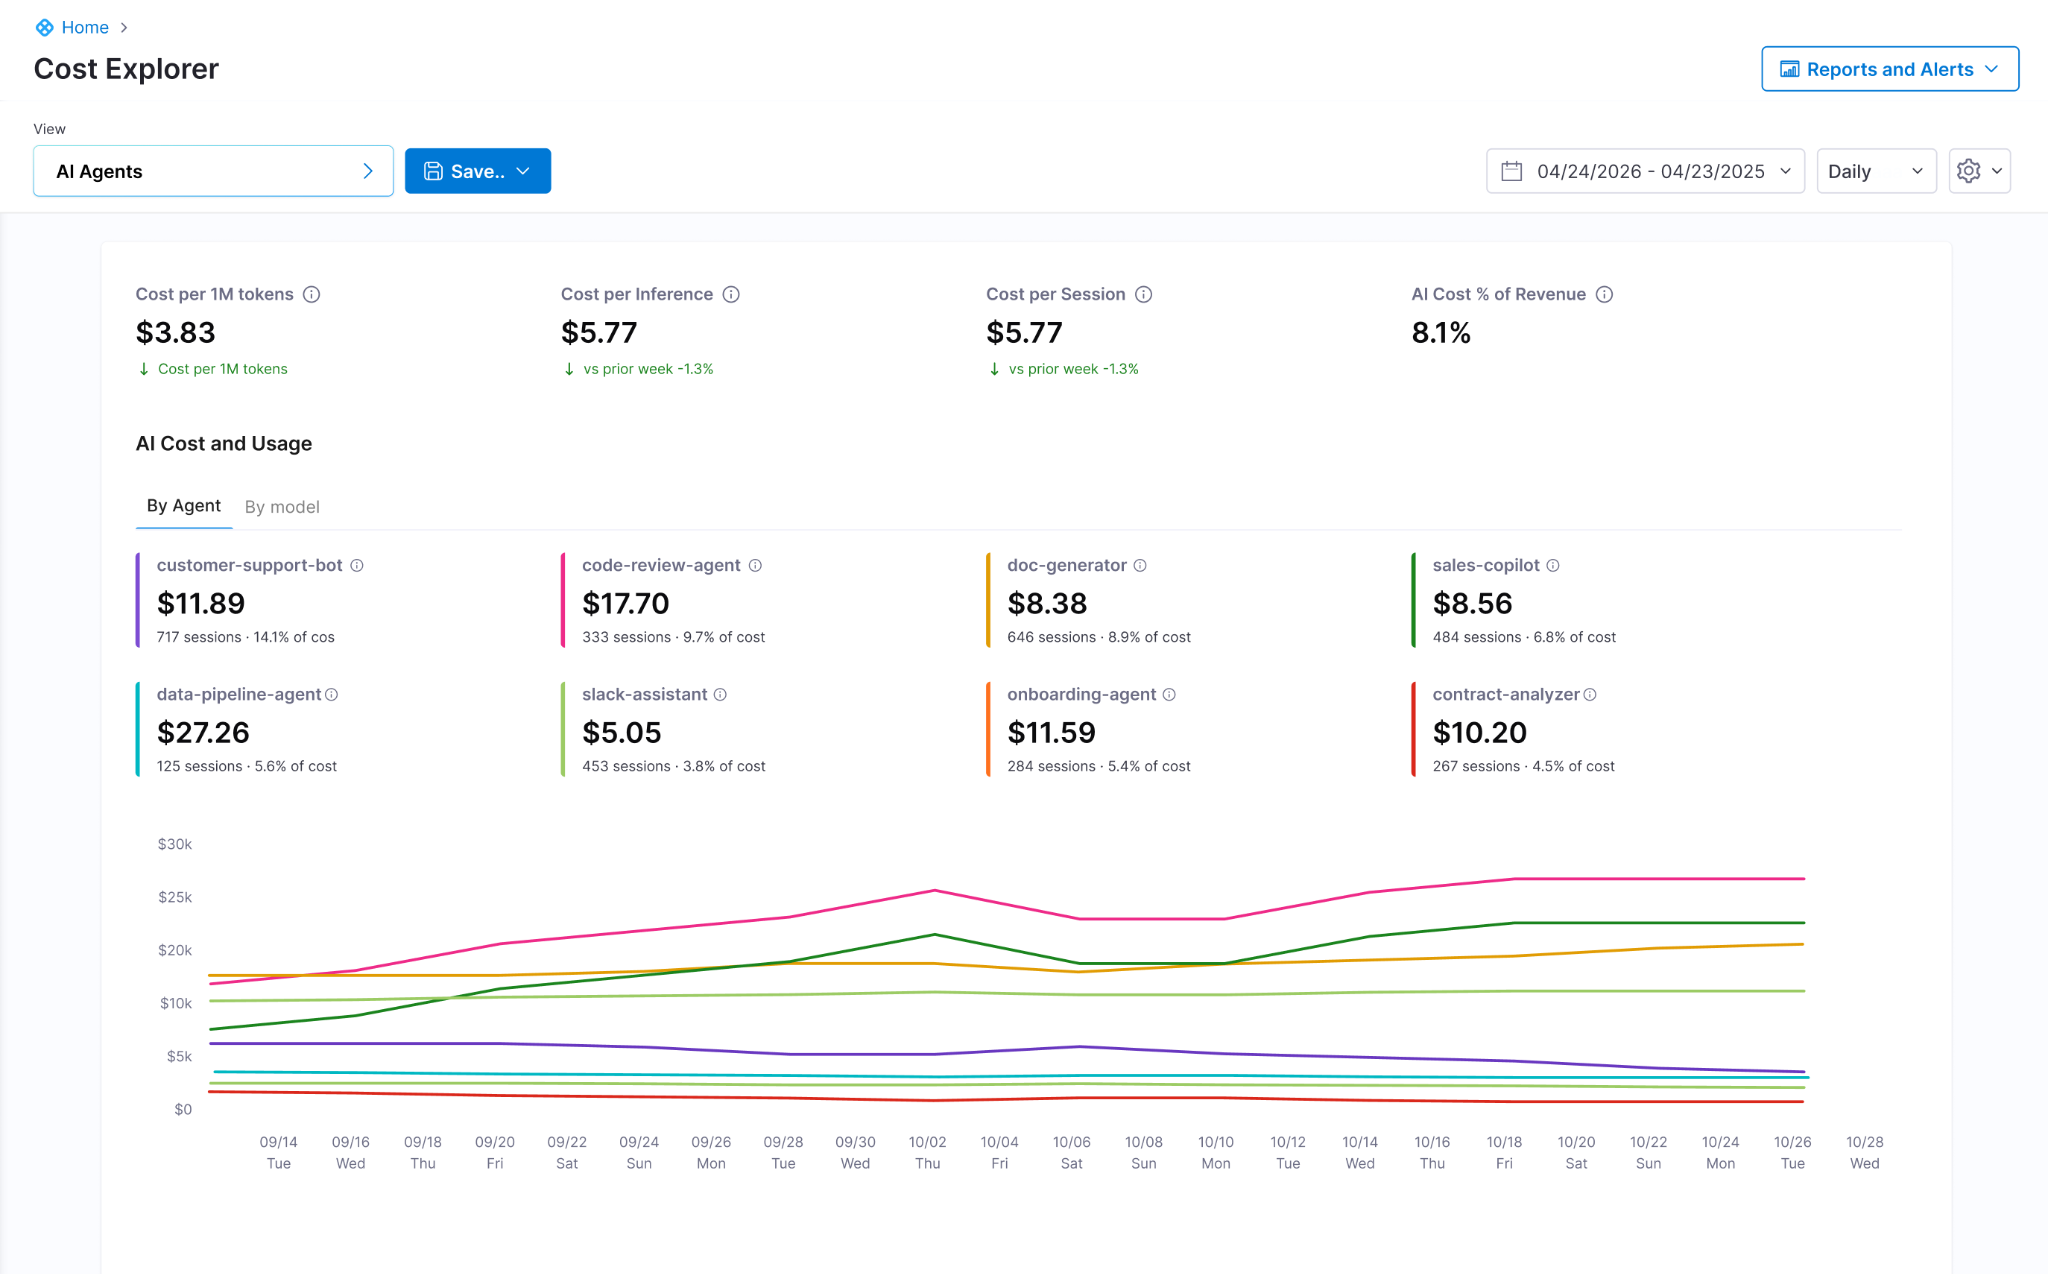
Fig. 3: AI spend, attributed by agent. At a glance: which agents are growing, which sessions are getting more expensive, and what AI cost looks like as a share of revenue.

Fig. 4: Run-level waterfall for a single agent run. The cost and latency of every step, every model call, and every tool invocation, with span attributes for debugging.
ROI of AI Spend, All in One Platform
AI DLC Insights answers the developer question: is token spend turning into shipped work? Cloud & AI Cost Management answers the infrastructure question: is each agent worth what it costs in production? Both questions now have a direct answer in the same platform.
The first phase of enterprise AI was adoption. The next is about proving the tools are worth their cost. The organizations that can show where the money goes and what it produces will spend the next dollar with confidence. The rest will keep approving line items they can't explain.
AI DLC Insights and Cloud & AI Cost Management are available in beta now. [Learn more]

Introducing AI DLC Insights to Prove the ROI of Your AI Engineering Investment
AI coding tools made code generation faster. Measuring what actually ships is the hard part.
Over the last eighteen months, tools like Cursor, Claude Code, Copilot, and Windsurf have fundamentally changed how software gets built. AI-generated pull requests are increasing, developers are producing more code than ever before, and workflows that once took hours now happen in minutes. But most organizations struggle to clearly explain what that investment is actually producing.
Only a fraction of AI-generated code ultimately survives review and reaches production, yet engineering leaders still lack visibility into which coding agents improve delivery performance and which workflows simply contribute to tokenmaxxing with no clear ROI.
That gap exists because traditional engineering systems were built for a world where development started with a commit. But AI fundamentally changed where the software development lifecycle begins. Development no longer starts with a commit. It starts with a prompt. The model choice, token consumption, generated code, review cycles, deployments, and production outcomes are now all part of the same engineering workflow. Measuring only what happens after code is committed is no longer enough.
That shift is what led Harness to evolve Software Engineering Insights into AI DLC Insights, to help organizations measure how AI-generated work moves through the entire development lifecycle from prompt to production.
Three questions every engineering organization is trying to answer
These three operational gaps exist inside almost every team running AI at scale today:
- Are we more productive? Seats don't equal usage, and usage doesn't equal productivity. But most teams still cannot draw a clear line between AI investment and engineering output.
- Are we spending efficiently? Leaders need to know how much spend produced shipped code versus how much was wasted on uncommitted sessions, wrong model choices, and missed cache opportunities.
- Are we shipping better products faster? Faster code generation does not automatically mean better products. Leaders must measure how AI impacts code quality, security vulnerabilities, and quality regressions.
These three gaps are exactly what AI DLC Insights is organized around. Together, they give engineering leaders a complete picture of what AI is producing inside their engineering organization, from the first prompt to the last deployment.
Adoption: See exactly how AI is being used
The first question starts with understanding what AI adoption actually looks like at the team and individual level. Seat counts and API usage aggregates give you a surface view. Understanding whether AI-generated code is actually making it into production requires something deeper.
Most engineering systems were never designed to observe AI-assisted development workflows directly. Source control can show what was committed. Billing systems can show token consumption. Neither can explain which generated code actually survived review, reached production, or improved delivery performance.
That is why AI DLC Insights introduces a new Agent that runs directly inside the developer environment. The agent observes AI interactions in real time, captures AI-generated code, tracks token consumption across coding agents and models, and connects that activity directly to commits, pull requests, deployments, and production outcomes.
What that makes visible:
- AI Code Percentage: See exactly how much shipped code was AI-generated, broken down by developer, team, or repository.
- AI-Assisted PRs & Commits: Track the percentage of merged PRs and commits containing AI-attributed code to measure real adoption growth.
- Active Users & Agent Breakdown: See which tools (Cursor, Claude, Windsurf, Copilot) engineers actually rely on to produce committed code.
- Power User Identification: Surface engineers with high AI commit velocity to understand winning patterns and scale them across the org.
Efficiency: Know where every AI dollar is going
Developer token consumption is increasing every month, but most teams still cannot explain which workflows are producing production-ready code and which are simply burning tokens.
That gap exists because token spend and engineering outcomes typically live in completely separate systems. Finance teams can see the monthly invoice, while engineering teams can see sprint activity and pull requests. Connecting token consumption directly to shipped code, deployment velocity, and engineering throughput is still difficult for most organizations.
As tokenmaxxing behaviors emerge, activity can easily be mistaken for impact. Some workflows generate meaningful production-ready code and improve delivery throughput, while others consume enormous amounts of tokens without improving what actually ships.
AI DLC Insights closes that gap, breaking down spend by developer, team, agent, and workflow:
- Wasted Spend: Spot tokens burned in sessions that produce no committed code (e.g., a developer generates output in Cursor but closes the session without saving) to eliminate unproductive workflows.
- Optimizable Spend: Catch inefficient patterns—like using an expensive frontier model for a simple task, suffering low cache hit rates, or having high turn counts on basic prompts—to restructure workflows and stretch your budget.
- Cost Per Work Item: Correlate session costs with issue trackers to calculate the exact AI spend required to close a backlog item, ship a feature, or resolve an incident.
Impact: Measure AI-generated code in production
Adoption and efficiency are inputs. Impact is the output. And the output is not lines of code generated or tokens consumed. Its features shipped, bugs resolved, lead time reduced, security posture improved, and customers getting better software faster.
More AI-generated code does not automatically produce those outcomes. Without the right visibility, AI adoption can quietly produce the opposite: more code volume with more review burden, more complexity with more regressions, faster generation with slower delivery cycles. The organizations that catch those patterns early are the ones that maintain quality as velocity increases.
AI DLC Insights connects AI activity to the delivery metrics that reveal what is happening downstream:
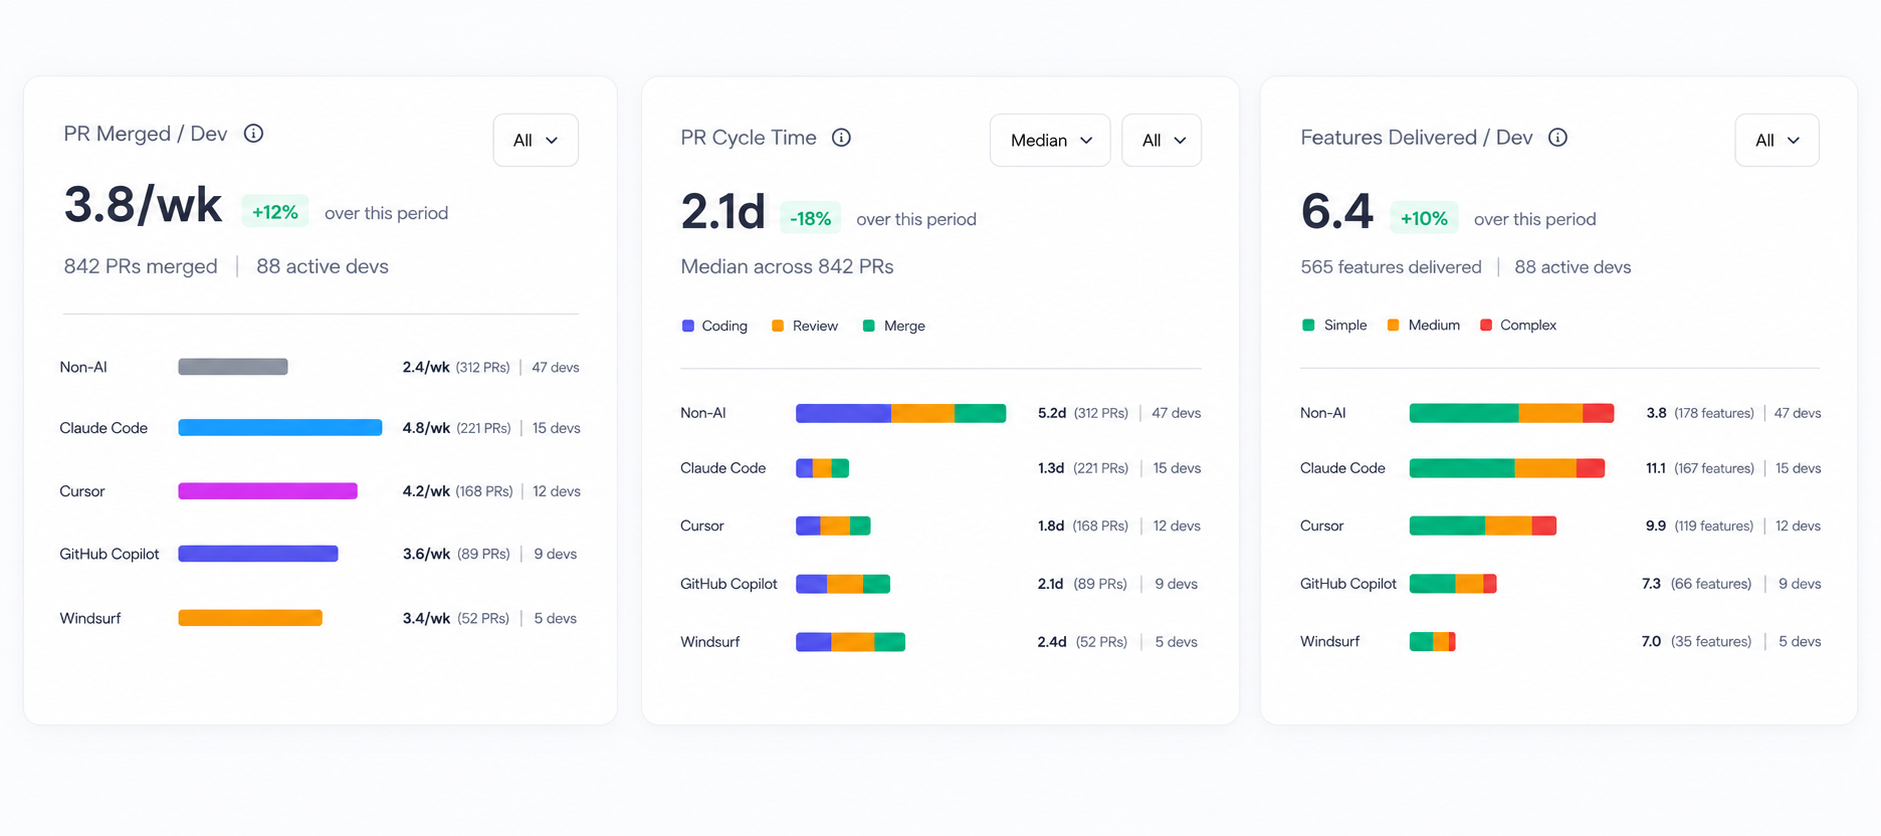
- Features Delivered & Backlog Reduction: Compare teams at different adoption levels to see if higher AI usage actually translates to more shipped features.
- PR Velocity & Lead Time: Track if PRs are merging faster. High open rates combined with low merge rates indicate AI is increasing the review burden, not reducing it.
- DORA Metrics: Out-of-the-box tracking for deployment frequency, change failure rate, lead time, and MTTR to ensure AI adoption correlates with delivery health.
- Business Alignment: Map engineering output directly to executive priorities to prove where your investment is going.
The next phase of engineering visibility
The first generation of engineering analytics platforms measured software delivery after the commit. The next generation will measure how humans and AI systems build software together.
Boards are no longer asking whether engineering teams are using AI coding tools. They’re asking whether the investment is improving software delivery in measurable ways. Whether teams are shipping more production-ready code. Whether delivery metrics are moving alongside token consumption. Whether the spend is generating real engineering leverage or just increasing the invoice.
Answering those questions requires visibility into how AI-generated code actually behaves across the full development lifecycle, from the prompt that created it to the deployment that shipped it.
That is what AI DLC Insights was built to deliver.
Ready to prove the ROI of your AI engineering investment? Request a demo to learn more.
Harness Named a Leader in the 2026 Gartner® Magic Quadrant™ for DevSecOps Platforms for the Third Consecutive Year
Harness has been recognized as a Leader in the 2026 Gartner® Magic Quadrant™ for DevSecOps Platforms for the third consecutive year. Harness was also positioned furthest on the Completeness of Vision axis in the report.
Our Key takeaways:
- Harness is named a Leader for the third consecutive year
- Harness is positioned furthest on the Completeness of Vision axis
- Harness continues investing in governed, AI-powered DevSecOps
Harness is the AI platform for engineering, security, and operations teams to build, secure, deploy, govern, and optimize software delivery across the SDLC.
We believe our recognition in the Gartner Magic Quadrant for DevSecOps Platforms reflects the continued evolution of the Harness platform and our commitment to helping teams deliver software faster, safer, and with greater governance across the software delivery lifecycle.
We’re thrilled to share this recognition, which we believe reflects the strength of our product strategy, the breadth of our platform, and our continued investment in helping enterprises modernize software delivery with security, reliability, cost management, and AI built into the development lifecycle.
Today, organizations across industries like United Airlines, Ancestry, and Citi rely on Harness to reduce delivery complexity, improve developer productivity, strengthen governance, and accelerate innovation across increasingly complex software environments.
Why This Matters Now
Software delivery has entered a new era. AI coding assistants are helping teams create software faster than ever, but faster code generation also means more changes, more tests, more vulnerabilities, more deployments, and more incidents for organizations to manage. The next era of DevSecOps will not be defined by who can generate code faster. It will be defined by who can safely convert that speed into reliable business outcomes.
Our view is that the future of DevSecOps is autonomous AI agents, governed and directed by expert engineers. As humans and AI agents both contribute to software change, enterprises will need one connected platform to understand, validate, secure, deploy, observe, optimize, roll back, and prove every change across the software delivery lifecycle.
Our Journey
As a pioneer in modern software delivery, Harness offers over 15 platform products and has built one of the industry’s most comprehensive platforms to support the full spectrum of application development, deployment, security, reliability, feature management, cost management, and operations.
Harness has evolved through a combination of product innovation, internal entrepreneurship, open source investment, and strategic acquisitions. We believe our recognition as furthest on the Completeness of Vision axis in the 2026 Gartner® Magic Quadrant™ for DevSecOps Platforms is proof that Harness is solving problems for our customers in a measurable way.
Over the past year, Harness has continued to expand platform capabilities and AI agents across:
- Security and risk management
- AI-native testing capabilities including flaky test detection and AI impact testing
- Feature Management and Experimentation
- Cloud and AI Cost Management
- AI DLC insights
- Resilience Testing, and more
This matters because software delivery is no longer just about building and deploying code. Teams must now manage security risk, release complexity, infrastructure cost, compliance requirements, production reliability, and the growing impact of AI-generated software. The Harness platform allows teams to adopt what they need, when they need it, in one place.
With operations across North America, Europe, APAC, Latin America, and India, Harness serves organizations of all sizes across industries. Customers choose Harness not only for the breadth of the platform but also for the flexibility to adopt individual modules or the full platform based on their needs, maturity, and business priorities.
What’s Next for Harness
This recognition in our opinion is a milestone, and we’re proud, but we’re even more excited by the road ahead.
We build security in the software delivery lifecycle natively, not as a separate stage or disconnected toolchain. As AI increases the volume of code, changes, and security findings, enterprises will need platforms that connect detection, prioritization, policy, remediation, deployment, and runtime defense into a single, governed workflow.
Harness is focused on helping enterprises meet that moment. We will continue investing in AI software delivery to help teams move faster without losing control. Our goal is to help every organization deliver software that is faster to build, safer to release, easier to govern, and more resilient in production.
Thank you to our customers, partners, employees, and community for your continued trust. We’re excited about the journey ahead and can’t wait to show you what’s next.
Learn More
Get a complimentary copy of the 2026 Gartner® Magic Quadrant™ for DevSecOps Platforms.
Or, to talk to someone about Harness, please contact us.
Gartner Disclaimer
Gartner, Magic Quadrant for DevSecOps Platforms, 2026, Keith Mann, Thomas Murphy, Bill Holz, 15 June 2026
Gartner does not endorse any vendor, product, or service depicted in its research publications and does not advise technology users to select only those vendors with the highest ratings or other designation. Gartner research publications consist of the opinions of Gartner’s research organization and should not be construed as statements of fact. Gartner disclaims all warranties, expressed or implied, with respect to this research, including any warranties of merchantability or fitness for a particular purpose.
GARTNER is a registered trademark and service mark of Gartner, and Magic Quadrant is a registered trademark of Gartner, Inc. and/or its affiliates in the U.S. and internationally, and is used herein with permission. All rights reserved.

The AI Productivity Paradox: We're Measuring the Gains and Missing the Costs
For the past year, I've been hearing a version of the same thing from engineering leaders: AI tools are working, productivity is up, the business case is there. And yet, something about the picture still feels incomplete. So we decided to go find out how widespread that feeling actually is. We surveyed 700 engineers and managers across five countries, and published the results in the State of Engineering Excellence 2026.
89% of engineering leaders say developer productivity has improved since deploying AI. It's a clean story. AI is working. Engineering teams are moving faster.
But, we also found that 81% of those same leaders say code review time has gone up since deploying AI. Significantly up, in a lot of cases. And, developers estimate that roughly a third of their day is now consumed by AI-related work that remains largely invisible to traditional productivity metrics.
So which is it? Is AI making engineering teams more productive, or simply shifting effort into places they don’t yet measure? After sitting with this data for a few weeks, the answer is both. That's the more honest read, even if it's less satisfying.
The gap between generating code and shipping value
AI has been very good at increasing output. Simultaneously, it has not automatically delivered more shipped value.
I talked to a customer recently, a large enterprise engineering org, and they were genuinely proud of how much their output metrics had improved. Lines of code written, PR velocity per developer, tickets closed, features delivered. All of it up. Then we dug into what was actually making it to production, and the numbers looked much less clean. A meaningful share of AI-generated code was not getting to production.
Most organizations can tell you how much AI code was accepted. Very few can tell you how much of it actually landed in production, and that's the number that matters. Hard dollars spent on agent compute that never shipped anything isn't a productivity story. That's a visibility gap, and it's one most organizations aren't measuring today.
What "invisible work" actually looks like
The 31% figure, the estimated share of developer time now consumed by AI-related work that appears in no metric, probably sounds abstract until you break down what it actually is.
It's a developer sitting with a pull request for 45 minutes because the AI-generated code is technically correct but written in a style nobody on the team recognizes, and they need to fully understand it before they can approve it. It's debugging a subtle edge case that the AI missed, which takes longer to track down than writing the function would have. It's working with 10 agents in parallel on 10 different tasks. None of this makes it into velocity or cycle time, and even code review metrics only catch a fraction of it.
What this data shows is that organizations are running a business where the costs are partially off the books. You can show your CFO a 20% productivity improvement and that's true. You just can't show them what it cost to get there.
High confidence in a broken system is its own problem
The finding that surprised me most: 89% of engineering leaders say their current metrics accurately reflect AI's impact. And 94% say key factors like tech debt, validation time, and developer burnout are missing from those same metrics.
When there's no established standard for measuring something, people default to trusting the frameworks they already know. Not because they've validated them for the new environment, but because they're familiar. High confidence in an incomplete system is a coping mechanism, not an accuracy signal.
The lesson: confidence in your measurement system should go up as you add instrumentation, not stay high when important dimensions of the work are still invisible. When 94% of leaders acknowledge gaps and only 6% think they're equipped to close them, that's not a minor calibration issue. That's a signal worth taking seriously.
The trust problem is structural, not individual
54% of practitioners fear individual performance evaluations based on AI productivity data. Managers, by contrast, show far greater comfort with these systems: they are nearly four times more likely than developers to report having no concerns at all.
Measurement systems almost always get built top-down, by the people who won't be measured by them. The practitioners who experience the day-to-day pressures of AI adoption, and who understand where invisible overhead actually lives, are rarely involved in defining the frameworks used to measure it. The result is a system that captures what leadership can see and misses what developers actually experience.
What developers said they need is straightforward: keep improvement data separate from performance evaluation, be transparent about what's being measured, and involve them in defining the metrics. None of that is technically hard. It requires organizational commitment. When measurement feels like surveillance, you don't get accurate data. You get people performing for the system instead of working in it.
What we're doing about it at Harness
The productivity gains from AI are real. The problem is that organizations are making multi-year investment decisions with dashboards built for a different era, and the gap between what those dashboards show and what's actually happening widens as AI adoption scales.
This is a problem we’ve been thinking deeply about at Harness. We’re working on new capabilities in Software Engineering Insights (SEI) that are designed to give engineering leaders visibility into the full picture: not just how much code is being generated, but how much of it is shipping, what the review and validation overhead actually looks like, and where AI spend is producing returns versus producing churn.
We believe the next generation of engineering measurement needs to be built for AI-native workflows, and we’ll be sharing more about that direction in the coming weeks.
Getting the measurement right isn't a reporting exercise. It's what makes the productivity gains from AI sustainable.
Download the full State of Engineering Excellence 2026 report [here].

The ROI of AI in Engineering: Prove Value Without Falling for Vanity Metrics
The AI ROI Problem: Speed Went Up, So Why Does Delivery Feel Worse?
Most orgs start their AI journey measuring the obvious: developer usage, prompts, code suggestions accepted, maybe PR cycle time.
That’s the adoption phase.
But the ROI story breaks when leaders realize two things at the same time:
- Developers are producing code faster than ever.
- Delivery pipelines, quality practices, and governance weren’t built for this volume.
Adeeb described it simply: the gains often show up as “local pockets of productivity,” while the delivery system becomes the constraint. Pushkar echoed the core risk: if you supercharge code production without fixing process and measurement first, it’s a wild journey.
The resulting tension is what many teams are now experiencing:
- Bigger PRs that are harder to review
- More pressure on test suites and CI time
- Increased deployment risk from changes that “look right” but behave poorly in production
- Rising cloud costs from inefficient code and wasteful compute
If you don’t measure the system, you’ll measure activity—and activity is not ROI.
Define ROI Like a Platform Team: Outcomes, Not Individual Output
ROI isn’t “developers wrote more code.”
ROI is “the organization delivered more customer value with less risk and waste.”
In the webinar, the discussion kept returning to four outcomes that matter to engineering leaders:
1) Velocity (delivery speed)
Not “how fast code was written,” but how quickly value reaches production.
2) Quality (delivery safety)
Not “how many tests ran,” but whether changes ship without turning into incidents, rollbacks, or weeks of cleanup.
3) Cost (efficiency)
Not “how much AI tooling costs,” but whether AI reduces total delivery cost—or increases cloud spend and rework.
4) Resilience (system + team health)
Not just uptime, but recovery capability, operational load, and whether teams can sustain delivery without burnout.
Pushkar put a sharp point on this: your system needs to keep change failure rate low and recovery time fast—especially when a meaningful portion of code is AI-assisted and the root-cause path isn’t always obvious.
Adeeb summarized the target state bluntly: it’s not enough to be faster. You need to be faster, safer, and cheaper.
The 3-Layer AI ROI Measurement Model
To get past hype, you need a measurement model that follows the maturity curve most organizations are actually on:
- adoption, 2) impact measurement, 3) ROI measurement.
Here’s the model to run.
Layer 1 — Utilization (adoption that lasts past the novelty)
Utilization answers: Are people really using it in daily workflow, consistently?
Track signals like:
- Weekly/monthly active users (by team, role, tenure)
- AI-assisted work volume (PRs, tasks, tickets influenced)
- “Stickiness” after the first 30–60 days (when novelty fades)
But don’t stop at raw vendor analytics. Pushkar’s practical advice is to translate raw signals into a single concept: engagement—a normalized view you can compare across teams and tools.
Why this matters: many organizations are experimenting with multiple AI vendors. Raw metrics don’t roll up cleanly; engagement does.
Layer 2 — Impact (flow + reliability, not activity)
Impact answers: Did delivery actually improve?
This is where most teams make the credibility-killing mistake: they see a metric move and declare victory.
Pushkar called out the trap: correlation is not causation. Org reality is messy—teams change, priorities shift, developers move, service ownership evolves.
So treat impact as a trend + overlay problem:
- Overlay adoption/engagement with a handful of system metrics
- Look for directional movement over time, not “before/after” hero stories
Impact metrics that survive executive scrutiny:
- Lead time / PR cycle time (flow)
- Deployment frequency (output that matters)
- Change failure rate (quality)
- Mean time to recover (resilience)
- Rework rate (waste)
Layer 3 — Cost (turn spend into context with a cost bridge)
Cost answers: Did the savings outweigh the spend—and where did value actually show up?
AI ROI collapses when the only cost you can quantify is the AI invoice.
Instead, build a cost bridge that maps:
- AI spend (licenses, tokens, credits)
to - Capacity unlocked (cycle time reduction, fewer incidents, reduced toil)
and ultimately to - Business outcomes (value delivered sooner, fewer production disruptions, more predictable execution)
Adeeb’s framing is the right mental model: turn cost into context. Don’t ask “how much did we spend?” Ask “what did we buy back?”
A simple bridge you can operationalize:
- Spend: $/developer/month + infra spend deltas
- Value signals: lead time reduction, MTTR improvement, CFR reduction, test time reduction
- Capacity: engineering hours recovered from toil + rework
- Business: faster feature release, fewer escalations, improved reliability KPIs
Kill the Vanity Metrics Before They Kill Your Credibility
Lines of code is not progress
Pushkar said what many leaders are realizing too late: lines of code were already a questionable metric before AI. With AI, it becomes actively misleading.
Adeeb’s line is the one leaders should repeat internally:
“AI should make the system faster, not just individuals busier.”
If your AI story is “more code,” you’ve already lost the ROI argument.
Correlation vs causation: avoid false “AI wins”
If you rolled out an AI assistant and PR velocity improved, that’s a hypothesis—not proof.
The safe posture:
- Use AI engagement as the overlay
- Measure the system outcomes over multiple cycles
- Attribute wins to system changes, not tooling alone
The quality trap: why it’s hardest to measure
In the live discussion, quality was repeatedly called the hardest dimension to measure—and for good reason.
Quality often fails on delay:
- “Spaghetti code isn’t written in a day.”
- Architectural decay and long-term maintainability don’t show up immediately.
- Escape defects, operational overhead, and cumulative risk lag behind the initial productivity spike.
That means your quality model can’t rely only on immediate bug counts.
Use a layered quality model:
- Near-term: change failure rate, hotfix/rollback frequency, PR review churn, build break rate
- Mid-term: rework vs refactor trends, recurring incident patterns, test coverage drift
- Long-term: dependency risk, platform standards drift, service maturity scorecards
If you want a starting point for building this discipline, align with an engineering metrics program that combines delivery performance and productivity signals (for example, DORA plus broader productivity and workflow metrics). A practical reference is Harness’s guide on building an engineering metrics program.
Operationalize ROI With Guardrails, Not Gates
AI ROI doesn’t fail because AI is “bad.” It fails because organizations try to scale output without scaling governance, pipelines, and quality controls.
The webinar highlighted a consistent theme: AI needs rules and structure like any other engineering system.
Standard pipelines and policy-as-code
If AI increases throughput, standardization becomes a multiplier:
- reusable pipeline templates
- automated checks
- policy-as-code controls for what “good” means
This is where modern CI/CD governance practices stop being “process overhead” and become ROI protection.
If your delivery system is still partially manual, AI will amplify the bottleneck. A useful tactical deep dive is getting continuous deployment right—because AI ROI depends on what happens after code is written.
Scaling review and test strategy for AI-sized PRs
If your system expects a human to deeply review every line, AI will break that assumption.
Pushkar gave a concrete example: a 10,000-line PR that is heavily AI-assisted isn’t realistically reviewable in the old way.
So the solution shifts:
- smaller changes, enforced structurally
- stronger automated test contracts
- review automation that focuses humans on high-risk diffs
- measurable PR “health,” not PR “size”
A useful mental model is a return to contract-driven development: more teams are front-loading expectations (tests, constraints, acceptance criteria) so AI-generated code must “prove itself” before merge.
Governance checklist for AI-assisted delivery
Use this as your minimum viable governance:
- Definition of Done includes tests + security checks appropriate to change risk
- Golden paths for services, pipelines, and environments
- Policy-as-code guardrails (approvals, deployment rules, required checks)
- Artifact and dependency hygiene (SBOMs, provenance, promotion policies)
- Release controls (feature flags for risk isolation, progressive delivery patterns)
- Visibility across the SDLC so you can measure where time and risk actually live
A 90-Day Rollout Plan: Adoption → Impact → ROI
Weeks 0–2: baseline and instrumentation
- Pick 5–7 system metrics you will not change for a quarter
- Baseline across teams (don’t average away reality)
- Define AI engagement normalization (especially if multi-vendor)
Weeks 3–6: normalize metrics and sentiment
Pushkar called out what many organizations miss: qualitative data. Ask builders what’s working and what’s breaking.
- Add lightweight developer sentiment (friction, confidence, cognitive load)
- Track role-based differences (new engineers vs senior, backend vs mobile, etc.)
- Identify where the outer loop is becoming the constraint
Weeks 7–12: cost bridge + executive reporting
- Build the cost bridge from spend → cycle time/quality outcomes → capacity unlocked
- Produce a quarterly ROI narrative:
- what improved
- what regressed
- what guardrails were added
- what the next quarter’s bets are
Your goal isn’t to “prove AI works in theory.” Your goal is to show measurable system outcomes quarter over quarter.
How Harness Fits: Operationalize Engineering Intelligence Across the SDLC
AI ROI becomes measurable when you can connect signals across the SDLC—code, pipelines, quality, delivery, and operational outcomes—without turning it into a manual reporting project.
That’s the gap platforms are now filling: turning “SDLC exhaust” into engineering intelligence and decision-making leverage.
If you’re specifically focused on measuring AI coding assistants beyond raw usage, Harness’s perspective on AI productivity insights aligns with what engineering leaders need next: adoption visibility that ladders into impact, cost, and governance—so ROI is a system story, not a tool story.
For broader benchmarking and maturity context, the State of Software Delivery is a useful way to calibrate what “good” looks like across speed, stability, and efficiency.
FAQ
How do you measure ROI of AI in engineering?
Measure ROI across three layers: utilization (adoption/engagement), impact (lead time, CFR, MTTR, flow), and cost (spend mapped to capacity unlocked and incidents avoided). ROI must reflect system outcomes, not individual output.
What are the best metrics for AI coding assistant impact?
Use delivery and reliability metrics that reflect end-to-end outcomes: PR cycle time/lead time, deployment frequency, change failure rate, mean time to recover, and rework rate. Pair these with AI engagement trends over time.
Why is “lines of code written by AI” a bad metric?
Because it measures volume, not value. More code can increase review burden, test load, operational risk, and long-term maintenance cost. It’s an activity metric, not an outcome metric.
What is the AI velocity paradox?
It’s when AI accelerates coding (inner loop) but slows delivery (outer loop) because testing, review, pipelines, and governance can’t keep pace. The organization feels “faster” and “worse” at the same time.
How do you measure code quality with AI-generated code?
Use layered indicators: near-term (CFR, rollback/hotfix rate, review churn), mid-term (rework/refactor trends), and long-term (service maturity scorecards, recurring incident patterns). Quality often lags, so don’t rely only on immediate defect counts.
How do you connect AI spend to business outcomes?
Build a cost bridge: AI spend → delivery improvements (cycle time, incidents, reliability) → capacity unlocked → business outcomes (faster value delivery, reduced downtime impact, improved predictability).
What guardrails are most important for sustainable AI ROI?
Standard pipelines, policy-as-code, automated checks, artifact/dependency controls (SBOM/provenance), and release controls like feature flags and progressive delivery. Guardrails protect ROI by reducing downstream risk and rework.
Conclusion
AI in engineering is no longer optional—but measuring it intelligently is. If you want ROI that survives budget season, stop trying to prove that AI helps developers type faster. Prove that AI helps your delivery system ship faster, safer, and cheaper—without burning out teams or inflating cloud costs.
Ready to see how Harness helps platform teams turn SDLC data into measurable engineering intelligence—and operationalize AI ROI with governance built in? Explore Harness Software Engineering Insights.

Measuring Developer Productivity: Prove Impact
Your developer productivity initiative didn't collapse because the data was wrong. It stalled because it couldn't answer the business question.
Leadership asked, "So what?"
You presented improved cycle time, higher deployment frequency, lower change failure rate. The dashboards were polished and the trends were moving in the right direction. And still, the room was unconvinced, because the real question was never about operational motion. It was whether engineering was driving measurable business impact.
The best engineering organizations stopped treating productivity as an internal reporting exercise a long time ago. They don't measure to validate effort. They measure to demonstrate outcomes, treating productivity as a strategic capability rather than a compliance artifact. That framing shift is the difference between a dashboard that gets ignored and a measurement system that actually influences investment decisions.
Developer Productivity Metrics That Actually Mean Something
Most engineering productivity programs fail at the measurement selection stage. Teams track what is easy to instrument instead of what influences strategic outcomes: lines of code shipped, tickets closed, pull requests merged. These are activity signals. They describe motion, not value creation.
Even widely respected metrics become vanity indicators when stripped of context. Deployment frequency sounds impressive until you ask what those deployments actually delivered. Lead time looks strong until you realize the shipped features didn't move adoption or revenue. Change failure rate improves, but customer experience stays flat. The numbers go up and the business question remains unanswered.
What's needed is a translation layer between technical execution and business impact. This doesn't mean abandoning quantitative rigor. It means recognizing that metrics only matter when they're connected to outcomes. Deployment frequency is not the goal; sustainable value delivery is. Lead time is not the strategy; responsiveness to market demand is. The difference is subtle, but it's decisive.
High-performing teams measure how engineering execution influences customer value, product velocity, operational risk, and strategic alignment. They treat metrics as decision inputs, not performance theater.
Why Engineering Intelligence Fails Without Workflow Context
Data without workflow context creates false conclusions. A pull request sitting in review for three days may look like inefficiency, but the cause matters enormously. Is it architectural complexity? Reviewer overload? Cross-timezone coordination? A critical design discussion that needed to happen? Without workflow visibility, metrics flatten nuance into noise and teams start optimizing the wrong bottlenecks.
Consider two teams. One deploys ten times per week with frequent rollbacks. Another deploys five times per week with zero incidents. Raw deployment frequency rewards the first team. Risk-adjusted delivery performance favors the second. Without context, your metrics are quietly incentivizing the wrong behavior, rewarding operational debt over operational discipline.
Developer productivity measurement at scale means connecting commits to pipelines, pipelines to releases, releases to incidents, and incidents back to customer impact. Only then can you distinguish between healthy experimentation and accumulating debt, between intentional technical debt reduction and systemic inefficiency. If review time improves but deployment frequency stays flat, you didn't accelerate delivery. You shifted the bottleneck. True engineering intelligence exposes those dynamics instead of hiding them behind aggregate scores.
Measuring Developer Productivity Across Team Boundaries
Most organizations measure productivity within team silos and then wonder why platform investments underperform. A backend team increasing throughput doesn't create value if frontend teams can't integrate efficiently. An infrastructure team reducing pipeline time doesn't accelerate delivery if governance constraints slow application releases downstream. A platform investment only matters if it compounds velocity across the teams that depend on it.
Engineering productivity is systemic. High-functioning organizations measure it that way, instrumenting handoffs between systems rather than just activity within them. They track how long work waits between functions, analyze how architectural decisions in one domain impact velocity in another, and measure whether platform capabilities are translating into application-level acceleration.
This is where productivity measurement shifts from operational reporting to strategic intelligence. The question stops being whether individual teams are busy and starts being whether the organization is aligned. Whether platform investments are landing. Whether architectural decisions are compounding velocity or quietly constraining it. Those answers don't come from point-in-time dashboards. They emerge from trend analysis across repositories, pipelines, and organizational boundaries.
When DORA Metrics and SPACE Framework Converge
DORA metrics provide a delivery health baseline: deployment frequency, lead time for changes, change failure rate, and time to restore service. Think of them as the vital signs of your software delivery operation, answering whether the delivery engine is healthy enough to support strategic execution.
But delivery health alone doesn't guarantee sustainable performance. The SPACE framework extends that baseline by capturing satisfaction, performance, activity, communication, and efficiency. It acknowledges what throughput metrics often miss: that sustainable velocity requires healthy teams, manageable cognitive load, and real alignment between effort and impact.
The warning signs are predictable once you know how to read them. High DORA scores alongside declining satisfaction is a burnout signal. Strong activity metrics with weak communication indicators point to silo formation. Efficient deployment paired with persistent incident volume suggests fragility hiding beneath a healthy-looking surface.
The most effective engineering organizations don't choose between DORA and SPACE. They integrate them. DORA confirms the delivery engine is functioning. SPACE confirms that function is sustainable and human. Together, they create a multi-dimensional view of engineering effectiveness that balances speed, quality, resilience, and team health, transforming productivity measurement from throughput tracking into something closer to strategic foresight.
Harness SEI: Engineering Intelligence with Context
Most engineering intelligence platforms prioritize visibility without context. They surface metrics but fail to connect them to workflow realities or business outcomes, and that's exactly where they fall short.
Harness SEI treats measuring developer productivity as a strategic capability. By integrating with source control systems, CI/CD pipelines, and issue tracking platforms, it creates a unified view of delivery performance across the engineering ecosystem, connecting commits to execution, execution to release, and release to reliability.
The more important distinction is what the platform doesn't do. It doesn't reduce productivity to individual surveillance or flatten team performance into leaderboard comparisons. A team showing slower cycle times because they're paying down technical debt is not underperforming. A platform team with lower deployment frequency because they're building foundational infrastructure is not failing. In isolation, those signals look negative. In context, they're strategic. Harness SEI is built to surface that context, giving engineering leaders visibility into whether platform improvements are compounding velocity, whether architectural investments are reducing friction, and whether delivery health is genuinely supporting strategic goals.
Proving Impact Instead of Measuring Motion
The best engineering organizations don't measure productivity to justify headcount. They measure it to demonstrate value creation, and that shift changes the entire conversation.
When your developer productivity measurement framework connects technical activity to strategic results, you stop defending engineering costs and start demonstrating engineering value. You show that faster deployments enabled a faster market response. That reduced change failure rates lowered operational costs. That improved cycle times allowed the team to deliver more customer value with the same resources.
The common thread across DORA, SPACE, and platforms like Harness SEI is the same principle: context matters more than raw numbers. Optimizing for faster deployments in isolation is tactical. Optimizing for sustainable, risk-adjusted, business-aligned delivery is strategic.
The next time leadership asks whether engineering is productive, you won't reach for activity charts. You'll respond with impact evidence: trend lines tied to business outcomes, insights grounded in workflow context, metrics that influence decision-making rather than just filling reporting cycles.
That is the difference between tracking productivity and understanding it. Between measuring motion and proving impact.
Explore Harness SEI or review implementation details. For teams evaluating long-term fit, review the SEI roadmap.

Hot Takes: What the AI Hype Gets Wrong About Software Engineering Excellence
Matthew Skelton is the CEO & CTO of Conflux and a featured speaker at this year’s DevOps Modernization Summit. Ahead of our annual summit, Matthew has shared his hot takes on AI, DORA, and the key to successful automation. We’ve summarized his thoughts below – or watch for yourself.
Hot Take #1: You're Using AI Backwards
The AI gold rush is in full swing. Every engineering leader is under pressure to adopt it, measure it, and show ROI on it. But here's the uncomfortable truth most people aren't saying out loud: AI is having a massive impact on software engineering — and it's still not delivering real value. Most engineering teams start with the tool, then hunt for a use case. That's exactly wrong.
"It's really important for us to come back to the idea of starting with the outcomes first, then working back towards understanding how we'd use AI to empower teams to be effective stewards of value, to reduce cognitive load, to shorten time to do things that are not value add," Matthew shares.
Until you flip that equation — outcomes first, tools second — AI is just expensive noise. Know what problem you're solving before you touch the tooling.
Hot Take #2: AI-Generated Code Is Creating More Work, Not Less
Here's one nobody wants to admit at the all-hands: spinning up AI to generate mountains of code isn't always a productivity win. Sometimes it's just a liability transfer.
"We're not going to use AI to generate mountains of code that then has to be retested and where we find all the security bugs. But we can use it to aid teams to focus on their mission more effectively," according to Matthew.
More code means more review, more vulnerabilities, more cognitive load on already-stretched developers, creating a velocity paradox. The teams winning with AI aren't using it to ship more — they're using it to do less of what doesn't matter.
Hot Take #3: Chasing DORA Metrics Is a Trap
DORA metrics are everywhere. Deployment frequency. Lead time. MTTR. Change failure rate. And they're being misused by almost everyone who tracks them.
"DORA metrics are output metrics. We shouldn't be trying to drive them directly. We need to be looking at the fundamental capabilities — improving our capabilities and expect to see the DORA metrics change,” he says.
Optimizing for the metric instead of the capability is how you get teams gaming numbers while software quality quietly deteriorates. DORA metrics are a thermometer — not a treatment plan.
And there's another inconvenient truth: "The context for using DORA metrics is quite specific — it's teams that have end-to-end responsibility for value flow. And lots of organizations are not in that place."
If your teams don't own the full value stream, DORA might just be the wrong measuring stick entirely.
Hot Take #4: Most Engineering Metrics Aren't Safe to Optimize
The metrics you push on need to be "safe to optimize." Choosing the wrong metrics doesn't just give you bad data — it actively drives behavior you don't want.
"The specific metrics you want to choose very much depend on the context that you're talking about. We need people with a high degree of awareness of the operating context to select the right metrics to empower leaders to be able to push those levers," he states.
Cookie-cutter metric frameworks applied without context are how you end up with fast deployments of broken software. Context is everything.
Hot Take #5: Manual Compliance Is Already Dead — You Just Haven't Admitted It Yet
The pace of change in technology, regulation, and market conditions has blown past what any team can manage through manual inspection.
"The rate of change of technology, of regulatory requirements, of market and economic trading relationships — the rate of change of all these things is too fast for us to have manual inspection of things like security compliance and regulatory compliance," Matthew says.
If your compliance and security processes still depend on humans checking boxes at the end of a release cycle, you're not managing risk — you're manufacturing it. Compliance has to be baked into the platform. Full stop.
Hot Take #6: Automating Compliance Without Building Trust Will Backfire
Here's the nuance that gets lost when teams rush to automate compliance into their delivery platforms: the technology is the easy part.
According to Matthew: "This has to be baked in. But it has to be baked in in a way which builds trust with the people who are, in some cases, on the hook for things like security compliance and regulatory compliance — particularly in financial services."
"In addition to baking compliance into a platform, we need to have a social dynamic inside the organization that builds that trust so that people feel confident that what the platform is doing and controlling is what's needed."
You can automate every security gate in your CI/CD pipeline, but if the compliance team doesn't trust the platform, they'll route around it. Governance is a people problem as much as a technology problem. Build the trust, or the automation won't stick.
The Bottom Line
Engineering excellence in 2026 doesn't go to the team with the most AI tools or the prettiest DORA dashboard. It goes to the teams who are ruthlessly honest about where they're generating real value — and brave enough to act on what the data is actually telling them.
Start with outcomes. Pick metrics that are safe to optimize. Automate compliance with trust baked in alongside it. And stop using AI to generate problems you'll have to fix later.
Want more hot takes? Join this year’s DevOps Modernization Summit and hear straight from industry leaders.

Engineering Metrics Success: Communicate Speed, Quality, and Business Outcomes
Engineering organizations are waking up to something that used to be optional: measurement.
Not vanity dashboards. Not a quarterly “engineering metrics review” that no one prepares for. Real measurement that connects delivery speed, quality, and reliability to business outcomes and decision-making.
That shift is a good sign. It means engineering leaders are taking the craft seriously.
But there are two patterns I keep seeing across the industry that turn this good intention into a slow-motion failure. Both patterns look reasonable on paper. Both patterns are expensive. And both patterns lead to the same outcome: a metrics tool becomes shelfware, trust erodes, and leaders walk away thinking, “Metrics do not work here.”
Engineering metrics do work. But only when leaders use them the right way, for the right purpose, with the right operating rhythm.
Here are the two patterns, and how to address them.
Pattern #1: “We bought the tool, gave it to leaders, and expected behavior to change”
This is the silent killer.
An engineering executive buys a measurement platform and rolls it out to directors and managers with a message like: “Now you’ll have visibility. Use this to improve.”
Then the executive who sponsored the initiative rarely uses the tool themselves.
No consistent review cadence. No decisions being made with the data. No visible examples of metrics guiding priorities. No executive-level questions that force a new standard of clarity.
What happens next is predictable.
Managers and directors conclude that engineering metrics are optional. They might log in at first. They might explore the dashboards. But soon the tool becomes “another thing” competing with real work. And because leadership is not driving the behavior, the culture defaults to the old way: opinions, anecdotes, and local optimization.
If leaders are not driving direction with data, why would managers choose to?
This is not a tooling problem. It is a leadership ownership problem.
What to do instead: make metrics executive-owned, not manager-assigned
If measurement is important, the most senior leaders must model it.
That does not mean micromanaging teams through numbers. It means creating a clear expectation that engineering metrics are part of how the organization thinks, communicates, and makes decisions.
Here is what executive ownership looks like in practice:
- The executive sponsor uses the tool publicly. In staff meetings, in reviews, in planning, in post-incident discussions.
- Metrics show up in decision moments. Prioritization, investment tradeoffs, risk calls, capacity conversations.
- Leaders ask better questions because they have data. Not “Why are you slow?” but “What is slowing you down, and what would move it?”
- A consistent cadence exists. Not random dashboard reviews. A repeatable operating rhythm.
When executives do this, managers follow. Not because they are told to, but because the organization has made measurement real.
Pattern #2: “Buying a measurement tool will fix our engineering problems”
This is the other trap, and it is even more common.
There is a false belief that if an organization has DORA metrics, improvements in throughput and quality will automatically follow. Like measurement itself is the intervention.
But measurement does not create performance. It reveals performance.
A tool can tell you:
- how long changes take to reach production
- how often you deploy
- how frequently you experience failure
- how quickly you recover
Those are powerful signals. But they do not change anything on their own.
If the system that produces those numbers stays the same, the numbers stay the same.
This is why organizations buy tools, instrument everything, and still feel stuck. They measured the pain, but never built the discipline to diagnose and treat the cause.
What to do instead: treat engineering metrics as instrumentation, not transformation
If you want metrics to lead to improvement, you need two things:
- Clear definitions and shared understanding
- A metrics practice that turns numbers into decisions and experiments
Without definitions, metrics turn into arguments. Everyone interprets the same number differently, then stops trusting the system.
Without a practice, metrics turn into observation. You notice, you nod, then you go back to work.
The purpose of measurement is not to create pressure. It is to create clarity. Clarity about where the system is constrained, what tradeoffs you are making, and whether your interventions actually helped.
The real goal: measure change, not teams
Here is the shift that unlocks everything:
The goal is not to measure engineers.
The goal is to measure the system.
More specifically, the goal is to prove whether a change you made actually improved outcomes.
A change could be:
- a tooling change
- a process change
- a policy change
- a staffing or org change
- a reliability investment
- a platform improvement
- a CI/CD modernization effort
If you cannot measure movement after you make a change, you are operating on opinions and hope.
If you can measure movement, you can run engineering like a disciplined improvement engine.
This is where DORA metrics become extremely valuable, when they are used as confirmation and learning, not as a scoreboard.
Engineering metrics should confirm reality, not replace judgment
The best leaders I have worked with do not hand leadership over to dashboards. They use metrics as confirmation of what they already sense, and as a way to test assumptions.
- “We believe code reviews are a bottleneck. Do we see it in cycle time breakdowns?”
- “We believe flaky tests are slowing delivery. Do we see increased rework or longer lead time?”
- “We believe incident recovery is too manual. Do we see MTTR improve after automation?”
- “We believe our deployment process is too risky. Does change failure rate drop after we change release strategy?”
That is the role of measurement. It turns gut feel into validated understanding, then turns interventions into provable outcomes.
A practical operating model that works
If you want measurement to drive real improvement, here is a straightforward structure that scales.
1) Define what “good” means in your context
Use DORA as a baseline, but make definitions explicit:
- What counts as a deployment?
- What counts as a production failure?
- How do you define lead time?
- How do you define recovery?
This prevents endless debates and keeps the organization aligned.
2) Establish a simple cadence
You do not need a heavy process. You need consistency.
A strong starting point:
- Weekly: team-level review of flow and reliability signals, focused on removing friction
- Monthly: leadership review focused on trend movement, constraints, and investments
- Quarterly: strategic review to decide where to focus improvement efforts next
3) Pair every metric with a lever
A metric without a lever becomes a complaint.
Examples:
- If lead time is high, what levers do you pull?
- reduce batch size, improve trunk-based practices, improve test speed, remove manual approvals
- reduce batch size, improve trunk-based practices, improve test speed, remove manual approvals
- If change failure rate is high, what levers do you pull?
- improve testing strategy, release safety patterns, observability, rollback mechanisms
- improve testing strategy, release safety patterns, observability, rollback mechanisms
- If MTTR is high, what levers do you pull?
- better alerting, runbooks, ownership clarity, automated remediation, incident practices
- better alerting, runbooks, ownership clarity, automated remediation, incident practices
4) Run experiments and measure outcomes
This is the part most organizations skip.
Pick one change. Implement it. Measure before and after. Learn. Repeat.
Improvement becomes a system, not a motivational speech.
5) Make leaders the model
This brings us back to Pattern #1.
If executives use the tool and drive decisions with it, measurement becomes real. If they do not, the tool becomes optional, and optional always loses.
Where the best organizations land
The organizations that do this well eventually stop talking about “metrics adoption.” They talk about “how we run the business.”
Measurement becomes part of how engineering communicates with leadership, how priorities get set, how teams remove friction, and how investment decisions are made.
And the biggest shift is this:They stop expecting a measurement tool to fix problems.They use measurement to prove that the problems are being fixed.
That is the point. Not dashboards, not reporting, not performance theater: Clarity, decisions, experiments, and outcomes.
In the end, measurement is not the transformation. It is the instrument panel that tells you whether your transformation is working.

How Top Engineering Teams Use Software Engineering Insights (SEI) to Drive Measurable Business Impact
Visibility Isn’t Enough, You Need Insights

Engineering organizations today don’t lack data—they lack clarity. Delivery timelines, developer activity, and code quality metrics are scattered across systems, making it hard to answer simple but critical questions: Where are we losing time? Are we investing in the right work? Who needs support or coaching?
This is where Harness Software Engineering Insights (SEI) steps in. Unlike traditional dashboards, SEI offers opinionated, role-based insights that connect engineering execution with business value.
In this post, we’ll walk through a proven rollout framework, real customer success stories, and a practical guide for any organization looking to implement an engineering metrics program (EMP) that actually drives impact.
Step 1: Start With Purpose—Define Objectives That Matter

Rolling out SEI without a clear objective is like configuring CI/CD pipelines without deployment goals. Before diving into dashboards or metrics, align internally on what you’re trying to improve.
Most organizations fall into one or more of the following categories:
- Efficiency: Speed up software delivery and reduce cycle time.
- Productivity: Boost developer engagement and output consistency.
- Alignment: Ensure engineering effort maps to strategic priorities, like building new features vs. maintaining legacy systems.
💡 A powerful first step is simply asking: What are the top 3 decisions you wish you could make with data but currently can't?
Step 2: Choose the Right Engineering Metrics to Track

Once your objectives are clear, it’s time to define the key performance indicators (KPIs) that reflect progress. At Harness, we recommend starting with 5 core metrics that align with your goals:
- DORA Metrics: Lead Time for Change, Change Failure Rate (CFR), Deployment Frequency, MTTR.
- Pull Request Cycle Time: Time from PR creation to merge—an essential signal of workflow health.
- Commit-to-Done Ratio & Scope Creep: Help measure sprint execution quality.
- Effort Allocation (Business Alignment): Understand time spent on KTLO vs. innovation.
- Trellis Score & Coding Days: Surface team and individual developer engagement patterns.
These metrics aren’t just about numbers—they tell a story. And SEI’s pre-built dashboards help visualize that story from day one.
Step 3: Configure SEI for Meaningful Insights

Out-of-the-box data isn’t enough—you need context. SEI allows deep configuration across integrations, people, and workflows to ensure accuracy and actionability.
Integrate the Right Systems
Start with the essentials: Jira or ADO (issue tracking), GitHub or Bitbucket (SCM), Jenkins or Harness CI (build/deploy). Validate data ingestion and set up monitoring for failed syncs.
Set Up Contributor Attributes
Merge developer identities across systems and tag them with meaningful metadata: Role, Team, Location, Manager, and Employee Type (FTE, contractor). This enables advanced filtering, benchmarking, and team-level coaching.
Create Focused Collections
Use Asset-Based Collections for things like repositories or services (ideal for DORA/Sprint metrics) and People-Based Collections for teams, departments, or geographies (perfect for Dev Insights, Trellis, and Business Alignment).
Define Profiles & Widgets
SEI lets you build custom profiles for DORA metrics, Business Alignment, and Trellis. These profiles allow you to set your own definitions for “Lead Time,” “MTTR,” or what constitutes “New Work.” Configurable widgets ensure the insights match your team’s workflows—not the other way around.
Step 4: Align Metrics to Roles & Personas

One of SEI’s most valuable capabilities is persona-based reporting. Not every stakeholder needs to see every metric. Instead, create tailored views based on what matters to them.
| Persona | Primary Metrics | Cadence |
|---|---|---|
| CTO / VP Engineering | DORA, Effort Allocation, Innovation % | Quarterly |
| Director of Engineering | Sprint Trends, PR Cycle Time, MTTR | Monthly |
| Engineering Manager | Coding Days, PR Approval Rate, Rework | Weekly |
| Scrum Master / TPM | Commit-to-Done, Scope Creep, Sprint Hygiene | Weekly/Daily |
| Product Manager | Feature Delivery Lead Time, KTLO vs. New Work | Bi-weekly |
By aligning metrics to what stakeholders actually care about, you reduce dashboard fatigue and increase engagement.
Step 5: Build a Rhythm of Review & Ownership

Rolling out dashboards isn’t enough—you need cadence and accountability.
Successful SEI customers establish regular reviews, such as:
- Weekly Ops Syncs: Review PR trends, coding days, scope creep.
- Monthly Product/Engineering Syncs: Review business alignment and new work %.
- Quarterly QBRs: Revisit OKRs, refine metrics, show trend improvements.
Each dashboard or collection should have an owner, responsible for interpreting and acting on the insights.
Step 6: Scale with Persona-Based Metrics

Once the foundation is in place, go deeper. SEI allows you to scale insight delivery across the org by:
- Creating role-specific dashboards (e.g., VP of Engineering vs. Scrum Master)
- Using Trellis to coach teams and surface hidden top performers
- Integrating with HR systems to layer in context like tenure, geography, or team churn
This is how SEI becomes more than a dashboard—it becomes your engineering operating system.
Step 7: Set Strategic, Measurable Engineering OKRs
Data without goals is directionless. Use SEI to establish stretch goals tied to organizational outcomes.
Here are common SEI-aligned OKRs:
- 📉 Reduce PR Cycle Time by 25%
- 🧠 Improve Coding Days per Developer to 3.5+/week
- ⚖️ Increase Innovation Work (New Features) to 60% of total effort
- 🔧 Decrease Change Failure Rate (CFR) to under 10%
Because SEI continuously measures these metrics, you can track OKR progress in real time.
Real-World Examples: How Leading Companies Use SEI
Cybersecurity: Driving Innovation While Improving Quality

🧭 Objective:
Improve engineering velocity without compromising security or code quality, while ensuring more effort is spent on new feature development.
📈 Key Results:
- Increased New Work allocation to 62.6% of total engineering effort
- Reduced Unapproved Pull Requests by 32%, decreasing potential backlog risk
- Cut PR Cycle Time from 10.4 days to 6.6 days (36% improvement)
💥 Impact:
By using SEI’s Dev Insights and Business Alignment dashboards, the customer was able to shift engineering focus toward innovation. Unapproved PR backlog reductions improved code review discipline, while faster PR cycle times helped the team deliver secure, high-quality features faster.
Information Technology: Scaling Delivery Velocity Without Sacrificing Stability

🧭 Objective:
Accelerate delivery cadence, reduce lead times, and establish a baseline for operational resilience across distributed teams.
📈 Key Results:
- PR Cycle Time dropped from 2.9 days to 47.1 minutes (98.9% reduction)
- Deployment Frequency increased from 1.09/day to 33.91/day
- Lead Time for Change reduced from 9.3 months to 2.8 months
💥 Impact:
SEI enabled visibility into every stage of the SDLC — from PRs to production. Dashboards helped engineering leadership identify workflow bottlenecks, while improved cycle time allowed the team to launch features continuously. The organization was also able to define new goals around MTTR reduction for future sprints.
Financial Services: Balancing Risk and Speed During Transformation

🧭 Objective:
Improve release predictability, reduce change failure rates, and maintain quality during large-scale technology transformations.
📈 Key Results:
- Lead Time reduced by 78% (from 1.3 months to 9.4 days)
- Change Failure Rate (CFR) dropped from 39.9% to 14.4%
- PR Merge Time decreased from 22 hours to 6.4 minutes (98% faster)
💥 Impact:
Using SEI’s DORA and Sprint Insights dashboards, engineering teams surfaced high-risk areas and improved review discipline. Leadership used Business Alignment reports to visualize time allocation, allowing them to rebalance priorities between legacy maintenance and innovation initiatives — critical for de-risking digital transformation.
Hospitality: Optimizing Hybrid Teams and Engineering Workflows

🧭 Objective:
Improve collaboration and execution within hybrid teams (FTEs and contractors), while accelerating delivery with fewer blockers.
📈 Key Results:
- PR Approval Time dropped from 10.9 to 8.2 days
- Average Coding Days per Week sustained at 4.2 days, exceeding industry average
- Contributor collaboration scores highlighted imbalances between contractor and FTE output
💥 Impact:
SEI helped the customer restructure their hybrid engineering model by revealing top contributors, low-collaboration patterns, and team-specific bottlenecks. By tagging contributors by type, team, and location, the organization realigned review ownership and improved handoff speed across distributed groups.
Gaming: Enhancing Stability and Predictability in Feature Delivery

🧭 Objective:
Reduce production risk while accelerating feature releases in a highly agile environment.
📈 Key Results:
- Change Failure Rate improved by 83% (from 23.7% to 3.9%)
- Lead Time dropped from 2 months to 18.7 days
- Unapproved PRs decreased by 60%, improving review throughput
💥 Impact:
SEI’s DORA metrics helped the team move from reactive issue management to proactive release planning. With improved scope hygiene and PR discipline, the organization was able to deliver features at a faster pace while maintaining platform stability — a crucial balance in gaming environments where user experience is paramount.
API Security: Accelerating High-Throughput Development with Balance

🧭 Objective:
Speed up secure development without compromising engineering discipline or quality during rapid team expansion.
📈 Key Results:
- PR Lead Time reduced by 95.7% (from 3.2 months to 4.1 days)
- Coding Days increased from 0.4 to 4.9 days/week (10x improvement)
- Deployment Frequency scaled to 95.79/day, enabling near-continuous delivery
💥 Impact:
The customer used SEI to quantify the tradeoff between speed and review quality. By highlighting areas with excessive unapproved PRs and scope creep, the team set up opinionated OKRs to strike a balance between velocity and sustainability. Trellis and Dev Insights dashboards were used to coach developers and improve overall workflow consistency.
Further Resources
Build an Insight-Driven Engineering Culture
The most successful engineering organizations don’t just collect metrics—they operationalize them. Harness SEI enables your teams to go beyond dashboards and build a culture of insight, accountability, and impact.
By following a structured rollout, aligning metrics to personas, and setting outcome-focused OKRs, SEI can become the backbone of your engineering excellence strategy.
About the Author
Adeeb Valiulla leads the Quality Assurance & Resilience, Cost & Productivity function at Harness, where he works closely with Fortune 500 customers to drive engineering efficiency, improve developer experience, and align software delivery efforts with business outcomes. With a focus on measurable insights, Adeeb helps organizations turn engineering data into actionable intelligence that fuels continuous improvement. He brings a unique blend of technical depth and strategic vision, helping teams unlock their full potential through data-driven transformation.
Checkout : Harness Software Engineering Insights , Harness Software Engineering Insights Feature

Where Developers Spend Time (vs. Where They Should Be)
Every so often, a piece of research lands in your inbox that makes you pause and think, “Yeah, this is exactly what I’ve been seeing, but couldn’t articulate.”
Microsoft’s recent study, “Time Warp: The Gap Between Developers’ Ideal vs Actual Workweeks in an AI-Driven Era” is that kind of read. It maps a disconnect I’ve heard developers vent about in 1:1s and retro meetings: the constant struggle between what they’re doing and what they wish they were doing.
In this article, we talk about that exact gap. And more importantly, what we as product leaders can learn from it.
Where Developers Actually Spend Their Time
Let’s start with the uncomfortable truth. Developers are spending a surprising amount of time not developing. Microsoft’s study shows:
- Only a fraction of their week is spent writing code, designing systems, and shipping features.
- The majority is consumed by meetings, Slack messages, tool wrangling, and waiting for approvals or unblockers.
None of this is shocking if you’ve worked with engineers up close. But seeing it quantified is a reality check. We’ve built org structures and workflows that slowly chip away at the flow state.
The Ideal Week (And Why It Matters More Than We Think)

When developers talk about their “perfect week,” it’s surprisingly consistent.
They want more time for deep work, heads-down coding, solving real problems, and making architecture decisions that actually move the product forward.
They want collaboration, but the kind that’s quick, intentional, and actually helps, not an endless stream of pings, meetings, and status updates. They’re not asking to go off into a cave. They still value teamwork. But the ask is simple: less noise, more impact.
When there’s a big gap between how their week actually goes vs. how they wish it would, satisfaction drops. It’s not just about efficiency, it’s about identity. Developers want to feel like builders, not just operators moving tickets from “In Progress” to “Done.” That’s what’s really at stake when we talk about developer experience.
The Promise (and Pitfalls) of AI
One of the most interesting parts of Microsoft's research is how it frames AI not as some future disruption, but as a tool developers are already leaning on today to reclaim their time. Developers who regularly use AI tools (like GitHub Copilot, code assistants, and auto-summarization tools) are seeing a closer match between how they want to spend their week and how they actually spend it. Not because AI is doing their jobs for them but because it’s helping clear the clutter.
That’s the real product insight: AI isn’t just another feature you bolt onto a dev tool. When it’s done right, it acts as a force multiplier. It automates the repetitive, low-value work that usually derails focus so developers can stay in their flow state longer. But the flip side is just as important: if AI adds complexity or noise, it becomes another source of interruption. We have to be deliberate about where and how we apply it.
So... What Should We Actually Do?
It’s really tempting to jump straight into solution mode. But the first move isn't to fix it. It’s to understand.
Before we throw new tools, new processes, or new initiatives at the problem, we need to take a real, honest look at what the developer experience actually feels like today.

Here’s a simple way to break it down:
People
- Are developers overwhelmed by communication overload?
- Are code reviews and approvals turning into bottlenecks?
- Are roles, responsibilities, and ownership clear or does every task feel like a game of telephone?
Tools
- Are our tools genuinely helping or just adding more clicks, tabs, and overhead?
- Is constant context-switching draining more energy than it’s saving?
- Are our integrations automating real work, or just creating new layers of friction?
- Can our tools’ value be measured and proven?
Process
- Are meetings amplifying impact or just eating up time?
Are workflows making work visible or are they quietly creating hidden, invisible tasks that pile up? - Can we measure the impact of our people, processes and tools on business initiatives and overall outcome?
We recommend starting with a simple 3-step approach.
Step 1: Get the Right Data
Start with the basics. You don’t need “N” number of dashboards what you need is a few key signals that reveal where energy is leaking:
At Harness, we believe in anchoring to DORA metrics first because they tell you whether your team is predictably delivering value:
- Deployment Frequency: How often is working software reaching production?
- Lead Time for Changes: How quickly can you move from idea to deployable code?
- Change Failure Rate: When you ship, how often do you cause issues?
- Mean Time to Restore: How fast can you recover when things break?
DORA gives you the high-level outcomes but not the full story. Once you establish that baseline, you drill deeper into flow metrics to uncover where energy is leaking day-to-day. Specifically, track:
- Cycle Time: How long does it take to move work from “start” to “done”?
- Pull Request Review Duration: How long are PRs sitting idle? Where do reviews get stuck?
- Deployment Delays: After the code is merged, how long until it’s actually shipped?
And just as important: Pair quantitative metrics with qualitative feedback.
- Run anonymous developer experience surveys.
- Capture how developers feel about their day-to-day not just how fast they’re moving tickets.
Look for the early warning signs: Long review queues. Increased context-switching. Meetings that nobody wants but everyone attends. Friction shows up before velocity drops; you just have to know where to look.
Step 2: Understand the Context
Numbers alone aren’t enough. Metrics tell you what’s happening but they’ll never tell you why.
You might see a spike in pull request cycle times.
Is it because teams are slacking off?
Or because reviewers are spread across too many projects?
Or because no one knows who’s responsible for the next action?
You need real conversations. You need to hear the "why" directly from the people living it every day.
Treat data as a conversation starter, not a final answer. The goal isn’t just to measure experience, it's to understand it.
Step 3: Act with Insight
Once you understand the landscape, act deliberately.
- Prioritize bottlenecks that drain energy, not just those that slow throughput. (Developer burnout is a bigger threat than a slow sprint.)
- Be intentional with AI and automation. Focus on automating repetitive, mentally draining tasks, not the meaningful ones developers actually enjoy solving.
- Design for deep work. Protect focus time. Build workflows that amplify heads-down problem-solving, not constant multitasking.
The goal isn’t more activity, it's more effective workweeks.
How Harness Software Engineering Insights can help you here?
This is exactly the problem we built Harness Software Engineering Insights (SEI) to solve.
- We help you track the very foundational delivery metrics like DORA (Deployment Frequency, Lead Time for Changes, Change Failure Rate, and Mean Time to Restore).
- It surfaces where flow is breaking down across tools, across people, across processes.
- It goes beyond vanity dashboards to provide actionable insights you can actually do something with.
We don’t believe metrics alone fix anything.
Our real North Star isn’t a better report card. It’s a better developer week.
Metrics are just the starting line. The real value comes from creating environments where developers spend more time building, solving, and innovating and less time stuck in endless loops of coordination and rework.
The North Star: Rebuilding the Developer Week
Building great products isn’t just about shipping roadmaps and features faster.
It’s about building environments and systems where people can do their best, most meaningful work.
If our developers feel stuck in a “Time Warp” consumed with a week full of meetings, blockers, and busy work, then no amount of AI, velocity tracking, or sprint burndowns will fix morale.
The next frontier isn’t just shipping faster. It’s about helping developers reclaim better weeks. And this is where leadership plays a critical role. With Harness SEI, we empower leaders with crystal-clear visibility into how their teams actually work, highlighting where flow is breaking down, where friction builds, and where leaders can step in to remove barriers. The goal isn’t just to optimize metrics it’s to free developers to do what they love best: building, creating, and solving meaningful problems.
Helping developers close the gap between the real and the ideal week isn’t just about improving productivity metrics. It’s about restoring a sense of purpose, ownership, and flow of the very things that make engineering such a creative, energizing craft. And I think that’s a future worth obsessing over.
Learn more: The causes of developer downtime and how to address them

Elite Engineering Teams Don’t Guess—They Prove Impact
Introduction: The Game Has Changed
Engineering leadership used to be about gut feel, strong opinions, and shipping fast. But that playbook is expiring—quickly.
The world we’re building software in today is fundamentally different. Economic pressure, AI disruption, rising complexity, and the demand for hyper-efficiency have converged. Old-school metrics, instinct-led prioritization, and managing by velocity charts won’t cut it.
What today’s engineering leaders need isn’t more dashboards. They need clarity. They need trust. They need a new way to lead.
And most of all? They need to stop guessing.

Stop Guessing. Lead with Clarity.
You shouldn’t have to start every leadership meeting explaining what your teams are working on, why something slipped, or where time is going.
With Harness Software Engineering Insights (SEI), you don’t guess. You know.
You see where bottlenecks are forming. You know when PRs are aging in silence. You understand whether your teams are overcommitted, burned out, or executing beautifully. You know the tradeoffs being made between tech debt, features, and KTLO—before someone asks.
SEI replaces opinions with insight. It surfaces the friction you can’t see in a sprint report, and helps you make smarter decisions based on what’s actually happening—not what you hope is happening.
Because in the new era of engineering, clarity is leadership.

Show the Full Story of Engineering
But when you only measure output—story points, releases, burnup—you miss the nuance. You miss the tradeoffs. You miss the why behind the work.
Harness SEI helps leaders tell the complete story:
- How time is spent (KTLO vs. Building New Stuff vs. Improving Existing Stuff)
- How long it takes to turn ideas into reality (lead time, PR cycle time)
- How well teams plan, execute, and adapt (commit-to-done, scope creep)
- And how all of this connects to business value
This is the story your CFO, CPO, and CEO need to hear—not how many tickets you closed last sprint.
Engineering deserves to be understood. SEI makes it possible.

Efficiency is the New Growth
Let’s be honest: we’re no longer in a “hire at all costs” era. Efficiency is the new growth. The mandate is clear:
- Do more with less.
- Move faster with smaller teams.
- Prove impact, not just activity.
And that’s not a burden—it’s an opportunity.
With Harness SEI, leaders can finally quantify engineering capacity, align work with outcomes, and invest where it matters most. You can see which teams are stretched too thin, where tech debt is slowing you down, and which initiatives are driving measurable business value.
This isn’t about pushing harder. It’s about working smarter, leading sharper, and delivering more strategically.

Protect Creativity. Automate the Repetition.
Great engineering happens when teams have clarity, focus, and space to build. But too often, they’re stuck in the weeds—fighting fires, filling out status reports, and guessing what matters.
With SEI, that changes.
- No more asking devs for their weekly updates—you already have the data.
- No more chasing sprint reports—they’re live and self-serve.
- No more guessing which efforts are paying off—you can prove it.
This frees up energy for real engineering. It protects time for hackathons, R&D spikes, creative sprints—the things that move the business forward and keep developers fulfilled.
Because in a world full of AI and automation, the one thing we can’t afford to lose is human creativity.
SEI helps you protect it—by getting rid of everything that wastes it.

A Better Developer Experience Starts with Better Leadership
Burnout doesn’t start with bad code. It starts with bad leaders.
When developers don’t know where their work is going, why it matters, or what success looks like, morale suffers. When they’re forced to do status updates instead of shipping, they disengage. When PRs sit for days, they lose momentum.
SEI enables developers to see how their work connects to outcomes. It enables faster feedback, less friction, and clearer focus.
And for leaders? It means fewer surprises, better retention, and more meaningful 1:1s.

The Future of Engineering Leadership Starts Now
The best engineering leaders of the next decade won’t just be great technologists, they’ll be clear communicators, business strategists, and defenders of engineering best practices.
They’ll lead with data, empathy, and decisiveness.
They’ll connect effort to impact.
They’ll stop guessing. And they’ll lead better because of it.
If you're ready to lead in this new era, Harness SEI is your competitive advantage.

The Executive Playbook: Communicating Engineering Metrics for Maximum Business Impact
Introduction:
For too long, engineering has been seen as a black box—an opaque function that takes in business requirements and delivers software without clear visibility into the process. But in today’s data-driven, business-first world, engineering leaders must do more than execute; they must influence, align, and communicate with executive peers to drive business outcomes.
CTOs, VPs of Engineering, and other technical leaders who can effectively translate engineering metrics into business impact gain a seat at the strategic table. Instead of reacting to business requests, they help shape company priorities, resource allocation, and long-term growth strategies.
But here’s the challenge: Traditional engineering metrics don’t resonate with executives. Story points, commit counts, and deployment logs mean little to a CFO, CMO, or CEO. To gain influence, engineering leaders need to frame their work in business terms—think predictability, customer impact, cost efficiency, and revenue acceleration.
That’s where Harness Software Engineering Insights (SEI) comes in. SEI transforms engineering metrics into clear, actionable insights that bridge the gap between technical execution and business strategy. This blog will show you how to use SEI to speak the language of executives, drive cross-functional alignment, and elevate engineering’s strategic role in your organization.
Understanding Executive Priorities: Tailoring Metrics to Your Audience
Before presenting engineering metrics, it’s critical to understand what matters to your executive peers. Different leaders prioritize different business drivers, and aligning your communication style accordingly makes your insights more relevant and impactful.

How Different Executives Think About Metrics
| Executive | Key Priorities | How Engineering Metrics Apply |
|---|---|---|
| CEO (Chief Executive Officer) | Revenue growth, competitive differentiation, innovation | Engineering’s impact on faster time-to-market, scalability, and business alignment |
| CFO (Chief Financial Officer) | Cost efficiency, budget predictability, ROI | Engineering capacity, cost of technical debt, and efficiency improvements |
| CRO (Chief Revenue Officer) | Sales velocity, customer retention, revenue expansion | Feature delivery timelines, system reliability, customer-impacting defects |
| CPO (Chief Product Officer) | Product roadmap execution, user experience, feature adoption | Lead Time for Change, deployment frequency, engineering capacity for innovation |
| CMO (Chief Marketing Officer) | Digital transformation, campaign execution, website/app performance | Site reliability, system uptime, infrastructure scalability, release predictability |
🔹 Takeaway: Before presenting engineering data, frame it in terms of the business goals that resonate with each executive stakeholder.
Choosing the Right Metrics: Moving from Engineering-Centric to Business-Focused
Many engineering leaders fall into the trap of reporting on vanity metrics—like total commits, number of deployments, or story points completed—without connecting them to business outcomes.
The key is choosing the right metrics that executives care about. Harness SEI helps track engineering performance across three core areas:
- Efficiency → How quickly and predictably does engineering deliver value?
- Productivity → How effectively are engineering resources utilized?
- Business Alignment → How well does engineering effort map to company priorities?

Let’s explore which SEI metrics best support each area.
Key Engineering Metrics for Executive Communication
1. On-Time Delivery → Engineering Predictability Matters
- Why It Matters: Executives need confidence in engineering’s ability to deliver on time and as planned to align sales, marketing, and customer expectations.
- SEI Advantage: Track commit-to-done ratio, sprint hygiene, and release cadence to demonstrate predictable execution.
🎯 How to Communicate It: “Over the past quarter, engineering has improved on-time delivery from 67% to 85%, reducing last-minute delays and improving cross-team alignment.”
2. Engineering Capacity → Balancing Innovation & Maintenance
- Why It Matters: Business leaders must understand how much of engineering’s effort is spent on innovation vs. sustaining work.
- SEI Advantage: SEI’s Business Alignment Dashboard helps track engineering investments in:
- KTLO (Keep the Lights On) – Maintenance and bug fixes
- Build New Stuff – Feature development and innovation
- Improve Existing Stuff – Enhancements and refactoring
- KTLO (Keep the Lights On) – Maintenance and bug fixes
🎯 How to Communicate It: “Currently, 54% of engineering work is dedicated to new feature development, while 32% is spent on maintenance and 14% on technical debt reduction.”
3. Lead Time for Change & Deployment Frequency → Measuring Agility & Business Impact
- Why It Matters: Faster feature delivery leads to quicker customer adoption and revenue growth.
- SEI Advantage:
- Lead Time for Change → Measures how quickly engineering can deliver value from ideation to production.
- Deployment Frequency → Indicates the speed and efficiency of software releases.
- Lead Time for Change → Measures how quickly engineering can deliver value from ideation to production.
🎯 How to Communicate It: “We’ve reduced Lead Time for Change from 14 days to 9 days, improving our ability to respond to market demands faster.”
4. Ramp Time for Engineers → Setting Realistic Hiring Expectations
- Why It Matters: Hiring new engineers is only part of scaling; onboarding efficiency determines how quickly they contribute.
- SEI Advantage: SEI tracks coding activity, PR contributions, and review cycles to measure how long it takes new hires to become productive.
🎯 How to Communicate It: “New engineers ramp up to full productivity in 6 weeks on average, down from 8 weeks last year.”
How SEI Helps Engineering Leaders Communicate Impact
Harness SEI provides efficiency, productivity and alignment dashboards that make engineering metrics clear, visual, and actionable for executives.
1. Executive-Friendly Reports
SEI’s DORA, Sprint Insights, and Business Alignment Dashboards provide high-level summaries while allowing leaders to drill into details when needed.
2. Proactive Risk & Opportunity Insights
Rather than waiting for executives to ask, SEI highlights risks upfront (e.g., increasing cycle time, declining deployment frequency) and identifies bottlenecks..
3. Data Storytelling
Numbers alone don’t drive action—framing metrics as stories do. SEI allows engineering leaders to present data in a way that connects to business goals and influences decisions.

Best Practices for Cross-Functional Communication
- Set a Regular Reporting Cadence: Weekly syncs for tactical updates, quarterly reports for strategy alignment.
- Use Data Storytelling: Turn raw data into compelling narratives that explain what happened, why it matters, and what actions to take.
- Be Transparent About Risks: Use SEI insights to identify bottlenecks and propose solutions before they become executive concerns.
Conclusion: Elevate Engineering’s Role with SEI
Engineering is no longer just about writing code—it’s about driving business value. By using Harness SEI to track and communicate on-time delivery, engineering capacity, deployment frequency, and business alignment, engineering leaders can:
✅ Influence executive decisions by aligning engineering work with company priorities.
✅ Improve collaboration across teams by providing visibility into engineering efforts.
✅ Proactively drive impact instead of reacting to business requests.
Ready to communicate engineering’s impact more effectively? Start leveraging SEI today to gain visibility, efficiency, and alignment across your organization.
👉 Learn more about Harness SEI here.

8 Essential Questions to Boost Developer Productivity
Developer productivity has become a critical factor in today's fast-paced software development world. Organizations constantly seek methods to enhance productivity, improve engineering efficiency, and align their development teams with strategic business goals. But navigating the complexities of developer productivity isn't always straightforward.
In this blog, we’ll hear from Adeeb Valiulla, Director of Engineering Excellence at Harness, as we answer some of the most pressing questions on developer productivity to help you optimize your teams and processes effectively.
1. What is Developer Productivity?
Developer productivity refers to the efficiency and effectiveness with which software developers deliver high-quality software solutions. It encompasses the speed and quality of coding, reliability of deployments, the ability to quickly recover from failures, and alignment of development efforts with strategic business goals. High developer productivity means achieving more impactful outcomes with fewer resources, enabling organizations to stay competitive and agile in rapidly evolving markets.

2. Why Is Developer Productivity Important?
Developer productivity directly impacts an organization's ability to deliver software quickly, reliably, and with high quality. High productivity enhances agility, reduces costs, accelerates feature delivery, and ultimately drives customer satisfaction and competitive advantage. Improving productivity not only benefits the business but also increases developer satisfaction by removing bottlenecks and empowering teams.
Real-World Example from __LINK_1__
“In the hardware technology industry, a well-known global hardware company implemented an engineering metrics program under Harness’s and my guidance. This led to significantly boosted developer productivity. Their PR cycle time improved dramatically from nearly 3 days to under an hour, greatly enhancing delivery speed and agility.”

3. Can Software Developer Productivity Really Be Measured?
Yes, software developer productivity can be effectively measured. While measuring productivity isn't always simple due to the complexity of software development, several key metrics have emerged as valuable indicators:
- Lead Time for Changes
- How quickly code moves from commit to production.
- Deployment Frequency
- Frequency of deployments to production.
- Mean Time to Restore (MTTR)
- Speed of recovery from incidents.
- Change Failure Rate
- Stability and reliability of code deployments.
- Commit to Done Ratio
- Rate of planned tasks successfully completed.
These metrics, when applied carefully and contextually, provide actionable insights into developer productivity.
Real-World Example from __LINK_2__
“In the Gaming Industry, Harness’ holistic approach to productivity, which emphasizes consistent developer engagement and effective scope management, enabled a gaming company to manage scope creep and improve their weekly coding days significantly. This strengthened their development workflow and productivity.”

4. Can Generative AI (GenAI) Improve Developer Productivity?
Generative AI certainly has the potential to improve developer productivity. But. the verdict is still out on whether GenAI provides any significant net improvements. GenAI certainly helps developers write code faster while they are coding by automating repetitive coding tasks, enhancing code reviews, predicting potential errors, and accelerating problem-solving. The vision is that AI-powered tools will help developers write cleaner, more reliable code faster, freeing them to focus on strategic, high-value tasks.
However, the time saved by using GenAI is not guaranteed to net as a productivity gain vs. new challenges GenAI brings, such as learning to prompt optimally, time spent learning and fixing the code it produces, and the potential system and software delivery lifecycle (SDLC) bottlenecks that can occur with the increased pace of new code that needs to be handled, deployed, and tested.
Tools such as Harness Software Engineering Insights (SEI) and AI Productivity Insights (AIPI) can help measure how, where, and with who, AI is causing impact (both positive and potential negative) so that you can optimize the likelihood that GenAI will have a positive impact on your developer productivity.
Additionally, most GenAI developer tool focus has been on AI coding assistants. However, coding is 30-40% of the work that needs to be done to get software updates and enhancements delivered (the pipeline and SDLC stages, as mentioned above). This leaves 60-70% of the overall process that GenAI is not yet helping with. The Harness AI-Native Software Delivery Platform provides many AI agents that help to automate about 40% of the part of the SDLC process that is not coding.

5. How Do You Measure Developer Productivity?
Measuring developer productivity involves:
- Defining clear and relevant metrics (like DORA metrics).
- Utilizing productivity platforms, such as Harness Software Engineering Insights (SEI), to integrate with your SDLC toolset, configure and analyze.
- Regularly reviewing dashboards for insights and making data-driven adjustments to improve processes and workflows.
When measuring developer productivity, focus on outcome-based metrics rather than activity counts. DORA metrics (deployment frequency, lead time, change failure rate, and recovery time) provide valuable insights into team performance and delivery efficiency. Complement these with contextual data like PR cycle times, coding days per week, and the ratio of building versus waiting time.
Harness SEI implements dashboards that visualize these metrics by role, enabling managers to identify bottlenecks, engineers to track personal progress, and executives to monitor overall delivery health. To learn more, read our blog on Persona-Based Metrics.
Remember that measurement should drive improvement, not punishment—create a psychologically safe environment where data informs positive change rather than triggering defensive behavior.
6. How Do You Improve Developer Productivity?
Improving developer productivity requires a multi-faceted approach that addresses both technical and organizational constraints. Start by eliminating common friction points: reduce build times through better CI/CD pipelines, implement robust code review processes that prevent bottlenecks, and adopt standardized development environments that minimize "it works on my machine" issues. Investment in developer tooling often yields outsized returns.
Improving developer productivity requires:
- Process Optimization
- Streamline workflows and eliminate unnecessary steps.
- Tooling Enhancements
- Adopt modern tools and automate repetitive tasks.
- Culture and Collaboration
- Foster collaborative practices, knowledge sharing, and peer review.
- Focus on Developer Experience
- Reduce cognitive load and distractions, enabling deeper, uninterrupted work.
Creating focused work environments is equally crucial. Research shows that developers need uninterrupted blocks of at least 2-3 hours to reach flow state—the mental zone where complex problem-solving happens most efficiently. Consider implementing "no-meeting days" or core collaboration hours to protect deep work time. Google's approach of 20% innovation time and Atlassian's "ShipIt Days" demonstrate how structured creative periods can boost both productivity and engagement.
Finally, regularly audit and reduce technical debt; Etsy's practice of dedicating 20% of engineering resources to infrastructure improvements ensures their codebase remains maintainable as it grows. The most productive engineering cultures view developer experience as a product itself—one that requires continuous investment and refinement.
Real-World Example from __LINK_8__
“In the cybersecurity sector, teams following Harness’ Engineering Metrics Program, consistently averaged over 4.5 coding days per week, demonstrating high developer engagement and productivity.”

7. How Do You Measure Developer Productivity in Agile?
In Agile environments, a deeper analysis of key metrics provides valuable insights into developer productivity:
Sprint Velocity
Sprint Velocity serves as more than just a workload counter—it's a team's productivity fingerprint. High-performing teams focus less on increasing raw velocity and more on velocity stability, which indicates predictable delivery. By tracking velocity variance across sprints (aiming for less than 20% fluctuation), teams can identify external factors disrupting productivity. Leading organizations complement this with complexity-adjusted velocity, weighting story points based on technical challenge to reveal where teams excel or struggle with certain types of work.
Sprint Burndown Charts
Sprint Burndown Charts reveal productivity patterns beyond simple progress tracking. Teams should analyze the chart's shape—a consistently flat line followed by steep drops indicates batched work and potential bottlenecks, while a jagged but steady decline suggests healthier continuous delivery. Advanced teams overlay their burndown with blocker indicators, clearly marking when and why progress stalled, creating accountability for removing impediments quickly.
Commit to Done Ratio
Commit to Done Ratio offers insights into planning accuracy and execution capability. The most productive teams maintain ratios above 80% while avoiding artificial padding of estimates. By categorizing incomplete work (technical obstacles, scope changes, or estimation errors), teams can systematically address root causes rather than symptoms. Some organizations track this metric over multiple sprints to identify trends and measure the effectiveness of process improvements.
PR Cycle Time
PR Cycle Time deserves granular analysis, as code review often becomes a hidden productivity drain. Break this metric into component parts—time to first review, rounds of feedback, and time to final merge—to pinpoint specific improvement areas. Top-performing teams establish service-level objectives for each stage (e.g., initial reviews within 4 hours), supported by automated notifications and team norms. This detailed approach turns PR management from a black box into a well-optimized workflow with predictable throughput.
8. How Do You Track Developer Productivity Using Harness SEI?
Harness SEI provides robust tracking of developer productivity by:
- Integrating with your Issue Management, Source Code Management, CI and CD tools
- Providing seamless data integration and comprehensive tracking.
- Creating visibility into your efficiency
- Leveraging DORA and Sprint Insights to measure and enhance engineering efficiency.
- Providing productivity insights
- Utilizing Dev Insights and Personalized Development Metrics to pinpoint productivity opportunities.
- Ensuring alignment
- Offering Business Alignment metrics to ensure your team’s efforts are strategically aligned.
- Actionable Insights
- Identifying bottlenecks, enabling proactive adjustments, and delivering targeted recommendations for continuous improvement.
- Implementing an Engineering Metrics Program
- Creating a structured approach to consistently measure and optimize engineering performance.
- Creating Persona-Based Metrics
- Customizing insights and dashboards tailored specifically to different roles for maximum impact.
Harness SEI empowers teams to enhance productivity by clearly visualizing critical productivity metrics.

Harness' View On What Improves Developer Productivity
Adeeb emphasizes that
Improving developer productivity requires a holistic and human-centric approach. It's not merely about tools and metrics but fundamentally about creating an environment where developers can consistently deliver high-quality output without unnecessary friction.
According to Adeeb, the key factors include:
- Empowering Autonomy and Ownership
- Developers must feel a sense of ownership over their work, which empowers them to make decisions and contribute creatively.
- Fostering Psychological Safety
- Creating a culture where team members can openly communicate, experiment, and learn from failures without fear.
- Balancing KTLO and Innovation
- Effectively balancing "Keep the Lights On" (KTLO) tasks with new feature development to ensure continuous innovation and technical stability.
- Effective Tooling and Automation
- Providing the right tools that automate mundane tasks, reducing cognitive load, and allowing developers to focus on critical, high-value tasks.
- Continuous Learning and Growth
- Encouraging ongoing professional development and learning opportunities to maintain engagement and adapt to technological advancements.
- Clear Alignment and Communication
- Ensuring clear communication of business goals and alignment between development efforts and strategic business outcomes.
Harness' approach advocates for an integrated strategy that aligns technology, processes, and culture, emphasizing developer well-being as central to sustainable productivity improvements.
Boost Your Team's Productivity Today
Harnessing the right insights and strategies can transform your software development processes, driving efficiency, innovation, and growth. Ready to elevate your developer productivity to the next level? Discover the power of Harness Software Engineering Insights (SEI) and start achieving measurable improvements today.
Request a meeting or demo
Learn more: The causes of developer downtime and how to address them
Harness Announces New AI Agents for Software Delivery
Today, we're thrilled to announce a significant leap forward in our commitment to AI-driven innovation. Harness, a leader in AI-native software delivery, is proud to introduce three powerful AI agents designed to transform how teams create, test, and deliver software.
Since introducing Continuous Verification in 2018, Harness has been at the forefront of leveraging AI and machine learning to enhance software delivery processes. Our latest announcement reinforces our position as an industry pioneer, offering a comprehensive suite of AI-powered tools that address critical challenges across the entire software delivery lifecycle (SDLC).
Our vision is a multi-agent architecture embedded directly into the fabric of the Harness platform. We’re building a powerful library of ‘assistants’ designed to make software delivery faster, more efficient, and more enjoyable for developers. These AI-driven agents will work seamlessly within our platform, handling everything from automating complex tasks to providing real-time insights, freeing developers to focus on what they do best: creating innovative software.
Let's explore the capabilities of these new AI agents and see how they will reshape the future of software delivery.
AI QA Assistant: End-to-End Test Automation
The Harness AI QA Assistant is a game-changer in the world of software testing. This generative AI agent is purpose-built to simplify end-to-end automation and accelerate the transition from manual to automated testing. End-to-end tests have been plagued by slow authoring experiences that yield brittle tests, which need to be tended to every time the UI changes.
By harnessing the power of AI, this assistant offers a range of benefits that can dramatically improve your testing processes:
- 10x Faster Test Creation: One of the most significant advantages of the AI QA Assistant is its ability to accelerate test creation. Through a generative AI-powered, no-code platform, teams can now create high-quality tests in a fraction of the time it would take to hand-script them. This capability democratizes test creation, enabling team members across various skill levels to contribute to the testing process effectively. Harness will help teams enhance their tests as well. By proactively recommending additional checks and assertions, the assistant makes it easy to improve the depth of your testing.
- 70% Less Test Maintenance: Test maintenance has long been a thorn in the side of QA teams, consuming valuable time and resources. The AI QA Assistant addresses this pain point head-on with AI-driven test execution and self-healing capabilities. The AI understands the intent behind a test. If the UI changes, it will identify the new path to achieving the same intent. By automatically adapting tests to application changes, it minimizes the need for manual maintenance, freeing up your team to focus on more strategic tasks.
- 5x Faster Release Cycles: By eliminating manual testing bottlenecks, the AI QA Assistant paves the way for significantly faster release cycles. Integrating AI-powered automated testing into your CI/CD pipeline streamlines the entire process, allowing you to ship faster and more confidently.
Sign up today for early access to the AI QA Assistant.
AI DevOps Assistant: Better Pipelines Faster
Crafting pipelines can be challenging. You need to consider your core build and deployment activities, as well as best practices around security scans, testing, quality gates, and more. The new Harness AI DevOps Assistant will make creating great pipelines much easier.
- Create Pipelines in Seconds: Gone are the days of spending hours configuring complex pipelines. The AI DevOps Assistant allows you to create comprehensive pipelines in mere seconds. By leveraging AI to understand your application’s requirements and your teams’ preferred tools, policies, and patterns, it can generate optimized pipeline configurations rapidly, saving valuable time and reducing the potential for mistakes.
- Effortless Pipeline Modification with Natural Language: You can also use the DevOps assistant to refine existing pipelines. The AI DevOps Assistant understands natural language commands, allowing you to modify your pipelines effortlessly. Whether you need to add a new stage, adjust deployment parameters, or integrate a new tool, you can simply describe the changes you want, and the assistant will implement them accurately.
- Proactive Suggestions: The DevOps Assistant provides intelligent suggestions to optimize your pipelines. It analyzes your current pipeline configurations against Harness recommended best practices and identifies areas for improvement. These suggestions can help reduce build times, enhance reliability, and ensure your pipelines align with industry standards.
- Automatic Diagnosis and Remediation of Common Failures: Minimizing downtime is crucial. The AI DevOps Assistant excels in this area by automatically diagnosing common pipeline failures and providing immediate remediation steps. This proactive approach to problem-solving can significantly reduce the mean time to recovery (MTTR) for your pipelines, ensuring smoother, more reliable software delivery.
The introduction of the AI DevOps Assistant marks a significant milestone in our mission to simplify and streamline the software delivery process for the world’s developers. By automating complex tasks, and providing intelligent insights, this capability empowers teams to focus on innovation rather than getting bogged down in pipeline management intricacies.
Sign up today for early access to the AI DevOps Assistant.
AI Code Assistant: Boosting Developer Productivity
The Harness AI Code Assistant accelerates developer productivity by streamlining coding processes and providing instant access to relevant information. This intelligent tool integrates seamlessly into the development workflow, offering a range of features that enhance coding efficiency and quality:
- Intelligent Code Completion: As developers write code, the AI Code Assistant recommends relevant code snippets, helping to accelerate the coding process. This feature is particularly useful for repetitive tasks or when working with unfamiliar libraries or frameworks.
- Natural Language Function Generation: Developers can describe the desired functionality using natural language, and the AI Code Assistant will generate entire functions based on that description. This capability bridges the gap between concept and implementation, allowing developers to prototype ideas or tackle complex coding challenges quickly.
- Code Refactoring and Debugging: Harness helps improve code quality by offering refactoring suggestions and helping identify and resolve bugs. This proactive approach to code improvement can lead to more robust and maintainable codebases.
- Interactive Code Explanation: An intuitive chatbot feature allows developers to ask questions about specific pieces of code and receive clear explanations that enhance understanding and facilitate knowledge sharing within teams.
- Semantic Search: When integrated with the Harness Code Repository, the AI Code Assistant enables powerful semantic search capabilities using natural language queries. This feature is particularly valuable for quickly navigating and understanding complex repositories, making it easier for new team members to onboard and for experienced developers to explore unfamiliar parts of the codebase.
- Pull Request Generation: The AI Code Assistant frees up valuable developer time by taking care of routine tasks like generating pull request comments, allowing teams to focus on high-value activities that drive innovation and product improvement.
The Harness AI Code Assistant is more than just a coding tool; it's a comprehensive solution that enhances developer productivity, improves code quality, and fosters a more efficient and collaborative development environment. The AI Code Assistant is available today for all Harness customers at no additional charge.
Embracing the AI-Powered Future of Software Delivery
Software delivery is changing fast. Generative AI has helped organizations code faster than ever. The rest of the delivery pipeline must keep up to take full advantage of these efficiencies.
These tools - the Harness AI QA Assistant, AI DevOps Assistant, and AI Code Assistant represent more than just technological advancements. They embody a shift in how we approach software development, testing, and delivery. By automating routine tasks, providing intelligent assistance, and offering deep insights into development processes, these AI agents eliminate toil, freeing up human creativity and expertise to focus on solving complex problems and driving innovation.
As we move forward, the integration of AI into software delivery processes will become increasingly crucial for organizations looking to maintain a competitive edge. The ability to deliver high-quality software faster, more reliably, and with greater insight will be a key differentiator in the digital marketplace.
Harness is committed to leading this AI-driven transformation of the software delivery landscape. We invite you to join us on this exciting journey toward a future where AI and human expertise work in harmony to create exceptional software experiences.
Stay tuned for more updates as we continue to innovate and shape the future of software delivery. If you want to try any of these capabilities early, sign up here.
Checkout Event: Revolutionizing Software Testing with AI
Checkout Harness AI Code Agent
Explore more resources: 3 Ways to Optimize Software Delivery and Operational Efficiency

Introducing Harness AI Productivity Insights
AI-based coding Assistants like Google Gemini Code Assist, GitHub Copilot, and others are becoming increasingly popular. However, the efficacy of these tools is still unknown. Engineering leaders want to understand how effective these tools are and how much they should invest in them.
Harness AI Productivity Insights
Harness AI Productivity Insights is a new (beta) capability in Software Engineering Insights that helps engineering leaders understand the productivity gains unlocked by leveraging AI coding tools.
This targeted solution empowers engineering leaders to generate comprehensive comparison reports across diverse developer cohorts. It facilitates insightful analyses, such as evaluating the impact of AI Coding Tools on productivity by comparing developers who leverage these tools against those who don't. Additionally, it allows for comparisons between different points in time, tracking how developers' performance evolves as they adopt and grow their proficiency with AI Coding tools.
- Assess the productivity impact of AI Coding Tools used in your organization
- One-click integration with your Source Code Management systems to unlock metrics across velocity and quality
- Productivity analysis across diverse developer cohorts
- Analyze productivity differences between developers utilizing AI Coding Tools and those who are not
- Conduct Developer Experience Surveys to capture qualitative data on the impact of AI Coding Tools
A Closer Look at AI Productivity Insights

Customers can choose different types of comparison reports. The most common reports are comparing cohorts of developers who use coding assistants and those who don’t. Other supported types of comparison reports include comparing cohorts of developers with different metadata, for example senior engineers versus junior engineers, or comparing the same set of developers at different points in time.
For every report, customers can flexibly define the comparison cohorts either through manual selection or by utilizing existing metadata filters.

Customers can run multiple reports at any time. Reports will be saved and available to share within the organization.

Each report analyzes the productivity scores of both cohorts, calculating the productivity gain of the second cohort relative to the first. The analysis encompasses various facets of performance, including velocity and quality metrics. Additionally, the solution offers the option to gather qualitative insights through surveys distributed to all cohort members, enriching the quantitative data with user feedback.

Data Sources
AI Productivity Insights relies on source code management (SCM) systems for metrics collection. Customers can seamlessly integrate their preferred SCM platforms through convenient one-click integrations. To gain insights into AI Coding Tool usage, the solution also offers one-click integrations with these tools, enabling comprehensive data collection and analysis across the development ecosystem.
Interested to learn more?
Let us know you are interested. We'd love to show you more and hear your feedback.