Featured Blogs

- Harness IaCM introduces native Terragrunt support, enabling true enterprise-grade orchestration at scale.
- Teams can now manage Terraform, OpenTofu, and Terragrunt in a single platform without fragmented tooling.
- Built-in governance, policy enforcement, and approvals streamline secure infrastructure operations.
- End-to-end visibility and drift detection improve reliability across complex, multi-environment deployments.
- The launch marks a major step toward a unified, multi-IaC control plane for modern infrastructure teams.
Bringing First-Class Terragrunt Support to IaCM
“We’ve been operating in a hybrid environment with both OpenTofu and Terragrunt, and Harness has made it much easier to bring those workflows together into a single, consistent platform with IaCM. The addition of Terragrunt support is a valuable step toward simplifying how we manage infrastructure at scale.”
— Lead Platform Engineer, Enterprise Customer
Infrastructure as Code is now a standard for modern cloud operations, with most enterprises using IaC to provision and manage environments. However, as adoption grows, so does complexity. Teams are no longer managing a handful of environments. They are operating across multiple regions, accounts, and services, often at massive scale.
This is where traditional approaches begin to fall short.
As organizations scale their infrastructure, Terraform alone is often not enough. Teams adopt Terragrunt to manage complex, multi-environment deployments, but they are often forced to stitch together fragmented tooling that lacks visibility, governance, and consistency.
At Harness, we are changing that.
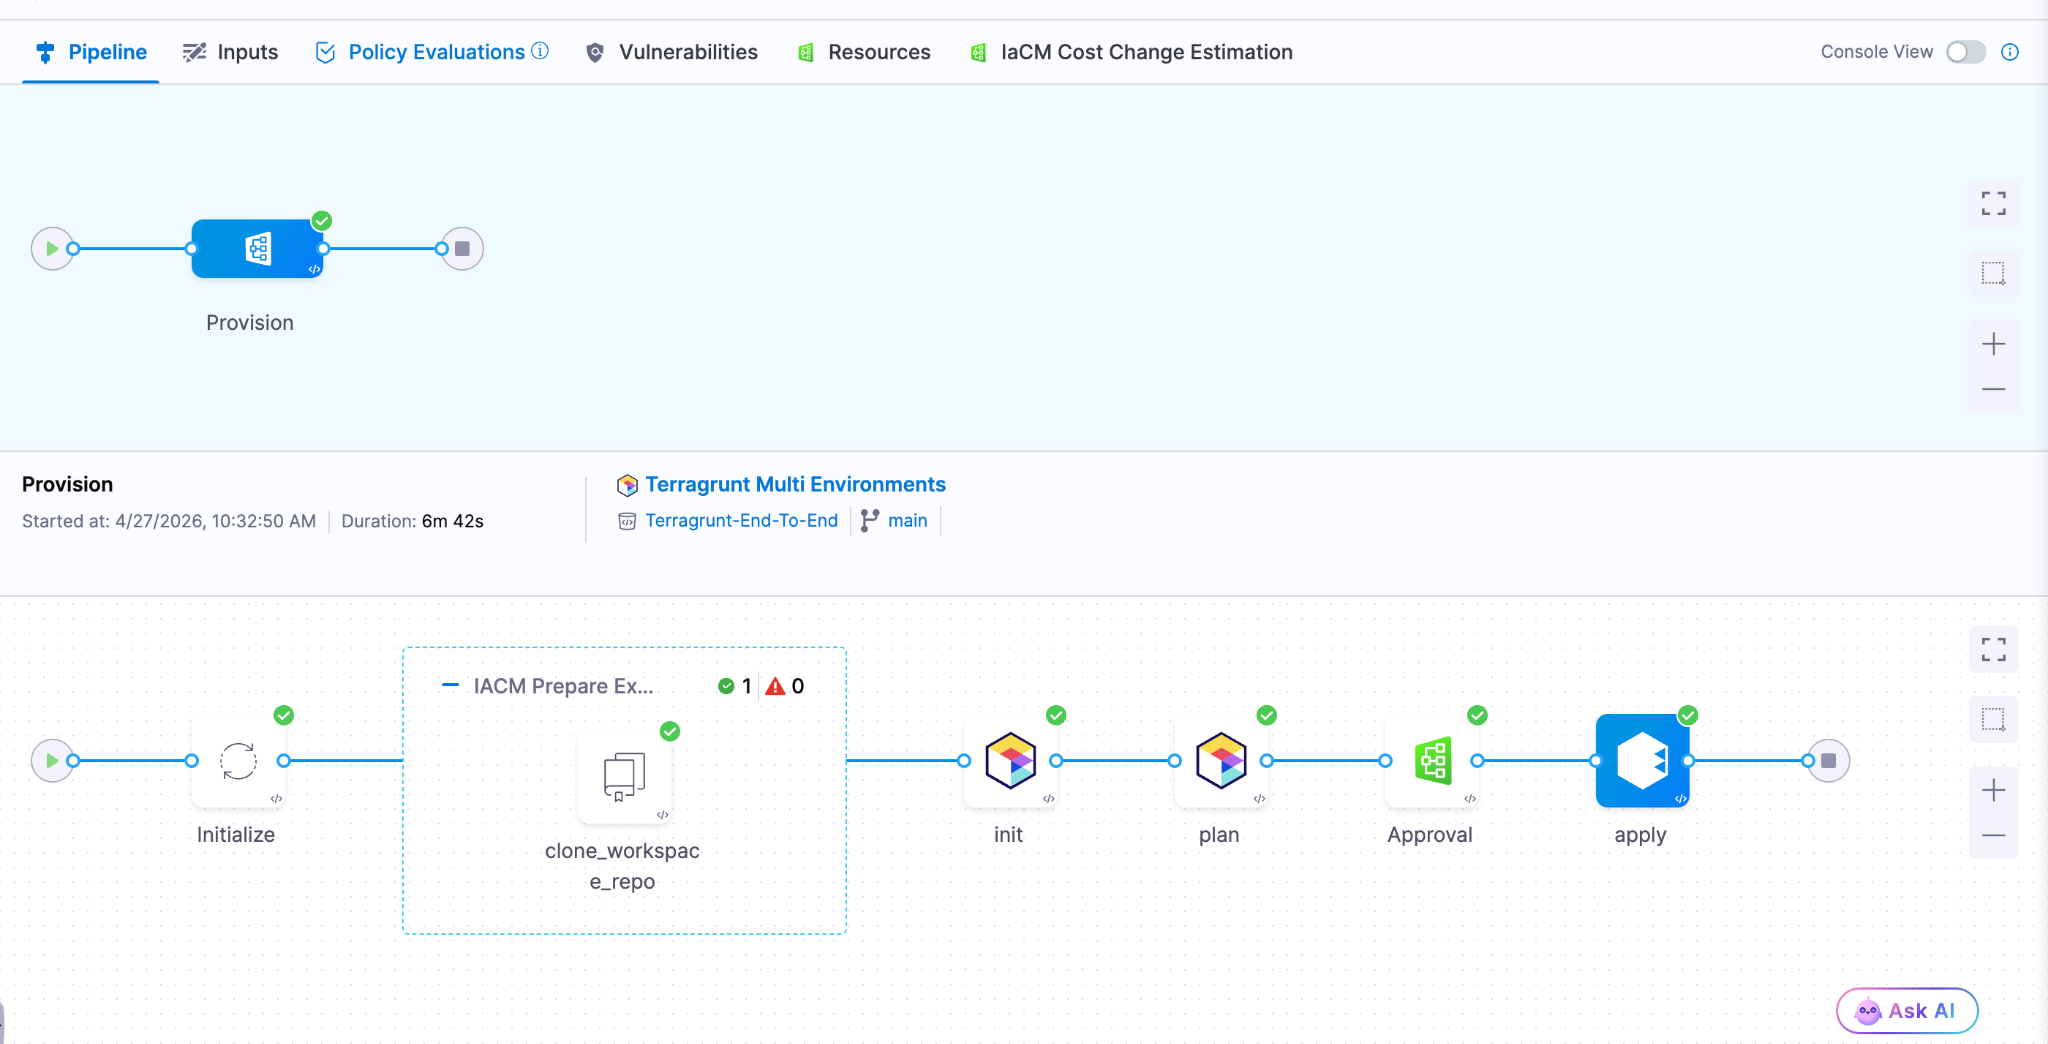
Today, we are excited to announce native Terragrunt support in Harness IaCM, bringing it to full parity with Terraform and OpenTofu while delivering capabilities that go beyond what is available in standalone tooling. This is more than support. It is about making Terragrunt a first-class platform for enterprise infrastructure management.
With Harness IaCM, teams can now:
- Orchestrate complex Terragrunt environments with full visibility across all units
- Apply cost estimation, approvals, and policy enforcement natively
- Detect and manage drift across environments with granular insights
- View infrastructure changes at the resource level across orchestrated deployments
Terragrunt has become a critical layer for managing infrastructure at scale because it simplifies how teams structure and reuse configurations across environments. Harness builds on that foundation with deep, native integration, enabling platform teams to operate with both flexibility and control.
This is especially important for enterprises where a single deployment spans multiple environments and services. Harness abstracts that complexity while maintaining governance, auditability, and consistency.
Extending IaCM to a Multi-IaC Future
Terragrunt is part of a broader shift toward multi-tool infrastructure strategies.
Modern teams are no longer standardized on a single IaC tool. Instead, they operate across:
- Terraform and OpenTofu for provisioning
- Terragrunt for orchestration
- CDK for developer-driven infrastructure
- Ansible for configuration and automation

This creates challenges around consistency, visibility, and governance. Harness IaCM is built for this reality. We are evolving IaCM into a unified control plane for multi-IaC workflows, where teams can manage different frameworks with a consistent experience, shared policies, and centralized visibility.
This means:
- Eliminating fragmented pipelines across tools
- Standardizing governance across environments
- Gaining full visibility into infrastructure state and changes
Instead of managing infrastructure in silos, teams can now operate from a single platform across the entire lifecycle.
What’s Next for Infrastructure as Code?
The next phase of Infrastructure as Code is not just about supporting more tools. It is about making infrastructure systems more intelligent and automated.
We are investing in two key areas:
Expanded IaC Support
We are continuing to support modern frameworks like AWS CDK, enabling developer-centric infrastructure workflows alongside provisioning, configuration, and orchestration tools.
AI-Driven Automation
We are introducing intelligence into IaC workflows to simplify tasks such as drift management and optimization. This helps teams reduce manual effort and operate more efficiently at scale.
Together, these investments move IaCM toward a unified, multi-IaC platform that combines flexibility, governance, and automation. Terragrunt has become essential for managing infrastructure at scale but until now, it hasn’t had a platform that truly supports it. As infrastructure continues to grow in complexity, our focus remains the same. Helping teams move faster, reduce risk, and scale with confidence no matter which IaC tools they use.
.png)
We’ve come a long way in how we build and deliver software. Continuous Integration (CI) is automated, Continuous Delivery (CD) is fast, and teams can ship code quickly and often. But environments are still messy.
Shared staging systems break when too many teams deploy at once, while developers wait on infrastructure changes. Test environments get created and forgotten, but over time, what is running in the cloud stops matching what was written in code.
We have made deployments smooth and reliable, but managing environments still feels manual and unpredictable. That gap has quietly become one of the biggest slowdowns in modern software delivery.
This is the hidden bottleneck in platform engineering, and it's a challenge enterprise teams are actively working to solve.
As Steve Day, Enterprise Technology Executive at National Australia Bank, shared:
“As we’ve scaled our engineering focus, removing friction has been critical to delivering better outcomes for our customers and colleagues. Partnering with Harness has helped us give teams self-service access to environments directly within their workflow, so they can move faster and innovate safely, while still meeting the security and governance expectations of a regulated bank.”
At Harness, Environment Management is a first-class capability inside our Internal Developer Portal. It transforms environments from manual, ticket-driven assets into governed, automated systems that are fully integrated with Harness Continuous Delivery and Infrastructure as Code Management (IaCM).
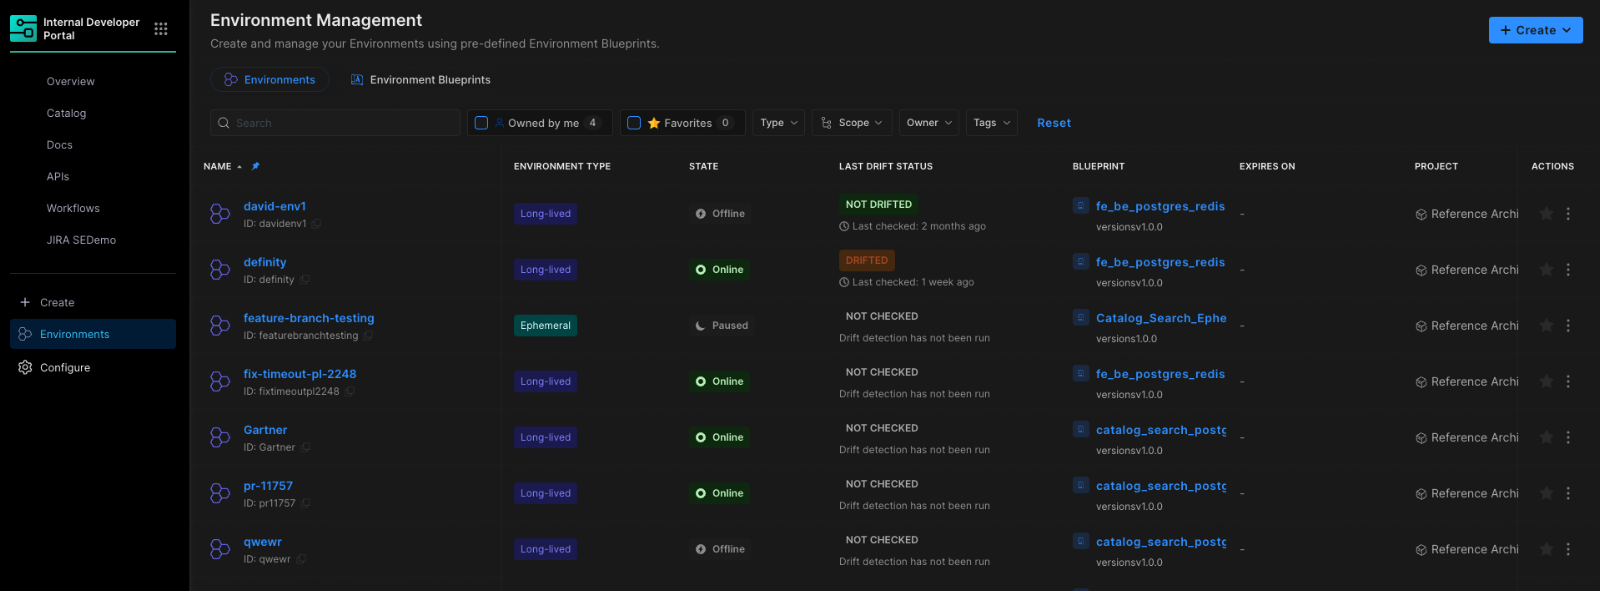
This is not another self-service workflow. It is environment lifecycle management built directly into the delivery platform.
The result is faster delivery, stronger governance, and lower operational overhead without forcing teams to choose between speed and control.
Closing the Gap Between CD and IaC
Continuous Delivery answers how code gets deployed. Infrastructure as Code defines what infrastructure should look like. But the lifecycle of environments has often lived between the two.
Teams stitch together Terraform projects, custom scripts, ticket queues, and informal processes just to create and update environments. Day two operations such as resizing infrastructure, adding services, or modifying dependencies require manual coordination. Ephemeral environments multiply without cleanup. Drift accumulates unnoticed.
The outcome is familiar: slower innovation, rising cloud spend, and increased operational risk.
Environment Management closes this gap by making environments real entities within the Harness platform. Provisioning, deployment, governance, and visibility now operate within a single control plane.
Harness is the only platform that unifies environment lifecycle management, infrastructure provisioning, and application delivery under one governed system.
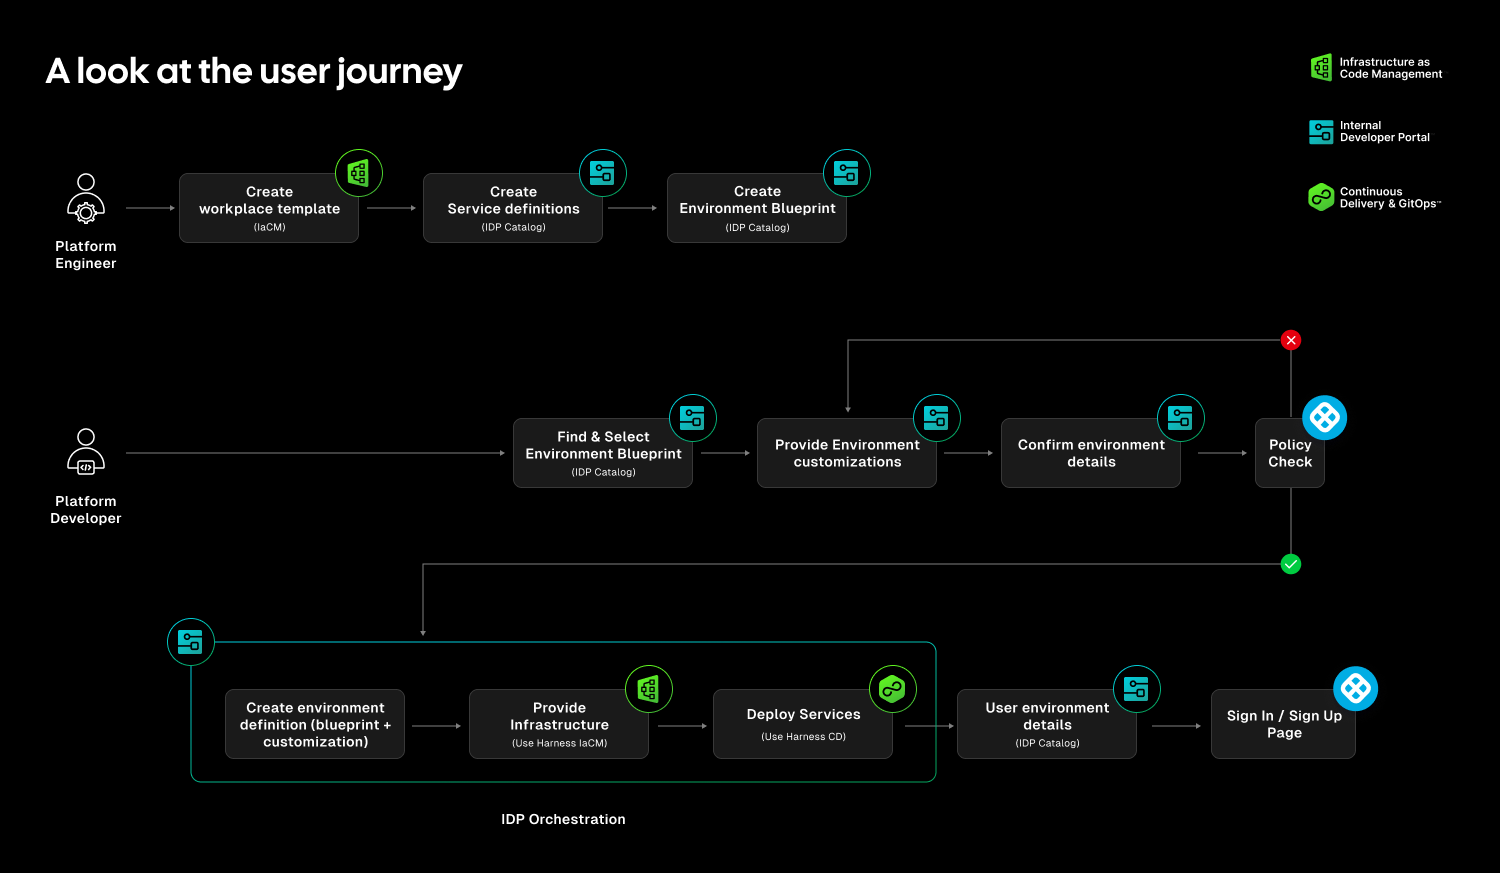
Blueprint-Driven by Design
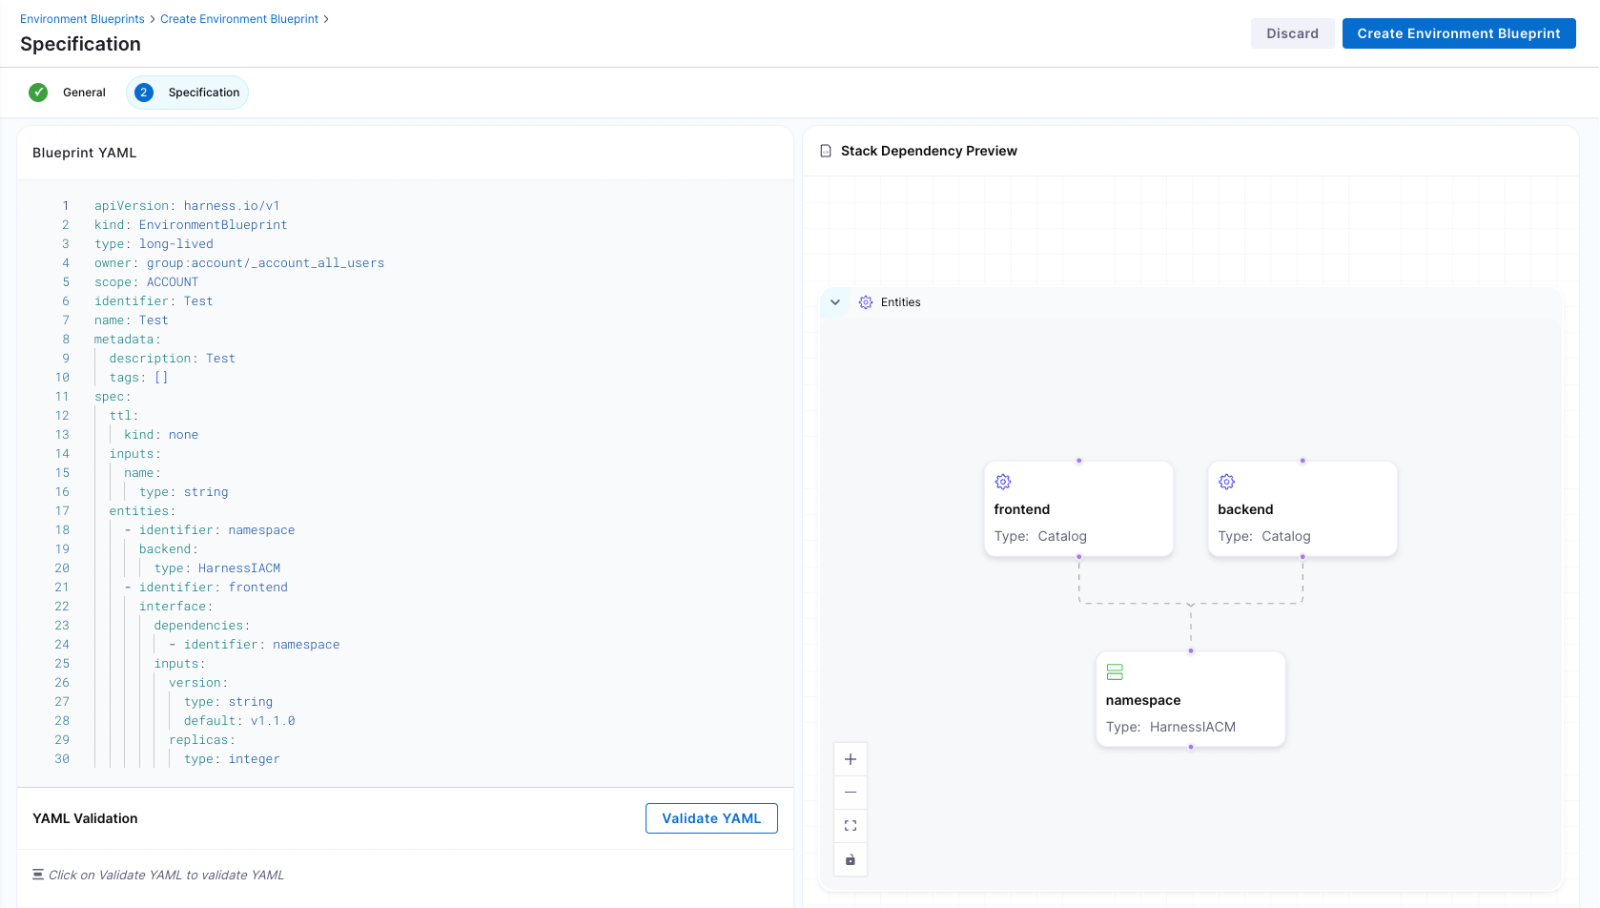
At the center of Environment Management are Environment Blueprints.
Platform teams define reusable, standardized templates that describe exactly what an environment contains. A blueprint includes infrastructure resources, application services, dependencies, and configurable inputs such as versions or replica counts. Role-based access control and versioning are embedded directly into the definition.
Developers consume these blueprints from the Internal Developer Portal and create production-like environments in minutes. No tickets. No manual stitching between infrastructure and pipelines. No bypassing governance to move faster.
Consistency becomes the default. Governance is built in from the start.
Full Lifecycle Control
Environment Management handles more than initial provisioning.
Infrastructure is provisioned through Harness IaCM. Services are deployed through Harness CD. Updates, modifications, and teardown actions are versioned, auditable, and governed within the same system.
Teams can define time-to-live policies for ephemeral environments so they are automatically destroyed when no longer needed. This reduces environment sprawl and controls cloud costs without slowing experimentation.
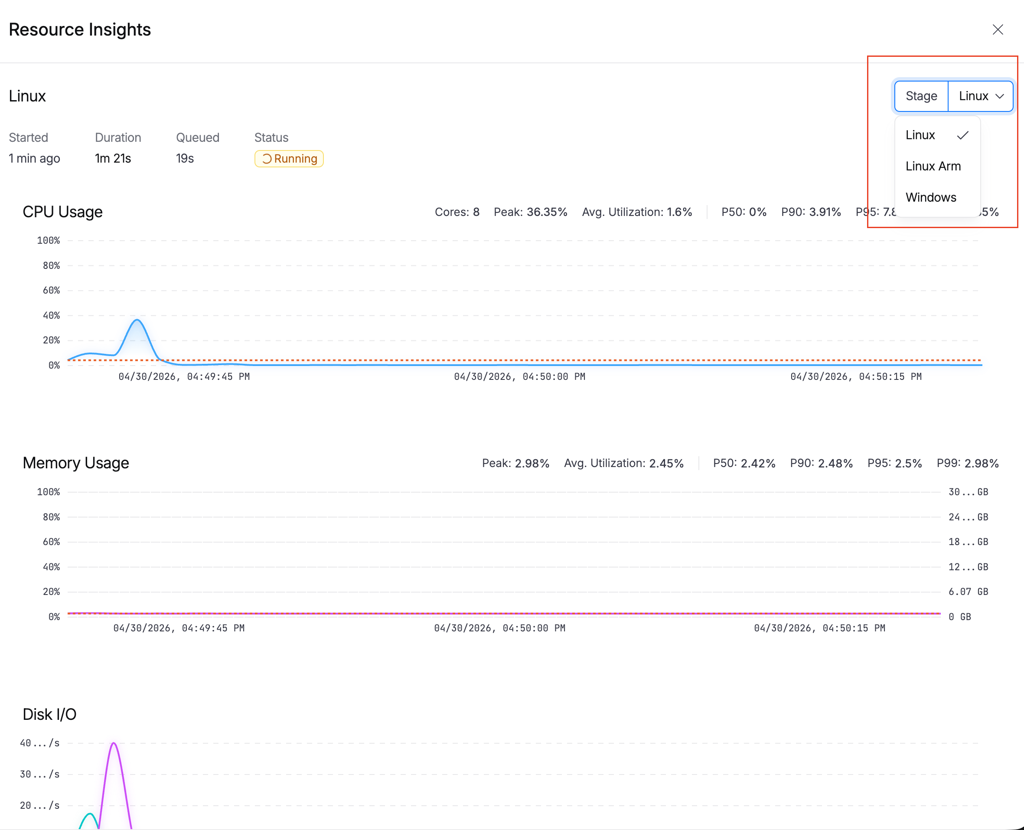
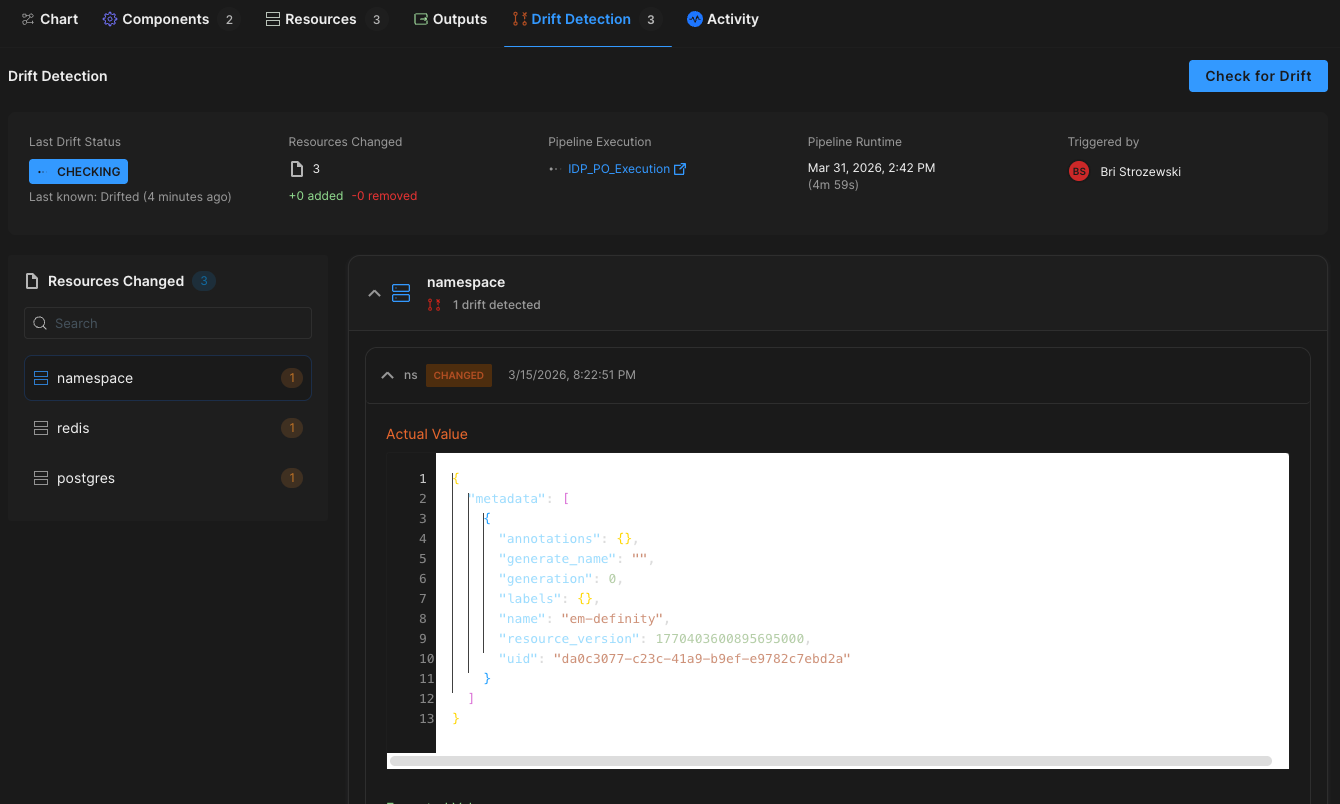
Harness EM also introduces drift detection. As environments evolve, unintended changes can occur outside declared infrastructure definitions. Drift detection provides visibility into differences between the blueprint and the running environment, allowing teams to detect issues early and respond appropriately. In regulated industries, this visibility is essential for auditability and compliance.
Governance Built In
For enterprises operating at scale, self-service without control is not viable.
Environment Management leverages Harness’s existing project and organization hierarchy, role-based access control, and policy framework. Platform teams can control who creates environments, which blueprints are available to which teams, and what approvals are required for changes. Every lifecycle action is captured in an audit trail.
This balance between autonomy and oversight is critical. Environment Management delivers that balance. Developers gain speed and independence, while enterprises maintain the governance they require.
"Our goal is to make environment creation a simple, single action for developers so they don't have to worry about underlying parameters or pipelines. By moving away from spinning up individual services and using standardized blueprints to orchestrate complete, production-like environments, we remove significant manual effort while ensuring teams only have control over the environments they own."
— Dinesh Lakkaraju, Senior Principal Software Engineer, Boomi
From Portal to Platform
Environment Management represents a shift in how internal developer platforms are built.
Instead of focusing solely on discoverability or one-off self-service actions, it brings lifecycle control, cost governance, and compliance directly into the developer workflow.
Developers can create environments confidently. Platform engineers can encode standards once and reuse them everywhere. Engineering leaders gain visibility into cost, drift, and deployment velocity across the organization.
Environment sprawl and ticket-driven provisioning do not have to be the norm. With Environment Management, environments become governed systems, not manual processes. And with CD, IaCM, and IDP working together, Harness is turning environment control into a core platform capability instead of an afterthought.
This is what real environment management should look like.
Over the last few years, something fundamental has changed in software development.
If the early 2020s were about adopting AI coding assistants, the next phase is about what happens after those tools accelerate development. Teams are producing code faster than ever. But what I’m hearing from engineering leaders is a different question:
What’s going to break next?
That question is exactly what led us to commission our latest research, State of DevOps Modernization 2026. The results reveal a pattern that many practitioners already sense intuitively: faster code generation is exposing weaknesses across the rest of the software delivery lifecycle.
In other words, AI is multiplying development velocity, but it’s also revealing the limits of the systems we built to ship that code safely.
The Emerging “Velocity Paradox”
One of the most striking findings in the research is something we’ve started calling the AI Velocity Paradox - a term we coined in our 2025 State of Software Engineering Report.
Teams using AI coding tools most heavily are shipping code significantly faster. In fact, 45% of developers who use AI coding tools multiple times per day deploy to production daily or faster, compared to 32% of daily users and just 15% of weekly users.
At first glance, that sounds like a huge success story. Faster iteration cycles are exactly what modern software teams want.
But the data tells a more complicated story.
Among those same heavy AI users:
- 69% report frequent deployment problems when AI-generated code is involved
- Incident recovery times average 7.6 hours, longer than for teams using AI less frequently
- 47% say manual downstream work, QA, validation, remediation has become more problematic
What this tells me is simple: AI is speeding up the front of the delivery pipeline, but the rest of the system isn’t scaling with it. It’s like we are running trains faster than the tracks they are built for. Friction builds, the ride is bumpy, and it seems we could be on the edge of disaster.

The result is friction downstream, more incidents, more manual work, and more operational stress on engineering teams.
Why the Delivery System Is Straining
To understand why this is happening, you have to step back and look at how most DevOps systems actually evolved.
Over the past 15 years, delivery pipelines have grown incrementally. Teams added tools to solve specific problems: CI servers, artifact repositories, security scanners, deployment automation, and feature management. Each step made sense at the time.
But the overall system was rarely designed as a coherent whole.
In many organizations today, quality gates, verification steps, and incident recovery still rely heavily on human coordination and manual work. In fact, 77% say teams often have to wait on other teams for routine delivery tasks.
That model worked when release cycles were slower.
It doesn’t work as well when AI dramatically increases the number of code changes moving through the system.
Think of it this way: If AI doubles the number of changes engineers can produce, your pipelines must either:
- cut the risk of each change in half, or
- detect and resolve failures much faster.
Otherwise, the system begins to crack under pressure. The burden often falls directly on developers to help deploy services safely, certify compliance checks, and keep rollouts continuously progressing. When failures happen, they have to jump in and remediate at whatever hour.
These manual tasks, naturally, inhibit innovation and cause developer burnout. That’s exactly what the research shows.
Across respondents, developers report spending roughly 36% of their time on repetitive manual tasks like chasing approvals, rerunning failed jobs, or copy-pasting configuration.
As delivery speed increases, the operational load increases. That burden often falls directly on developers.
What Organizations Should Do Next
The good news is that this problem isn’t mysterious. It’s a systems problem. And systems problems can be solved.
From our experience working with engineering organizations, we've identified a few principles that consistently help teams scale AI-driven development safely.
1. Standardize delivery foundations
When every team builds pipelines differently, scaling delivery becomes difficult.
Standardized templates (or “golden paths”) make it easier to deploy services safely and consistently. They also dramatically reduce the cognitive load for developers.
2. Automate quality and security checks earlier
Speed only works when feedback is fast.
Automating security, compliance, and quality checks earlier in the lifecycle ensures problems are caught before they reach production. That keeps pipelines moving without sacrificing safety.
3. Build guardrails into the release process
Feature flags, automated rollbacks, and progressive rollouts allow teams to decouple deployment from release. That flexibility reduces the blast radius of new changes and makes experimentation safer.
It also allows teams to move faster without increasing production risk.
4. Remember measurement, not just automation
Automation alone doesn’t solve the problem. What matters is creating a feedback loop: deploy → observe → measure → iterate.
When teams can measure the real-world impact of changes, they can learn faster and improve continuously.
The Next Phase of AI in Software Delivery
AI is already changing how software gets written. The next challenge is changing how software gets delivered.
Coding assistants have increased development teams' capacity to innovate. But to capture the full benefit, the delivery systems behind them must evolve as well.
The organizations that succeed in this new environment will be the ones that treat software delivery as a coherent system, not just a collection of tools.
Because the real goal isn’t just writing code faster. It’s learning faster, delivering safer, and turning engineering velocity into better outcomes for the business.
And that requires modernizing the entire pipeline, not just the part where code is written.