Featured Blogs

Today, we're thrilled to announce a significant leap forward in our commitment to AI-driven innovation. Harness, a leader in AI-native software delivery, is proud to introduce three powerful AI agents designed to transform how teams create, test, and deliver software.
Since introducing Continuous Verification in 2018, Harness has been at the forefront of leveraging AI and machine learning to enhance software delivery processes. Our latest announcement reinforces our position as an industry pioneer, offering a comprehensive suite of AI-powered tools that address critical challenges across the entire software delivery lifecycle (SDLC).
Our vision is a multi-agent architecture embedded directly into the fabric of the Harness platform. We’re building a powerful library of ‘assistants’ designed to make software delivery faster, more efficient, and more enjoyable for developers. These AI-driven agents will work seamlessly within our platform, handling everything from automating complex tasks to providing real-time insights, freeing developers to focus on what they do best: creating innovative software.
Let's explore the capabilities of these new AI agents and see how they will reshape the future of software delivery.
AI QA Assistant: End-to-End Test Automation
The Harness AI QA Assistant is a game-changer in the world of software testing. This generative AI agent is purpose-built to simplify end-to-end automation and accelerate the transition from manual to automated testing. End-to-end tests have been plagued by slow authoring experiences that yield brittle tests, which need to be tended to every time the UI changes.

By harnessing the power of AI, this assistant offers a range of benefits that can dramatically improve your testing processes:
- 10x Faster Test Creation: One of the most significant advantages of the AI QA Assistant is its ability to accelerate test creation. Through a generative AI-powered, no-code platform, teams can now create high-quality tests in a fraction of the time it would take to hand-script them. This capability democratizes test creation, enabling team members across various skill levels to contribute to the testing process effectively. Harness will help teams enhance their tests as well. By proactively recommending additional checks and assertions, the assistant makes it easy to improve the depth of your testing.
- 70% Less Test Maintenance: Test maintenance has long been a thorn in the side of QA teams, consuming valuable time and resources. The AI QA Assistant addresses this pain point head-on with AI-driven test execution and self-healing capabilities. The AI understands the intent behind a test. If the UI changes, it will identify the new path to achieving the same intent. By automatically adapting tests to application changes, it minimizes the need for manual maintenance, freeing up your team to focus on more strategic tasks.
- 5x Faster Release Cycles: By eliminating manual testing bottlenecks, the AI QA Assistant paves the way for significantly faster release cycles. Integrating AI-powered automated testing into your CI/CD pipeline streamlines the entire process, allowing you to ship faster and more confidently.
Sign up today for early access to the AI QA Assistant.
AI DevOps Assistant: Better Pipelines Faster
Crafting pipelines can be challenging. You need to consider your core build and deployment activities, as well as best practices around security scans, testing, quality gates, and more. The new Harness AI DevOps Assistant will make creating great pipelines much easier.

- Create Pipelines in Seconds: Gone are the days of spending hours configuring complex pipelines. The AI DevOps Assistant allows you to create comprehensive pipelines in mere seconds. By leveraging AI to understand your application’s requirements and your teams’ preferred tools, policies, and patterns, it can generate optimized pipeline configurations rapidly, saving valuable time and reducing the potential for mistakes.
- Effortless Pipeline Modification with Natural Language: You can also use the DevOps assistant to refine existing pipelines. The AI DevOps Assistant understands natural language commands, allowing you to modify your pipelines effortlessly. Whether you need to add a new stage, adjust deployment parameters, or integrate a new tool, you can simply describe the changes you want, and the assistant will implement them accurately.
- Proactive Suggestions: The DevOps Assistant provides intelligent suggestions to optimize your pipelines. It analyzes your current pipeline configurations against Harness recommended best practices and identifies areas for improvement. These suggestions can help reduce build times, enhance reliability, and ensure your pipelines align with industry standards.
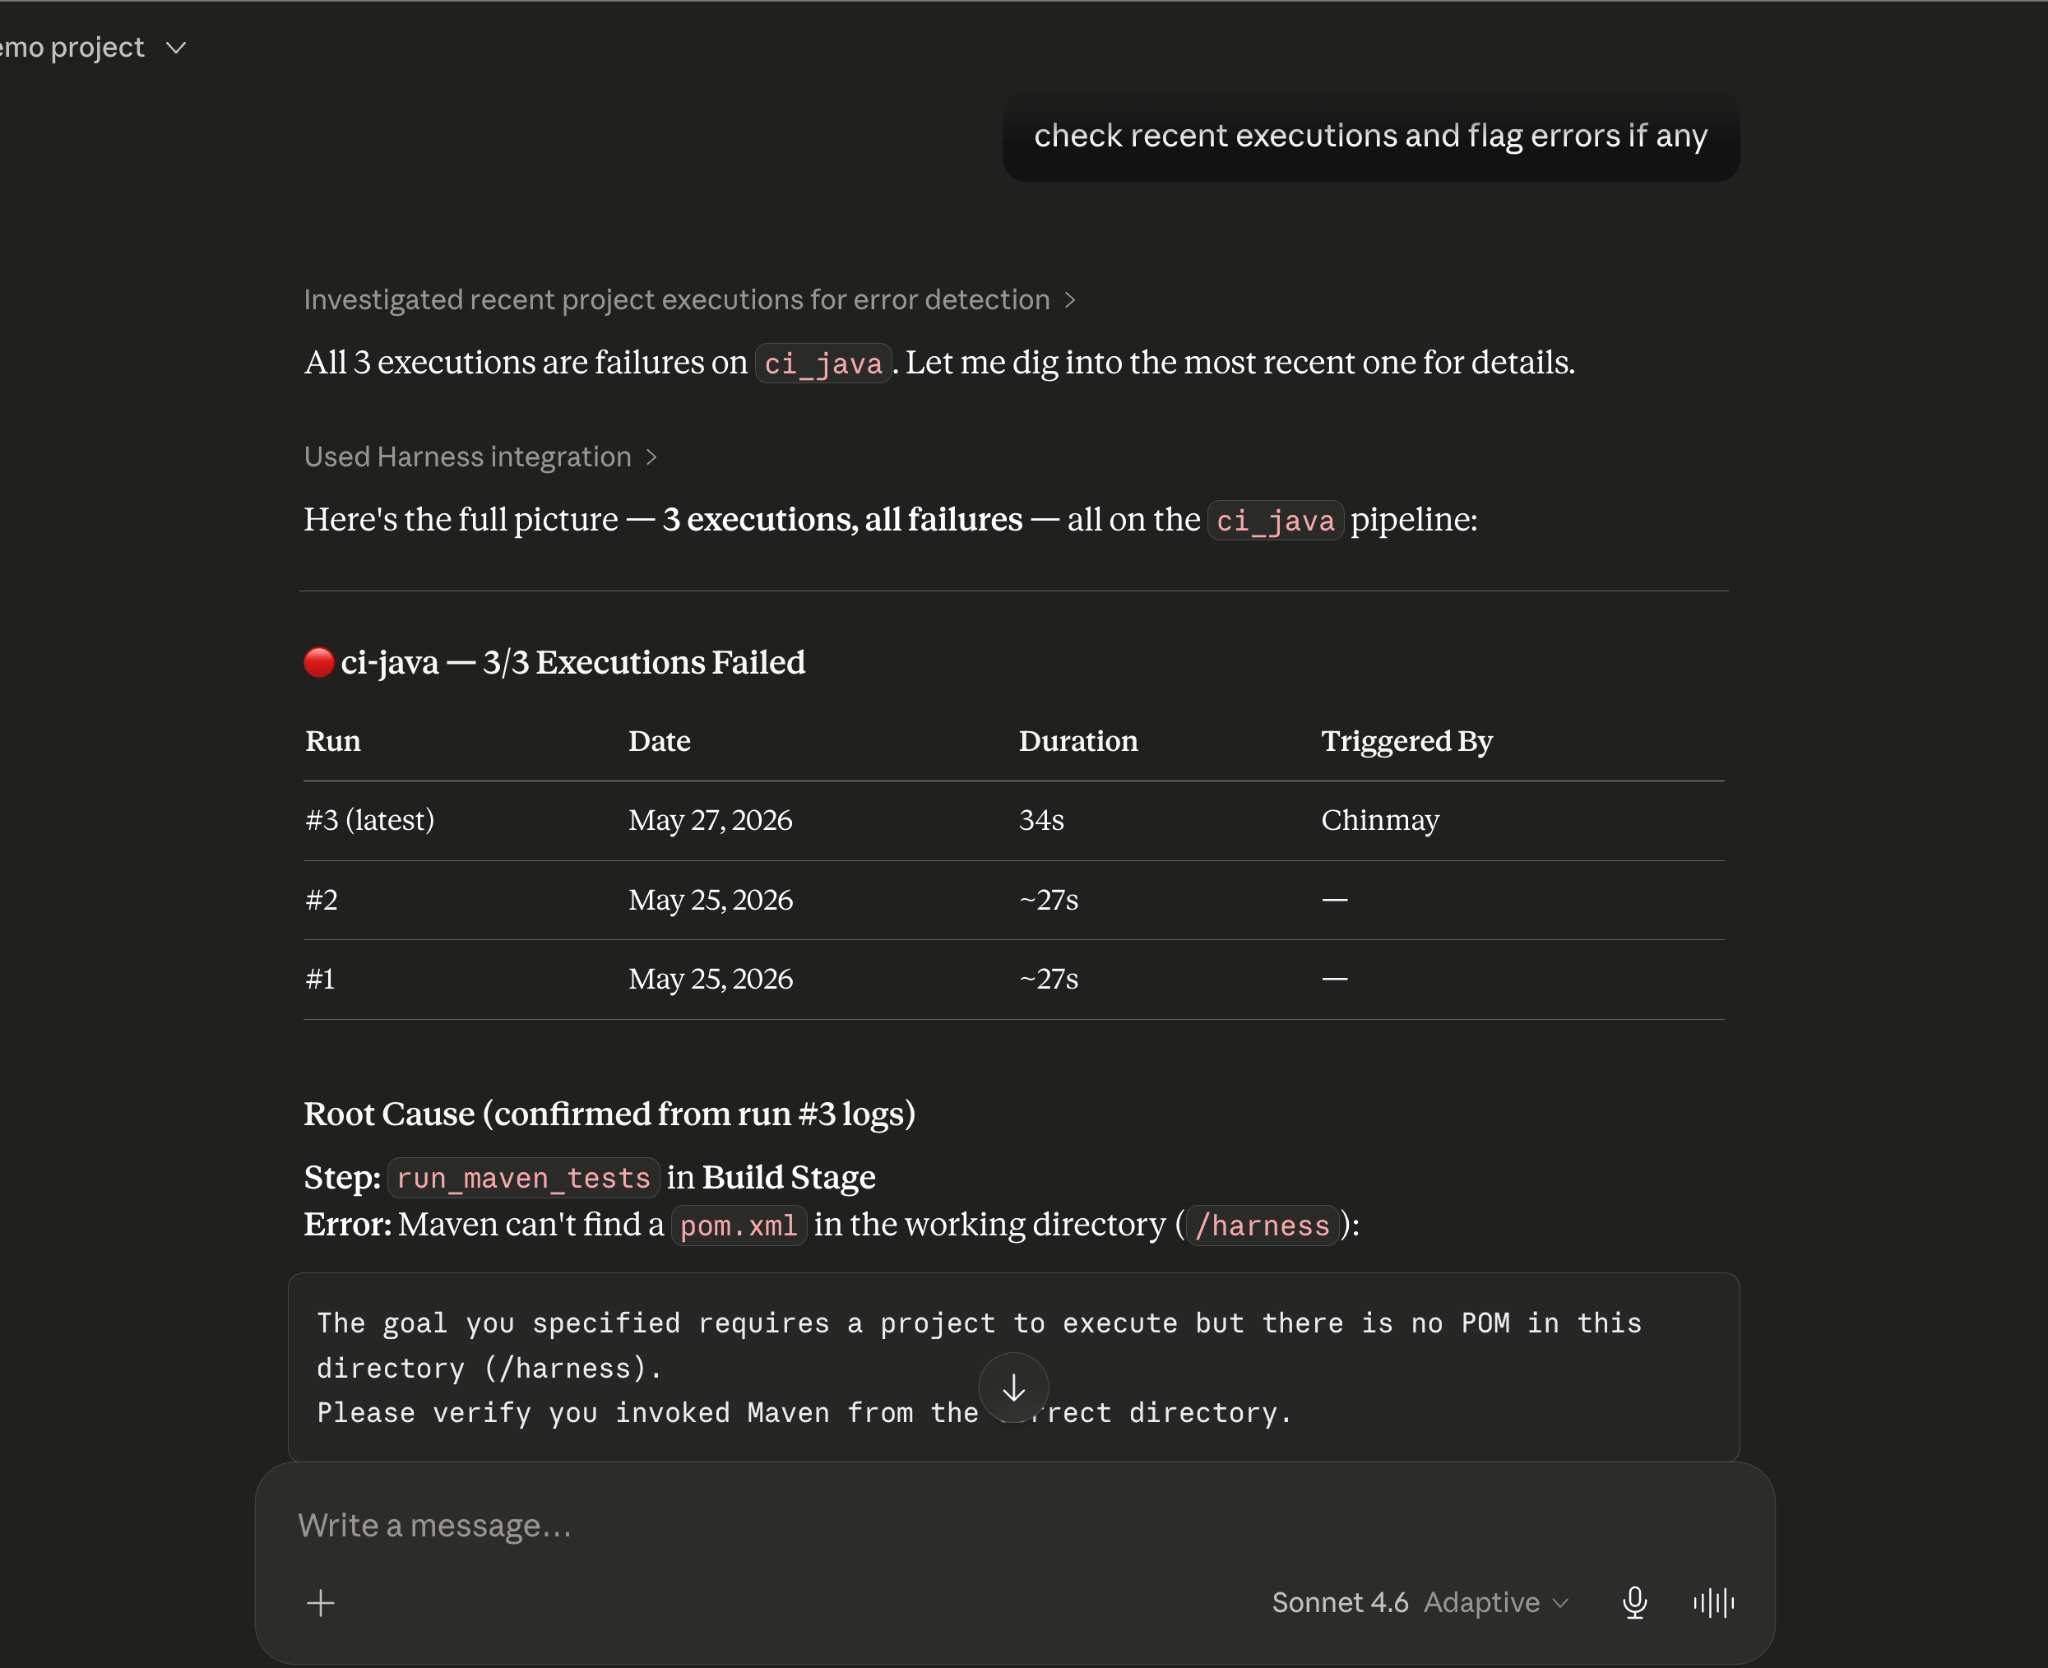
- Automatic Diagnosis and Remediation of Common Failures: Minimizing downtime is crucial. The AI DevOps Assistant excels in this area by automatically diagnosing common pipeline failures and providing immediate remediation steps. This proactive approach to problem-solving can significantly reduce the mean time to recovery (MTTR) for your pipelines, ensuring smoother, more reliable software delivery.
The introduction of the AI DevOps Assistant marks a significant milestone in our mission to simplify and streamline the software delivery process for the world’s developers. By automating complex tasks, and providing intelligent insights, this capability empowers teams to focus on innovation rather than getting bogged down in pipeline management intricacies.
Sign up today for early access to the AI DevOps Assistant.
AI Code Assistant: Boosting Developer Productivity
The Harness AI Code Assistant accelerates developer productivity by streamlining coding processes and providing instant access to relevant information. This intelligent tool integrates seamlessly into the development workflow, offering a range of features that enhance coding efficiency and quality:
- Intelligent Code Completion: As developers write code, the AI Code Assistant recommends relevant code snippets, helping to accelerate the coding process. This feature is particularly useful for repetitive tasks or when working with unfamiliar libraries or frameworks.
- Natural Language Function Generation: Developers can describe the desired functionality using natural language, and the AI Code Assistant will generate entire functions based on that description. This capability bridges the gap between concept and implementation, allowing developers to prototype ideas or tackle complex coding challenges quickly.
- Code Refactoring and Debugging: Harness helps improve code quality by offering refactoring suggestions and helping identify and resolve bugs. This proactive approach to code improvement can lead to more robust and maintainable codebases.
- Interactive Code Explanation: An intuitive chatbot feature allows developers to ask questions about specific pieces of code and receive clear explanations that enhance understanding and facilitate knowledge sharing within teams.
- Semantic Search: When integrated with the Harness Code Repository, the AI Code Assistant enables powerful semantic search capabilities using natural language queries. This feature is particularly valuable for quickly navigating and understanding complex repositories, making it easier for new team members to onboard and for experienced developers to explore unfamiliar parts of the codebase.
- Pull Request Generation: The AI Code Assistant frees up valuable developer time by taking care of routine tasks like generating pull request comments, allowing teams to focus on high-value activities that drive innovation and product improvement.

The Harness AI Code Assistant is more than just a coding tool; it's a comprehensive solution that enhances developer productivity, improves code quality, and fosters a more efficient and collaborative development environment. The AI Code Assistant is available today for all Harness customers at no additional charge.
Embracing the AI-Powered Future of Software Delivery
Software delivery is changing fast. Generative AI has helped organizations code faster than ever. The rest of the delivery pipeline must keep up to take full advantage of these efficiencies.
These tools - the Harness AI QA Assistant, AI DevOps Assistant, and AI Code Assistant represent more than just technological advancements. They embody a shift in how we approach software development, testing, and delivery. By automating routine tasks, providing intelligent assistance, and offering deep insights into development processes, these AI agents eliminate toil, freeing up human creativity and expertise to focus on solving complex problems and driving innovation.
As we move forward, the integration of AI into software delivery processes will become increasingly crucial for organizations looking to maintain a competitive edge. The ability to deliver high-quality software faster, more reliably, and with greater insight will be a key differentiator in the digital marketplace.
Harness is committed to leading this AI-driven transformation of the software delivery landscape. We invite you to join us on this exciting journey toward a future where AI and human expertise work in harmony to create exceptional software experiences.
Stay tuned for more updates as we continue to innovate and shape the future of software delivery. If you want to try any of these capabilities early, sign up here.
Checkout Event: Revolutionizing Software Testing with AI
Checkout Harness AI Code Agent
Explore more resources: 3 Ways to Optimize Software Delivery and Operational Efficiency


.jpg)