Harness Blog
Featured Blogs
.png)
We’ve come a long way in how we build and deliver software. Continuous Integration (CI) is automated, Continuous Delivery (CD) is fast, and teams can ship code quickly and often. But environments are still messy.
Shared staging systems break when too many teams deploy at once, while developers wait on infrastructure changes. Test environments get created and forgotten, but over time, what is running in the cloud stops matching what was written in code.
We have made deployments smooth and reliable, but managing environments still feels manual and unpredictable. That gap has quietly become one of the biggest slowdowns in modern software delivery.
This is the hidden bottleneck in platform engineering, and it's a challenge enterprise teams are actively working to solve.
As Steve Day, Enterprise Technology Executive at National Australia Bank, shared:
“As we’ve scaled our engineering focus, removing friction has been critical to delivering better outcomes for our customers and colleagues. Partnering with Harness has helped us give teams self-service access to environments directly within their workflow, so they can move faster and innovate safely, while still meeting the security and governance expectations of a regulated bank.”
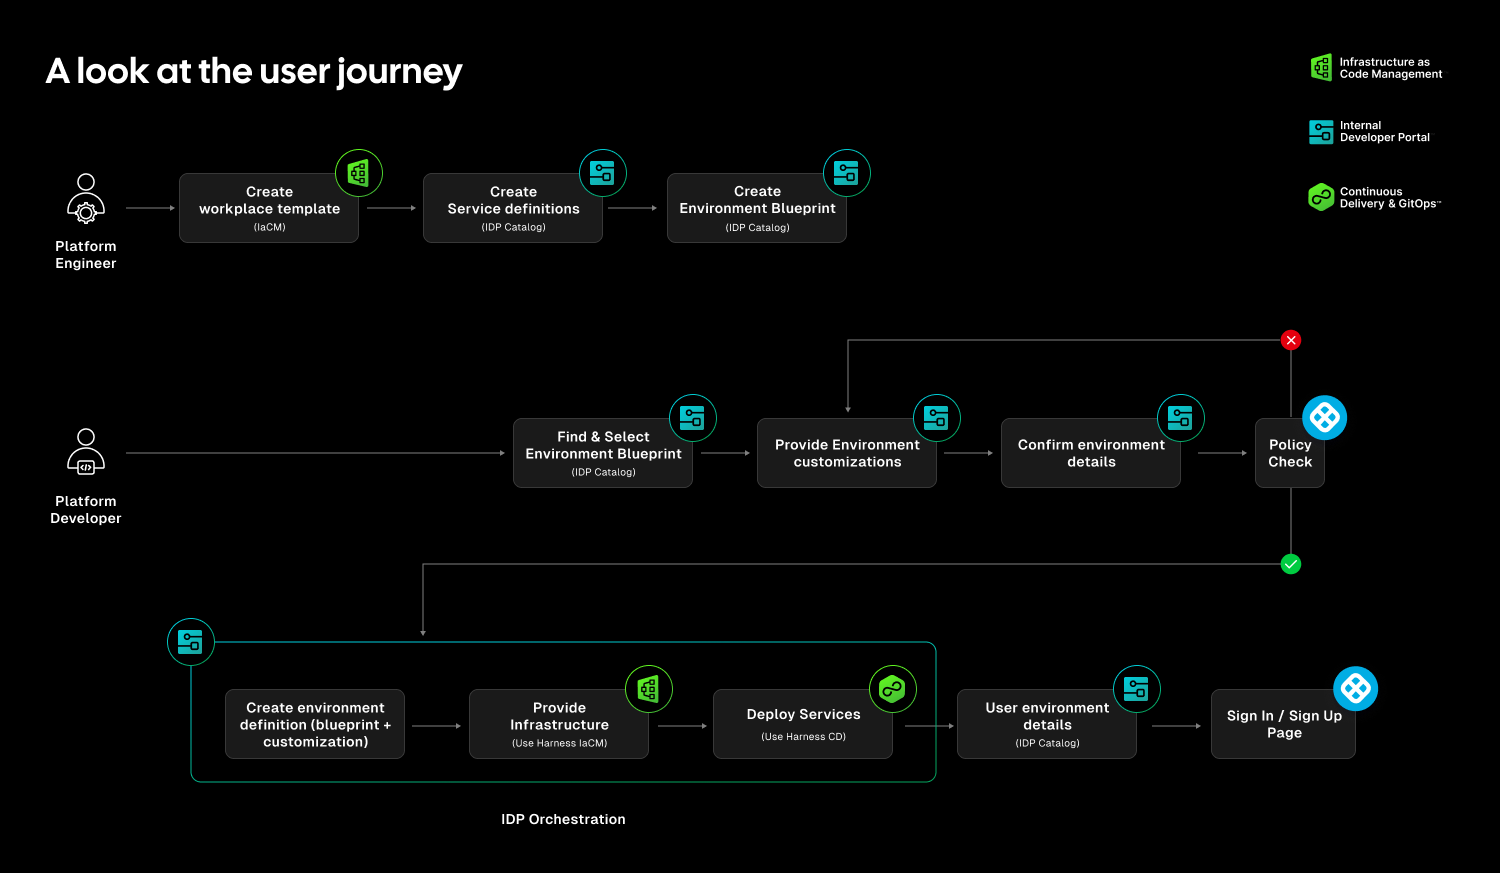
At Harness, Environment Management is a first-class capability inside our Internal Developer Portal. It transforms environments from manual, ticket-driven assets into governed, automated systems that are fully integrated with Harness Continuous Delivery and Infrastructure as Code Management (IaCM).
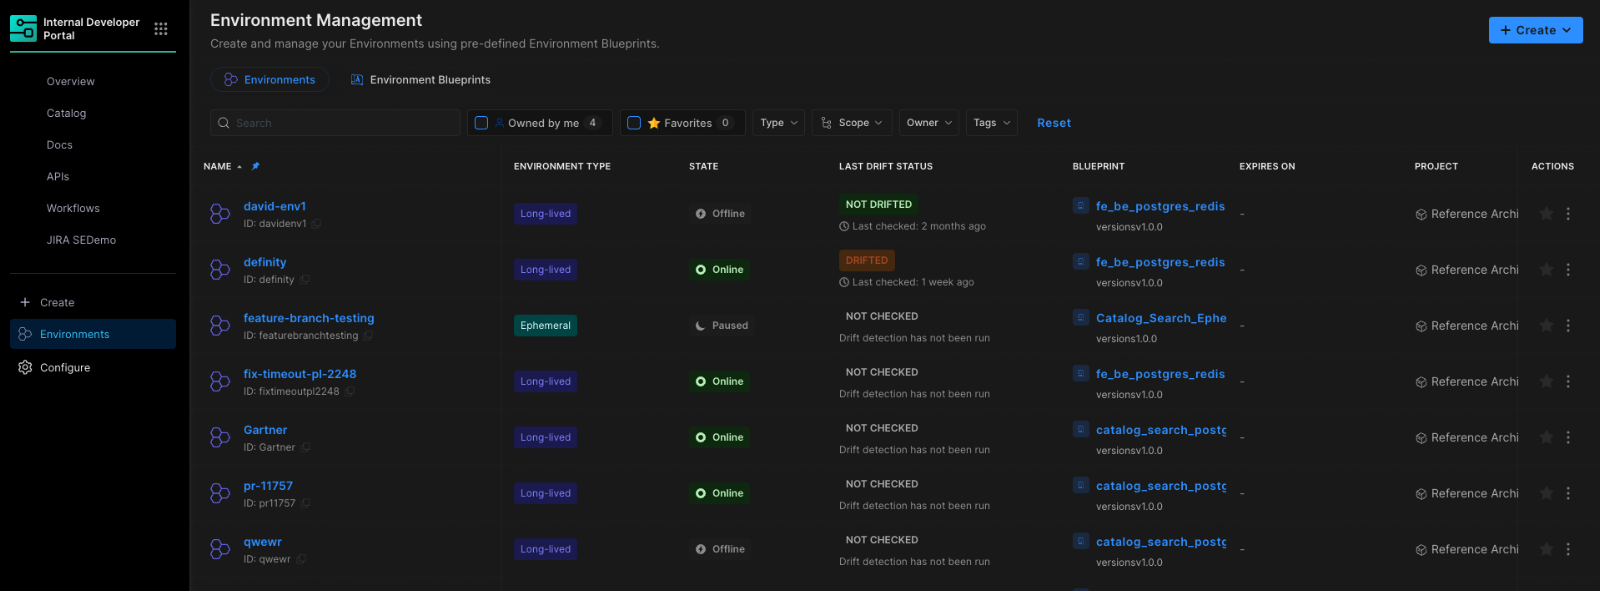
This is not another self-service workflow. It is environment lifecycle management built directly into the delivery platform.
The result is faster delivery, stronger governance, and lower operational overhead without forcing teams to choose between speed and control.
Closing the Gap Between CD and IaC
Continuous Delivery answers how code gets deployed. Infrastructure as Code defines what infrastructure should look like. But the lifecycle of environments has often lived between the two.
Teams stitch together Terraform projects, custom scripts, ticket queues, and informal processes just to create and update environments. Day two operations such as resizing infrastructure, adding services, or modifying dependencies require manual coordination. Ephemeral environments multiply without cleanup. Drift accumulates unnoticed.
The outcome is familiar: slower innovation, rising cloud spend, and increased operational risk.
Environment Management closes this gap by making environments real entities within the Harness platform. Provisioning, deployment, governance, and visibility now operate within a single control plane.
Harness is the only platform that unifies environment lifecycle management, infrastructure provisioning, and application delivery under one governed system.
Blueprint-Driven by Design
At the center of Environment Management are Environment Blueprints.
Platform teams define reusable, standardized templates that describe exactly what an environment contains. A blueprint includes infrastructure resources, application services, dependencies, and configurable inputs such as versions or replica counts. Role-based access control and versioning are embedded directly into the definition.
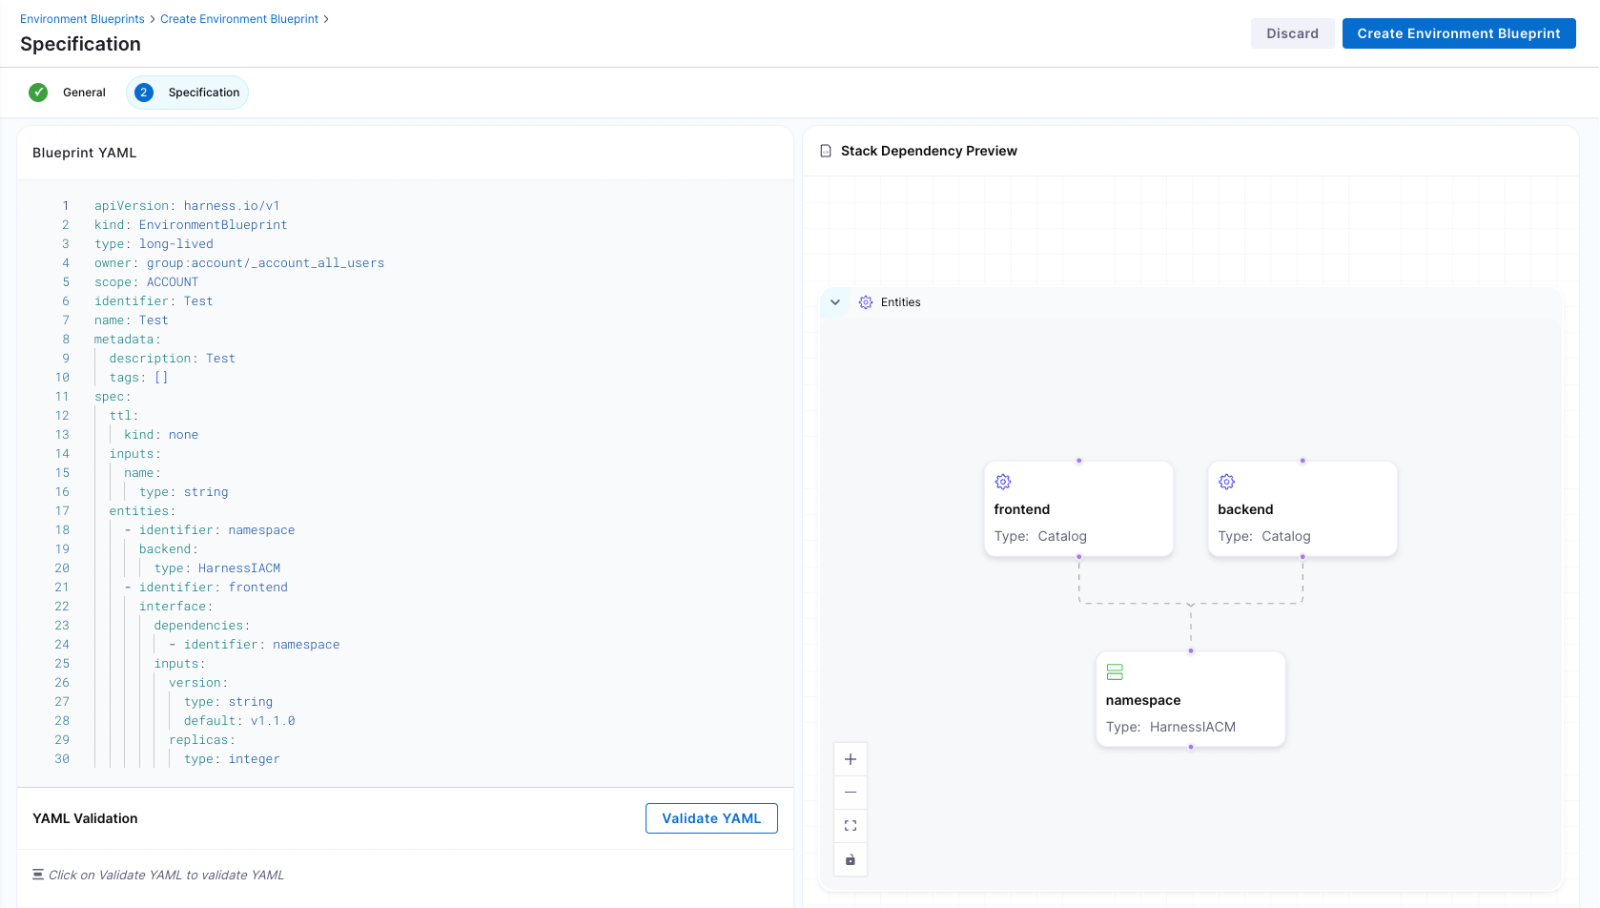
Developers consume these blueprints from the Internal Developer Portal and create production-like environments in minutes. No tickets. No manual stitching between infrastructure and pipelines. No bypassing governance to move faster.
Consistency becomes the default. Governance is built in from the start.
Full Lifecycle Control
Environment Management handles more than initial provisioning.
Infrastructure is provisioned through Harness IaCM. Services are deployed through Harness CD. Updates, modifications, and teardown actions are versioned, auditable, and governed within the same system.
Teams can define time-to-live policies for ephemeral environments so they are automatically destroyed when no longer needed. This reduces environment sprawl and controls cloud costs without slowing experimentation.
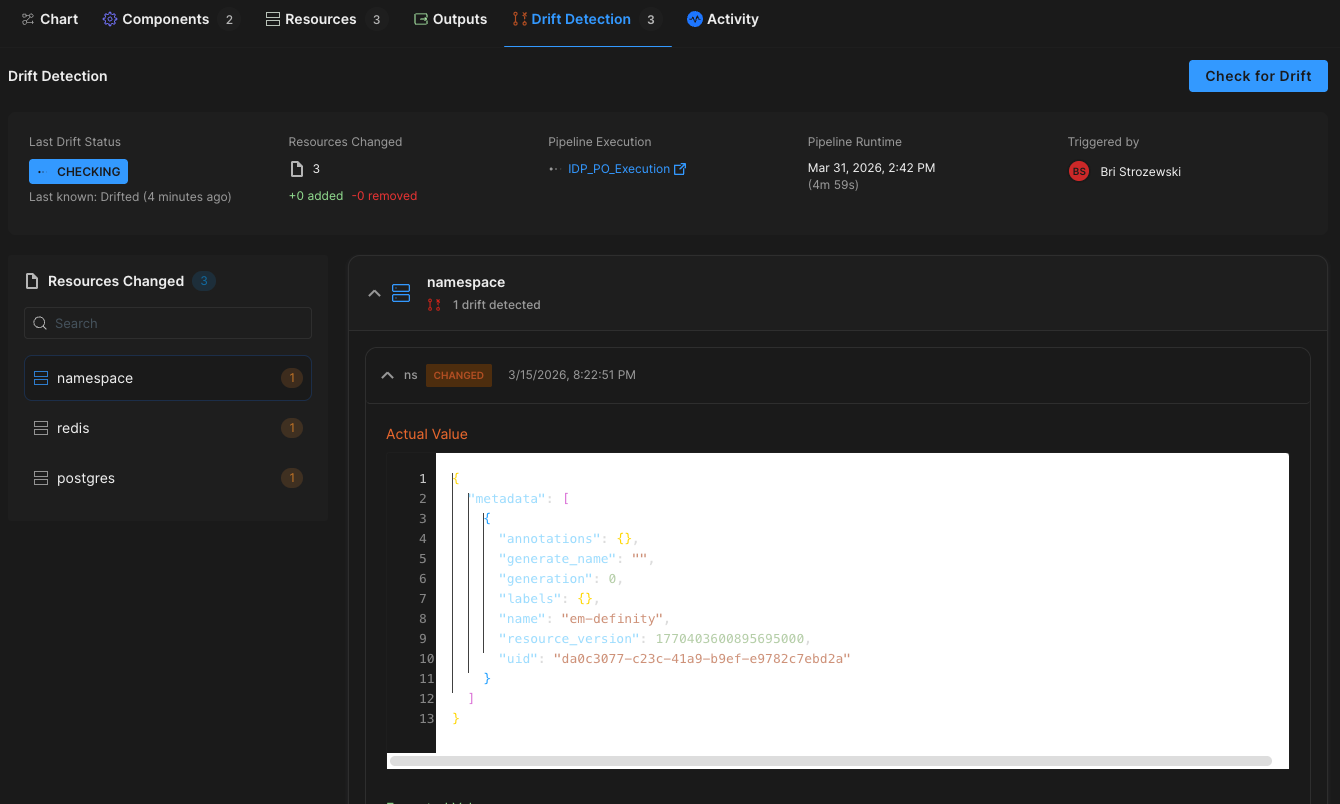
Harness EM also introduces drift detection. As environments evolve, unintended changes can occur outside declared infrastructure definitions. Drift detection provides visibility into differences between the blueprint and the running environment, allowing teams to detect issues early and respond appropriately. In regulated industries, this visibility is essential for auditability and compliance.
Governance Built In
For enterprises operating at scale, self-service without control is not viable.
Environment Management leverages Harness’s existing project and organization hierarchy, role-based access control, and policy framework. Platform teams can control who creates environments, which blueprints are available to which teams, and what approvals are required for changes. Every lifecycle action is captured in an audit trail.
This balance between autonomy and oversight is critical. Environment Management delivers that balance. Developers gain speed and independence, while enterprises maintain the governance they require.
"Our goal is to make environment creation a simple, single action for developers so they don't have to worry about underlying parameters or pipelines. By moving away from spinning up individual services and using standardized blueprints to orchestrate complete, production-like environments, we remove significant manual effort while ensuring teams only have control over the environments they own."
— Dinesh Lakkaraju, Senior Principal Software Engineer, Boomi
From Portal to Platform
Environment Management represents a shift in how internal developer platforms are built.
Instead of focusing solely on discoverability or one-off self-service actions, it brings lifecycle control, cost governance, and compliance directly into the developer workflow.
Developers can create environments confidently. Platform engineers can encode standards once and reuse them everywhere. Engineering leaders gain visibility into cost, drift, and deployment velocity across the organization.
Environment sprawl and ticket-driven provisioning do not have to be the norm. With Environment Management, environments become governed systems, not manual processes. And with CD, IaCM, and IDP working together, Harness is turning environment control into a core platform capability instead of an afterthought.
This is what real environment management should look like.

Engineering teams are generating more shippable code than ever before — and today, Harness is shipping five new capabilities designed to help teams release confidently. AI coding assistants lowered the barrier to writing software, and the volume of changes moving through delivery pipelines has grown accordingly. But the release process itself hasn't kept pace.
The evidence shows up in the data. In our 2026 State of DevOps Modernization Report, we surveyed 700 engineering teams about what AI-assisted development is actually doing to their delivery. The finding stands out: while 35% of the most active AI coding users are already releasing daily or more, those same teams have the highest rate of deployments needing remediation (22%) and the longest MTTR at 7.6 hours.
This is the velocity paradox: the faster teams can write code, the more pressure accumulates at the release, where the process hasn't changed nearly as much as the tooling that feeds it.
The AI Delivery Gap
What changed is well understood. For years, the bottleneck in software delivery was writing code. Developers couldn't produce changes fast enough to stress the release process. AI coding assistants changed that. Teams are now generating more change across more services, more frequently than before — but the tools for releasing that change are largely the same.
In the past, DevSecOps vendors built entire separate products to coordinate multi-team, multi-service releases. That made sense when CD pipelines were simpler. It doesn't make sense now. At AI speed, a separate tool means another context switch, another approval flow, and another human-in-the-loop at exactly the moment you need the system to move on its own.
The tools that help developers write code faster have created a delivery gap that only widens as adoption grows.
What Harness Is Shipping
Today Harness is releasing five capabilities, all natively integrated into Continuous Delivery. Together, they cover the full arc of a modern release: coordinating changes across teams and services, verifying health in real time, managing schema changes alongside code, and progressively controlling feature exposure.
Coordinate multi-team releases without the war room
Release Orchestration replaces Slack threads, spreadsheets, and war-room calls that still coordinate most multi-team releases. Services and the teams supporting them move through shared orchestration logic with the same controls, gates, and sequence, so a release behaves like a system rather than a series of handoffs. And everything is seamlessly integrated with Harness Continuous Delivery, rather than in a separate tool.
Know when to stop — automatically
AI-Powered Verification and Rollback connects to your existing observability stack, automatically identifies which signals matter for each release, and determines in real time whether a rollout should proceed, pause, or roll back. Most teams have rollback capability in theory. In practice it's an emergency procedure, not a routine one. Ancestry.com made it routine and saw a 50% reduction in overall production outages, with deployment-related incidents dropping significantly.
Ship code and schema changes together
Database DevOps, now with Snowflake support, brings schema changes into the same pipeline as application code, so the two move together through the same controls with the same auditability. If a rollback is needed, the application and database schema can rollback together seamlessly. This matters especially for teams building AI applications on warehouse data, where schema changes are increasingly frequent and consequential.
Roll out features gradually, measure what actually happens
Improved pipeline and policy support for feature flags and experimentation enables teams to deploy safely, and release progressively to the right users even though the number of releases is increasing due to AI-generated code. They can quickly measure impact on technical and business metrics, and stop or roll back when results are off track. All of this within a familiar Harness user interface they are already using for CI/CD.
Warehouse-Native Feature Management and Experimentation lets teams test features and measure business impact directly with data warehouses like Snowflake and Redshift, without ETL pipelines or shadow infrastructure. This way they can keep PII and behavioral data inside governed environments for compliance and security.
These aren't five separate features. They're one answer to one question: can we safely keep going at AI speed?
From Deployment to Verified Outcome
Traditional CD pipelines treat deployment as the finish line. The model Harness is building around treats it as one step in a longer sequence: application and database changes move through orchestrated pipelines together, verification checks real-time signals before a rollout continues, features are exposed progressively, and experiments measure actual business outcomes against governed data.
A release isn't complete when the pipeline finishes. It's complete when the system has confirmed the change is healthy, the exposure is intentional, and the outcome is understood.
That shift from deployment to verified outcome is what Harness customers say they need most. "AI has made it much easier to generate change, but that doesn't mean organizations are automatically better at releasing it," said Marc Pearce, Head of DevOps at Intelliflo. "Capabilities like these are exactly what teams need right now. The more you can standardize and automate that release motion, the more confidently you can scale."
Release Becomes a System, Not a Scramble
The real shift here is operational. The work of coordinating a release today depends heavily on human judgment, informal communication, and organizational heroics. That worked when the volume of change was lower. As AI development accelerates, it's becoming the bottleneck.
The release process needs to become more standardized, more repeatable, and less dependent on any individual's ability to hold it together at the moment of deployment. Automation doesn't just make releases faster. It makes them more consistent, and consistency is what makes scaling safe.
For Ancestry.com, implementing Harness helped them achieve 99.9% uptime by cutting outages in half while accelerating deployment velocity threefold.
At Speedway Motors, progressive delivery and 20-second rollbacks enabled a move from biweekly releases to multiple deployments per day, with enough confidence to run five to 10 feature experiments per sprint.
AI made writing code cheap. Releasing that code safely, at scale, is still the hard part.
Harness Release Orchestration, AI-Powered Verification and Rollback, Database DevOps, Warehouse-Native Feature Management and Experimentation, and Improve Pipeline and Policy support for FME are available now. Learn more and book a demo.
On March 19th, the risks of running open execution pipelines — where what code runs in your CI/CD environment is largely uncontrolled — went from theoretical to catastrophic.
A threat actor known as TeamPCP compromised the GitHub Actions supply chain at a scale we haven't seen before (tracked as CVE-2026-33634, CVSS 9.4). They compromised Trivy, the most widely used vulnerability scanner in the cloud-native ecosystem, and turned it into a credential-harvesting tool that ran inside victims' own pipelines.
Between March 19 and March 24, 2026, organizations running affected tag-based GitHub Actions references were sending their AWS tokens, SSH keys, and Kubernetes secrets directly to the attacker. SANS Institute estimates over 10,000 CI/CD workflows were directly affected. According to multiple security research firms, the downstream exposure extends to tens of thousands of repositories and hundreds of thousands of accounts.
Five ecosystems. Five days. One stolen Personal Access Token.
This is a fundamental failure of the open execution pipeline model — where what runs in your pipeline is determined by external references to public repositories, mutable version tags, and third-party code that executes with full privileges. GitHub Actions is the most prominent implementation.
The alternative, governed execution pipelines, where what runs is controlled through policy gates, customer-owned infrastructure, scoped credentials, and immutable references, is the model we designed Harness around years ago, precisely because we saw this class of attack coming.
Part I: The Long Road to TeamPCP (2025–2026)
TeamPCP wasn't an anomaly; it was the inevitable conclusion of an eighteen-month escalation in CI/CD attack tactics.
1. The tj-actions Proof of Concept (March 2025)
CVE-2025-30066. Attackers compromised a PAT from an upstream dependency (reviewdog/action-setup) and force-pushed malicious code to every single version tag of tj-actions/changed-files. 23,000 repositories were exposed. The attack was later connected to a targeted campaign against Coinbase. CISA issued a formal advisory.
This proved that the industry's reliance on mutable tags (like @v2) was a serious structural vulnerability. According to Wiz, only 3.9% of repositories pin to immutable SHAs. The other 96% are trusting whoever owns the tag today.
2. The Shai-Hulud Worm (Sept–Nov 2025)
The first self-replicating worm in the CI/CD ecosystem. Shai-Hulud 2.0 backdoored 796 npm packages representing over 20 million weekly downloads — including packages from Zapier, PostHog, and Postman.
It used TruffleHog to harvest 800+ credential types, registered compromised machines as self-hosted GitHub runners named SHA1HULUD for persistent C2 over github.com, and built a distributed token-sharing network where compromised machines could replace each other's expired credentials.
PostHog's candid post-mortem revealed that attackers stole their GitHub bot's PAT via a pull_request_target workflow exploit, then used it to steal npm publishing tokens from CI runner secrets. Their admission that this kind of attack "simply wasn't something we'd prepared for" reflects the industry-wide gap between application security and CI/CD security maturity. CISA issued another formal advisory.
3. The Trivy Compromise (March 19, 2026)
TeamPCP went after the security tools themselves.
They exploited a misconfigured GitHub Actions workflow to steal a PAT from Aqua Security's aqua-bot service account. Aqua detected the breach and initiated credential rotation — but reporting suggests the rotation did not fully cut off attacker access. TeamPCP appears to have retained or regained access to Trivy's release infrastructure, enabling the March 19 attack weeks after initial detection.
On March 19, they force-pushed a malicious "Cloud Stealer" to 76 of 77 version tags in trivy-action and all 7 tags in setup-trivy. Simultaneously, they published an infected Trivy binary (v0.69.4) to GitHub Releases and Docker Hub. Every pipeline referencing those tags by name started executing the attacker's code on its next run. No visible change to the release page. No notification. No diff to review.
Part II: Inside the "Cloud Stealer" Tradecraft
TeamPCP's payload was purpose-built for CI/CD runner environments:
Memory Scraping. It read /proc/*/mem to extract decrypted secrets held in RAM. GitHub's log-masking can't hide what's in process memory.
Cloud Metadata Harvesting. It queried the AWS Instance Metadata Service (IMDS) at 169.254.169.254, pivoting from "build job" to full IAM role access in the cloud.
Filesystem Sweep. It searched over 50 specific paths — .env files, .aws/credentials, .kube/config, SSH keys, GPG keys, Docker configs, database connection strings, and cryptocurrency wallet keys.
Encrypted Exfiltration. All data was bundled into tpcp.tar.gz, encrypted with AES-256 and RSA-4096, and sent to typosquatted domains like scan.aquasecurtiy[.]org (note the "tiy"). These domains returned clean verdicts from threat intelligence feeds during the attack. As a fallback, the stealer created public GitHub repos named tpcp-docs under the victim's own account.
The malicious payload executed before the legitimate Trivy scan. Pipelines appeared to work normally. CrowdStrike noted: "To an operator reviewing workflow logs, the step appears to have completed successfully."
The Five-Day Cascade
Sysdig observed that the vendor-specific typosquat domains were a deliberate deception — an analyst reviewing CI/CD logs would see traffic to what appears to be the vendor's own domain.
It took Aqua five days to fully evict the attacker, during which TeamPCP pushed additional malicious Docker images (v0.69.5 and v0.69.6).
Part III: Why Open Execution Pipelines Break at Scale
Why did this work so well? Because GitHub Actions is the leading example of an open execution pipeline — where what code runs in your pipeline is determined by external references that anyone can modify.
This trust problem isn't new. Jenkins had a similar issue with plugins. Third-party code ran with full process privileges. But Jenkins ran inside your firewall; exfiltrating data required getting past your network perimeter.
GitHub Actions took the same open execution approach but moved execution to cloud-hosted runners with broad internet egress, making exfiltration trivially easy. TeamPCP's Cloud Stealer just needed to make an HTTPS POST to an external domain, which runners are designed to do freely.
Here are a few reasons why open execution pipelines break at scale:
Mutable Trust. When you use @v2, you are trusting a pointer, not a piece of code. Tags can be silently redirected by anyone with write access. TeamPCP rewrote 76 tags in a single operation. 96% of the ecosystem is exposed.
Flat Privileges. Third-party Actions run with the same permissions as your code. No sandbox. No permission isolation. This is why TeamPCP targeted security scanners — tools that by design have elevated access to your pipeline infrastructure. The attacker doesn't need to break in. The workflow invites them in.
Secret Sprawl. Secrets are typically injected into the runner's environment or process memory during job execution, where they remain accessible for the job's duration. TeamPCP's /proc/*/mem scraper didn't need any special privilege. It just needed to be running on the same machine.
Unbounded Credential Cascades. There is no architectural boundary that stops a credential stolen in one context from unlocking another. TeamPCP proved this definitively: Trivy → Checkmarx → LiteLLM → AI API keys across thousands of enterprises. One PAT, five ecosystems.
Part IV: Governed Execution Pipelines — Three Structural Walls
Harness CI/CD pipelines are built as governed execution pipelines — where what runs is controlled through customer-owned infrastructure, policy gates, scoped credentials, immutable references, and explicit trust boundaries. At its core is the Delegate — a lightweight worker process that runs inside your infrastructure (your VPC, your Kubernetes cluster), executes tasks locally, and communicates with the Harness control plane via outbound-only connections.
When we designed this architecture, we assumed the execution plane would become the primary target in the enterprise. If TeamPCP tried to attack a Harness-powered environment, they would hit three architectural walls.
Wall 1: The Airlock (Outbound-Only, Egress-Filtered Execution)
The Architecture.
The Delegate lives inside your VPC or cluster. It communicates with our SaaS control plane via outbound-only HTTPS/WSS. No inbound ports are opened.
The Defense.
You control the firewall. Allowlist app.harness.io and the specific endpoints your pipelines need, deny everything else. TeamPCP's exfiltration to typosquat domains would fail at the network layer — not because of a detection rule, but because the path doesn't exist. Both typosquat domains returned clean verdicts from threat intel feeds. Egress filtering by allowlist is more reliable than detection by reputation.
Wall 2: The Vault (Secret Isolation at the Source)
The Architecture.
Rather than bulk-injecting secrets as flat environment variables at job start, Harness can resolve secrets at runtime through your secret manager — HashiCorp Vault, AWS Secrets Manager, GCP Secret Manager, Azure Key Vault — via the Delegate, inside your network. Harness SaaS stores encrypted references and metadata, not plaintext secret values.
The Defense.
TeamPCP's Cloud Stealer worked because in an open execution pipeline, secrets are typically injected into the runner's process memory where they remain accessible for the job's duration. In a governed execution pipeline, this exposure is structurally reduced: secrets can be resolved from your controlled vault at the point they're needed, rather than broadcast as environment variables to every step in the pipeline.
An important caveat: Vault-based resolution alone doesn't eliminate runtime exfiltration. Once a secret is resolved and passed to a step that legitimately needs it — say, an npm token during npm publish — that secret exists in the step's runtime. If malicious code is executing in that same context (for example, a tampered package.json that exfiltrates credentials during npm run test), the secret is exposed regardless of where it came from. This is why the three walls work as a system: Wall 2 reduces the surface of secret exposure, Wall 1 blocks the exfiltration path, and (as we'll see) Wall 3 limits the blast radius to the scoped environment. No single wall is sufficient on its own.
To further strengthen how pipelines use secrets, leverage ephemeral credentials — AWS STS temporary tokens, Vault dynamic secrets, or GCP short-lived service account tokens — that auto-expire after a defined window, often minutes. Even if TeamPCP’s memory scraper extracted an ephemeral credential, it likely would have expired before the attacker could pivot to the next target.
Wall 3: The Dead End (Environment-Scoped Isolation)
The Architecture.
Harness supports environment-scoped delegates as a core architecture pattern. Your "Dev" scanner delegate runs in a different cluster, with different network boundaries and different credentials, than your "Prod" deployment delegate.
The Defense.
The credential cascade that defined TeamPCP hits a dead end. Stolen Dev credentials cannot reach Production publishing gates or AI API keys, because those credentials live in a different vault, resolved by a different delegate, in a different network segment. If the Trivy compromise only yielded credentials scoped to a dev environment, the attack stops at phase one.
Beyond the walls, governed execution pipelines provide additional structural controls:
- No default marketplace dependency: In GitHub Actions, the primary building block is a reference to an external Action in a public repository. In Harness, the primary building blocks are native pipeline steps that don't reference external Git repos. Harness does support running GitHub Actions as steps for teams that need compatibility, but external Actions are an optional path — not the default architecture.
- Reduced tooling and attack surface. Customers can use minimal delegate images with a significantly reduced binary footprint and least-privilege Kubernetes roles to restrict available tooling. TeamPCP's kubectl get secrets --all-namespaces would require tooling and permissions that a properly hardened delegate environment wouldn't provide.
The Comparison
What TeamPCP Actually Exploited — Mapped to Harness Defenses
Part V: The Nuance — Governed Doesn't Mean Automatically Safe
Architecture is a foundation, not a guarantee. Governed execution pipelines are materially safer against this class of attack, but you can still create avoidable risk by running unvetted containers on delegates, skipping egress filtering, using the same delegate across dev and prod, granting overly broad cloud access, or exposing excessive secrets to jobs that don't need them, or using long-lived static credentials when ephemeral alternatives exist.
I am not claiming that Harness is safe and GitHub Actions is unsafe. That would be too simplistic.
What I am claiming is that governed execution pipelines — where what runs is controlled through policy gates, customer-owned infrastructure, scoped credentials, and immutable references — are a materially safer foundation than open execution pipelines. We designed Harness as our implementation of a governed execution pipeline. But architecture is a starting point — you still have to operate it well.
Part VI: The Strategic Bottom Line — From Open to Governed
As we enter the era of Agentic AI — where AI is generating pipelines, suggesting dependencies, and submitting pull requests at machine speed — we can no longer rely on human review to catch a malicious tag in an AI-generated PR.
But there's a more fundamental shift: AI agents will become the primary actors inside CI/CD pipelines. Not just generating code — autonomously executing tasks, selecting dependencies, making deployment decisions, remediating incidents.
Now imagine an AI agent in an open execution pipeline — downloaded from a public marketplace, referenced by a mutable tag, executing with full privileges, making dynamic runtime decisions you didn't define. It has access to your secrets, your cloud credentials, and your deployment infrastructure. Unlike a static script, an agent makes decisions at runtime — fetching resources, calling APIs, modifying files.
If TeamPCP showed us what happens when a static scanner is compromised, imagine what happens when an autonomous AI agent is compromised — or simply makes a decision you didn't anticipate.
This is why governed execution pipelines aren't just a security improvement — they're an architectural prerequisite for the AI era. In a governed pipeline, even an AI agent operates within structural boundaries: it runs on infrastructure you control, accesses only scoped secrets, has restricted egress, and its actions are audited. The agent may be autonomous, but the pipeline constrains what it can reach.
The questions every engineering leader should be asking:
- Is my pipeline open or governed? Do I control what code executes, or is it determined by external references I don't audit?
- Where does execution happen? In infrastructure I control, or in an environment assembled from public dependencies?
- Who controls the network boundary? My security team, or the maintainer of a third-party Action?
- Are secrets sitting in runner memory or safely in my Vault?
- What stops a credential cascade from crossing environment boundaries?
- When AI agents start running autonomously in my pipelines, what structural boundaries constrain them?
What You Should Do Right Now
If you use Trivy, Checkmarx, or LiteLLM:
- Assume compromise if you ran any of these tools between March 19–25. Rotate all credentials accessible to affected CI/CD runners. Check your GitHub org for repos named tpcp-docs — their presence indicates successful exfiltration.
- Block scan.aquasecurtiy[.]org, checkmarx[.]zone, and models.litellm[.]cloud at the network level.
- Update to safe versions: check with the providers of each impacted package and update the scanner and actions.
If you use GitHub Actions:
- Pin every Action to an immutable commit SHA. Today.
- Commit SHAs are not sufficient. They pin to the right commit, but do not guarantee that the right repository is selected.
- Add provenance verification: To close the gap left by SHA pinning alone, verify the Action’s source and publisher, restrict which external Actions are allowed, and prefer artifacts with verifiable provenance or attestations.
- Audit workflows for pull_request_target triggers.
- Enforce Least Privilege on GitHub Tokens: Audit every Personal Access Token and GitHub App permission. If it’s not scoped to the specific repository and the specific task (e.g., "contents: read"), it is a liability.
- Monitor egress for unexpected destinations: Domain reputation alone is insufficient.
For the longer term:
- Evaluate whether your CI/CD pipelines are open or governed. If production credentials flow through your pipelines, you need a governed execution pipeline where you control the infrastructure, the network boundary, the secret resolution, and the audit trail.
- Establish policies: Implement platform-wide automated governance to enforce SHAs and least-privilege token usage programmatically through systems like OPA.
The Responsibility We Share
I'm writing this as the CEO of a company that competes with GitHub in the CI/CD space. I want to be transparent about that.
But I'm also writing this as someone who has spent two decades building infrastructure software and who saw this threat model coming. When we designed Harness, the open execution pipeline model had already evolved from Jenkins plugins to GitHub Actions — each generation making it easier for third-party code to run with full privileges and, by moving execution further from the customer's network perimeter, making exfiltration easier. We deliberately chose to build governed execution pipelines instead.
The TeamPCP campaign didn't teach us anything new about the risk. What it did was make the difference between open and governed execution impossible for the rest of the industry to ignore.
Open source security tools are invaluable. The developers and companies who build them — including Aqua Security and Checkmarx — are doing essential work. The problem isn't the tools. The problem is running them inside open execution pipelines where third-party code has full privileges, secrets sit in memory, and exfiltration faces no structural barrier.
If you want to explore how the delegate architecture works in practice, we're here to show you. But more importantly, regardless of what platform you choose, please take these structural questions seriously. The next TeamPCP is already studying the credential graph.
Latest Blogs

Why Connected Platforms Will Power the Next Generation of AI in Engineering
- AI is only as effective as the connected context it can access, and fragmented systems limit its value.
- Connected platforms unify engineering data and workflows, enabling AI to reason across the full software delivery lifecycle.
- The quality of AI outcomes will depend on how well an organization designs and connects its engineering platform.
AI is quickly becoming part of the engineering workflow. Teams are experimenting with assistants and agents that can answer questions, investigate incidents, suggest changes, and automate parts of software delivery.
But there is a problem hiding underneath all of that momentum.
Most engineering environments were not built to give AI the context it needs.
In many organizations, the service catalog lives in one place. Deployment data lives in another. Incident history sits in a separate system. Ownership metadata is incomplete or outdated. Documentation is scattered. Operational signals are trapped inside the tools that generated them.
So while many teams are excited about what AI can do, the real limitation is not the model. It is the environment around it.
AI can only reason across the context it can access. And in a fragmented engineering system, context is fragmented too.
AI does not just need data. It needs connected context.
This is where I think a lot of engineering leaders are going to have to shift their thinking.
The conversation is often framed around adopting AI tools. But the bigger question is whether your engineering platform is structured in a way that makes AI useful.
If one system knows who owns a service, another knows what was deployed, another knows what failed in production, and none of them are meaningfully connected, then AI is left working with partial information. It may still generate answers, but those answers will be limited by the gaps in the system.
That is why connected platforms matter.
The next generation of AI in engineering will not be powered by isolated tools. It will be powered by systems that connect services, teams, delivery workflows, operational signals, and standards into one usable layer of context.
This is where platform engineering becomes strategic
For years, platform engineering has been framed as a developer productivity initiative. Make it easier to create services. Standardize workflows. Reduce friction. Improve the developer experience.
All of that still matters.
But the rise of AI raises the stakes.
A connected platform is not just a better way to support developers. It is the foundation for giving AI enough context to actually understand how your engineering organization works.
That is why an Internal Developer Portal matters more now than it did even a year ago.
If it is implemented correctly, the portal is not just a front door or a dashboard. It becomes the place where standards, ownership, service metadata, and workflow context come together.
That is what makes it valuable to humans.
And it is also what makes it valuable to AI.
A portal alone is not enough
Of course, none of this works if the portal is static.
A lot of organizations have a portal that shows what services exist and maybe who owns them. But if it is not connected to CI/CD and operational systems, it becomes stale quickly.
That is the difference between a directory and a platform.
CI/CD is where code becomes running software. It is where deployments happen, tests run, policies are enforced, and changes enter production. It is also where some of the most valuable engineering signals are created. Build results, security scans, deployment history, runtime events, and change records all emerge from that flow.
If that evidence stays trapped inside the delivery tooling, the broader platform never reflects reality.
And if the platform does not reflect reality, AI does not have a trustworthy system to reason across.
The real opportunity is a living knowledge layer
When the Internal Developer Portal is connected to CI/CD and fed continuously by operational data, something more important starts to happen.
The platform stops being just a developer interface and starts becoming a living knowledge layer for the engineering organization.
Every service is connected to its owner.
Every deployment is connected to the pipeline that produced it.
Every change event is connected to downstream impact.
Every incident is connected to the affected system and the responsible team.
Every standard and policy is embedded into the same environment where work is actually happening.
That creates a structure AI can work with.
Instead of pulling fragments from disconnected tools, AI can reason across relationships. It can understand not just isolated facts, but how those facts connect across the engineering system.
That is what will separate shallow AI adoption from meaningful AI leverage.
The next generation of AI in engineering will depend on system design
This is why I do not think the future belongs to organizations that simply layer AI on top of fragmented tooling.
It belongs to organizations that create connected platforms first.
Because once the system is connected, AI becomes much more useful. It can surface the right operational context faster. It can help investigate incidents with better awareness of ownership and recent changes. It can support governance by tracing standards and policy state across the delivery flow. It can help teams move faster because it is reasoning inside a connected system rather than guessing across silos.
In other words, the quality of AI outcomes will increasingly depend on the quality of platform design.
That is the bigger shift.
Platform engineering is no longer just about reducing developer friction. It is about building the context layer that modern engineering organizations, and their AI systems, will depend on.
What leaders should do now
The organizations that get ahead here will not start by asking which AI tool to buy.
They will start by asking whether their engineering systems are connected enough to support AI in a meaningful way.
Can you trace a service to its owner, its pipeline, its deployment history, its policy state, and its operational health?
Does your platform reflect what is actually happening in the software delivery lifecycle?
Is your Internal Developer Portal just presenting metadata, or is it becoming the system where engineering context is connected and kept current?
Those are the questions that matter.
Because the next generation of AI in engineering will not be powered by tools alone.
It will be powered by connected platforms that turn engineering activity into usable, trustworthy context.
That is the real opportunity.

How to Build a Developer Self-Service Platform That Actually Works
- Developer self-service works when golden paths, guardrails, and real-time metrics are designed together, so developers can move fast without opening tickets.
- A focused 90-day rollout that starts with one or two high-value golden paths lets you prove developer self-service ROI without disrupting existing pipelines.
- Policy as code, RBAC, and scorecards keep developer self-service secure and auditable, turning platform engineering from ticket-ops into a measurable product.
Your developers are buried under tickets for environments, pipelines, and infra tweaks, while a small platform team tries to keep up. That is not developer self-service. That is managed frustration.
If 200 developers depend on five platform engineers for every change, you do not have a platform; you have a bottleneck. Velocity drops, burnout rises, and shadow tooling appears.
Developer self-service fixes this, but only when it is treated as a product, not a portal skin. You need opinionated golden paths, automated guardrails, and clear metrics from day one, or you simply move the chaos into a new UI.
Harness Internal Developer Portal turns those ideas into reality with orchestration for complex workflows, policy as code guardrails, and native scorecards that track adoption, standards, and compliance across your engineering org.
What is Developer Self-Service?
Developer self-service is a platform engineering practice where developers independently access, provision, and operate the resources they need through a curated internal developer portal instead of filing tickets and waiting in queues.
In a healthy model, developers choose from well-defined golden paths, trigger automated workflows, and get instant feedback on policy violations, cost impact, and readiness, all inside the same experience.
The portal, your internal developer platform, brings together CI, CD, infrastructure, documentation, and governance so engineers can ship safely without becoming experts in every underlying tool.
If you want a broader framing of platform engineering and self-service, the CNCF’s view on platform engineering and Google’s SRE guidance on eliminating toil are good companions to this approach.
Why Developer Self-Service Matters Now
Developer self-service is quickly becoming the default for high-performing engineering organizations. Teams that adopt it see:
- Faster delivery cycles because developers do not wait for centralized teams.
- More consistent reliability because standard workflows replace ad hoc one-offs.
- Stronger security and compliance because policies run automatically in every workflow.
For developers, that means: less waiting, fewer handoffs, and a single place to discover services, docs, environments, and workflows.
For platform, security, and leadership, it means standardized patterns, visibility across delivery, and a way to scale support without scaling ticket queues.
Choosing the Right Candidates for Developer Self-Service
Not every workflow should be self-service. Start where demand and repeatability intersect.
Good candidates for developer self-service include:
- New service scaffolding using approved frameworks and languages.
- Environment provisioning for dev, test, and ephemeral preview environments.
- Standard infrastructure patterns, such as app plus database stacks or common microservice blueprints.
- Routine deployment flows for common applications and services.
Poor candidates are rare, one-time, or highly bespoke efforts, such as major legacy migrations and complex one-off compliance projects. Those stay as guided engagements while you expand the surface area of your developer self-service catalog.
A useful mental model: if a task appears frequently on your team’s Kanban board, it probably belongs in developer self-service.
Core Components of Developer Self-Service
A working developer self-service platform ties three components together: golden paths, guardrails, and metrics.
- Golden paths cut decision fatigue and encode your best practices.
- Guardrails automate approvals and compliance inside pipelines.
- Metrics and scorecards prove that developer self-service is improving outcomes.
When these three live in one place, your internal developer portal, developers get autonomy, and your platform team gets control and visibility.
Golden Paths and Software Catalogs
Developers want to ship code, not reverse engineer your platform. Golden paths give them a paved road.
A strong software catalog and template library should provide:
- Searchable entries for services, APIs, libraries, and domains, each with owners and documentation.
- Pre-approved templates, such as “Node.js microservice with CI and CD” or “Event-driven service with Kafka,” that plug into your existing tools.
- Opinionated defaults for logging, monitoring, security, and testing, so teams start in a good place without extra decisions.
Instead of spending weeks learning how to deploy on your stack, a developer selects a golden path, answers a few questions, and gets a working pipeline and service in hours. The catalog becomes the system of record for your software topology and the front door for developer self-service.
To avoid common design mistakes at this layer, review how teams succeed and fail in our rundown of internal developer portal pitfalls. For additional perspective on golden paths and developer experience, the Thoughtworks Technology Radar often highlights platform engineering and paved road patterns.
Golden paths should also feel fast. Integrating capabilities like Harness Test Intelligence and Incremental Builds into your standard CI templates keeps developer self-service flows quick, so developers are not trading one bottleneck for another.
Policy as Code Guardrails
Manual approvals for every change slow everything to a crawl. Developer self-service requires approvals to live in code, not in email threads.
A practical guardrail model includes:
- Policy as Code (for example, with OPA) defines what can run where, under which conditions.
- RBAC that controls who can run what, where, and when, aligned with your environments and teams.
- Automatic promotion for compliant changes, with only exceptions routed to security or compliance for human review.
- Early drift detection and configuration checks that run on every self-service workflow, not just production deploys.
Developers stay in flow because they get instant, actionable feedback in their pipelines. Platform and security teams get a consistent, auditable control plane. That is the sweet spot of developer self-service: autonomy with safety baked in.
On the delivery side, Harness strengthens these guardrails with DevOps pipeline governance and AI-assisted deployment verification, so governance and safety are enforced in every self-service deployment, not just a select few.
If you want to go deeper on policy-as-code concepts, the Open Policy Agent project maintains solid policy design guides that align well with a developer self-service model.
Metrics, Scorecards, and Audit Trails
Developer self-service is only “working” if you can prove it. Your platform should ship with measurement built in, not bolted on later.
Useful scorecards and signals include:
- Time to first deploy for new services created through golden paths.
- Ticket volume for infra and environment requests before and after self service.
- Change failure rate, lead time for changes, and mean time to restore for self-service flows.
- Template adoption across teams, mapped against standards and readiness criteria.
Every template execution, pipeline run, and infra change should be tied back to identities, services, and tickets. When leadership asks about ROI, you can show concrete changes: fewer tickets, faster provisioning, higher compliance coverage, all driven by developer self-service.
Harness makes this easier through rich CD and CI analytics and CD visualizations, giving platform teams and executives a unified view of developer self-service performance.
A 90 Day Plan to Launch Developer Self-Service
You do not need a year-long platform program to start seeing value. A structured 90-day rollout lets you move from ticket-ops to real developer self-service without breaking existing CI or CD.
Days 0–30: Lay the Foundation
- Pick one application domain (for example, customer-facing web services) and one infrastructure class (for example, Kubernetes).
- Define one or two golden paths as software templates that plug into your current CI, CD, and IaC stack.
- Connect those templates to infra provisioning workflows, reusing your IaC modules, and add policy as code plus RBAC so compliant requests auto-approve.
- Test end-to-end with the platform team first, then invite a single pilot team to validate the developer self-service experience.
Ensure CI pipelines for these golden paths leverage optimizations like Harness Test Intelligence and Incremental Builds, so developers immediately feel the speed benefits.
Days 31–60: Scale and Measure
- Expand to three to five templates that cover your most frequent service and infra patterns, incorporating feedback from the first pilot team.
- Onboard two or three more teams and move their new services and environment requests onto developer self-service.
- Integrate your OPA policies into CI and CD pipelines so that every self-service action is evaluated automatically, and only exceptions require human review.
As usage grows, use Harness Powerful Pipelines to orchestrate more complex delivery flows that still feel simple to developers consuming them through the portal.
Days 61–90: Standardize and Govern
- Standardize approval workflows across domains by moving routine decisions into policy code and reserving manual reviews for high-risk or non-standard changes.
- Publish documentation, runbooks, and ownership details directly in catalog entries, so developers ask the portal, not Slack, for answers.
- Turn on scorecards to track adoption, readiness, and DORA metrics for services onboarded through developer self-service, and use those insights to plan your next wave of templates.
At this stage, many teams widen their rollout based on lessons learned. For an example of how a production-ready platform evolves, see our introduction to Harness IDP.
Governance Without Friction
Governance often fails because it feels invisible until it blocks a deployment. Developer self-service demands the opposite: clear, automated guardrails that are obvious and predictable.
Effective governance for developer self-service looks like this:
- Approvals run inside the pipeline as policy as code, not in email or chat.
- Golden paths include built-in guardrails, so “doing the right thing” is the simplest choice.
- RBAC gates, escape hatches, and non-standard changes to specific roles or senior engineers.
- Audit logs capture every self-service action and map it to people, services, and environments.
Developers get fast feedback and clear rules. Security teams focus only on what matters. Auditors get immutable trails without asking platform teams to reassemble history. That is governance that scales with your developer self-service ambitions.
Harness supports this model by combining DevOps pipeline governance with safe rollout strategies such as Deploy Anywhere and AI-assisted deployment verification, so your policies and approvals travel with every deployment your developers trigger.
Developer Self-Service Best Practices
Developer self-service is powerful, but without an opinionated design, it turns into a “choose your own adventure” that nobody trusts. Use these practices to keep your platform healthy:
- Treat the platform like a product with clear personas, roadmaps, and feedback channels.
- Default to paved, self-service workflows and keep bespoke paths as the exception.
- Tie templates to strong observability and SLOs so you can see the impact of your golden paths.
- Use scorecards to track standards and production readiness across services, not just adoption.
- Iterate with small releases and regular user interviews instead of big bang launches.
The goal is not infinite choice. The goal is a consistent, safe speed for the most common developer journeys.
For more on making portals smarter and more useful, read about the AI Knowledge Agent for internal developer portals. You can also cross-check your direction with Microsoft’s guidance on platform engineering and self-service to ensure your strategy aligns with broader industry patterns.
Ship Faster With Guardrails: Start With Harness IDP
When golden paths, governance, and measurement all come together as one project, developer self-service works. Your platform needs orchestration that links templates to CI, CD, and IaC workflows, policy as code guardrails that automatically approve changes that follow the rules, and a searchable catalog that developers actually use.
When your internal developer portal cuts ticket volume, shrinks environment provisioning from days to minutes, and gives teams clear guardrails instead of guesswork, the ROI is obvious.
If you are ready to launch your first golden path and replace ticket ops with real developer self-service, Harness Internal Developer Portal gives you the orchestration, governance, and insights to do it at enterprise scale.
Developer Self-Service: Frequently Asked Questions (FAQs)
Here are answers to the questions most teams ask when they shift from ticket-based workflows to developer self-service. Use this section to align platform, security, and engineering leaders on what changes, what stays the same, and how to measure success.
How does developer self-service reduce toil without creating chaos?
Instead of making ad hoc requests, developer self-service uses standard workflows and golden paths. Repetitive tasks, like adding new services and environments, turn into catalog actions that always run the same way. Policy as code and RBAC stop changes that aren't safe or compliant before they reach production.
Can we introduce an internal developer portal without disrupting our existing CI or Jenkins setup?
Yes. To begin, put your current Jenkins jobs and CI pipelines into self-service workflows. The portal is the front door for developers, and your current systems are the execution engines that run in the background. You can change or move pipelines over time without changing how developers ask for work.
How do we prove developer self-service ROI and compliance to leadership?
Concentrate on a small number of metrics, such as the number of tickets for infrastructure and environment requests, the time it takes to provision new services and engineers, and the rate of change failure. You can see both business results and proof of compliance in one place when you add policy as code audit logs and scorecards that keep track of standards.
What happens when developers need something outside the standard templates?
"Everything is automated" does not mean "developer self-service." For special cases and senior engineers, make escape hatches that are controlled by RBAC. Let templates handle 80% of the work that happens over and over again. For the other 20%, use clear, controlled processes instead of one-off Slack threads.
How quickly will we see results from a developer self-service rollout?
Most teams see ticket reductions and faster provisioning within the first 30 days of their initial golden path, especially for new services and environments. Onboarding and productivity gains become clear after 60 to 90 days, once new hires and pilot teams are fully using the portal instead of legacy ticket flows.
What tools are essential for a modern developer self-service platform?
You need more than just a UI. Some of the most important parts are an internal developer portal or catalog, CI and CD workflows that work together, infrastructure automation, policy as code, strong RBAC, and scorecards or analytics to track adoption and results. A lot of companies now also add AI-powered search and help to make it easier to learn and safer to use developer self-service.

How to Implement Self-Service Infrastructure Without Losing Control
What is Self-Service Infrastructure?
Self-service infrastructure allows developers to provision and modify infrastructure without opening tickets or needing deep cloud expertise.
In a mature model:
- Developers request environments, services, or resources through an Internal Developer Portal or API.
- Requests trigger pipelines that run Terraform/OpenTofu, Kubernetes manifests, and security checks.
- Policy as Code enforces security, compliance, and cost controls automatically.
- Every action is version-controlled and auditable.
Core Building Blocks of Self-Service Infrastructure
Successful implementations rely on a consistent set of building blocks.
Standardized Templates and Modules
Reusable building blocks for services, environments, and resources, backed by Terraform/OpenTofu modules or Kubernetes manifests. Teams are given a small set of opinionated, well-tested options instead of a blank cloud console.
Guardrails as Code
Security, compliance, and cost policies encoded as code and enforced on every request and deployment. This removes reliance on manual review processes.
Environment Catalog
A defined set of environments (dev, test, staging, production), each with clear policies, quotas, and expectations. The interface remains consistent even if the underlying infrastructure differs.
Internal Developer Portal (IDP)
The control surface for self-service. Developers discover templates, understand standards, and trigger workflows without needing to understand underlying infrastructure complexity.
Harness brings these components together into a single system. The IDP provides the developer experience, while Infrastructure as Code Management and Continuous Delivery execute workflows with governance built in.
Reference Architecture: From Portal to Pipelines to Policy
Once the building blocks are defined, the next step is connecting them into a working system.
A practical architecture looks like this:
Internal Developer Portal as the Front Door
The IDP acts as the control plane for developers. Every self-service action starts here. Developers browse a catalog, select a golden path, and trigger workflows.
Infrastructure as Code Pipelines as the Execution Engine
Workflows trigger pipelines that handle planning, security scanning, approvals, and apply steps for Terraform/OpenTofu or Kubernetes.
Continuous Delivery Pipelines for Promotion
Changes move through environments using structured deployment strategies, with rollback and promotion managed automatically.
Policy as Code Engine for Guardrails
Policies evaluate every request and deployment, blocking non-compliant changes before they reach production.
Scorecards and Dashboards for Visibility
Scorecards aggregate adoption, performance, and compliance metrics across teams and services.
In Harness, this architecture is unified:
- The Harness IDP provides catalog, workflows, and scorecards.
- Infrastructure as Code Management executes Terraform/OpenTofu with governance and visibility.
- Continuous Delivery orchestrates deployments with built-in policy enforcement and verification.
Platform teams define standards once. Developers consume them through self-service.
Governance Without Friction: Guardrails, Not Gates
Governance should not rely on manual approvals. It should be encoded and enforced automatically.
Effective guardrails include:
- Policy as Code for security, compliance, and cost controls
- Environment-aware RBAC and risk-based approvals
- Pre-approved templates for common patterns
- Immutable audit logs for every action
The key shift is timing. Checks happen at request time, not days later. Governance becomes proactive instead of reactive.
A 90-Day Playbook for Self-Service Infrastructure
You can demonstrate value quickly by starting small and expanding deliberately.
Phase 1 (Weeks 1–3): Define One Golden Path
Focus on a single high-impact use case.
- Select one service type, environment, and region
- Define security, networking, and tagging standards
- Build one opinionated template with embedded guardrails
- Document expected outcomes clearly
The result is a single, high-value workflow that eliminates a significant portion of ticket-driven work.
Phase 2 (Weeks 4–8): Automate Guardrails With Policy-as-Code
Convert manual checks into enforceable rules.
- Implement Policy as Code (e.g., Open Policy Agent)
- Define rules for tagging, instance types, and regions
- Apply environment-specific policies based on risk
- Integrate policy checks into pipelines
At this stage, governance is consistently enforced by code.
Phase 3 (Weeks 9–12): Launch Through the IDP and Measure
Expose the golden path through the Internal Developer Portal so developers can discover and execute it independently.
- Publish workflows with clear documentation in the IDP
- Onboard pilot teams
- Track time-to-provision, adoption, and policy outcomes
Use these results to expand to additional services and environments.
Golden Paths and Templates Developers Actually Use
Golden paths determine whether self-service succeeds.
Effective templates:
- Hide infrastructure complexity behind safe defaults
- Expose only a small number of required inputs
- Provide variants for different service types
- Include Day 2 operations like monitoring and alerts
- Live in a searchable catalog within the IDP
The goal is not full abstraction. It is making the correct path the easiest path.
How CI/CD Fits Into Self-Service Infrastructure
Self-service infrastructure is most effective when integrated with CI and CD.
Continuous Integration
As environments scale, CI must remain efficient.
Harness Continuous Integration supports this with:
- Test Intelligence to run only relevant tests
- Build insights to identify bottlenecks
- Incremental builds to reduce execution time
Continuous Delivery
Continuous Delivery ensures consistent, governed releases.
Harness Continuous Delivery provides:
- Deployment strategies such as canary and blue/green
- Structured promotion across environments
- Policy enforcement within pipelines
This creates a unified path from code to production.
AI-Powered Automation Across the Self-Service Flow
AI can reduce friction across the lifecycle.
- Generate pipelines and templates from context
- Suggest and refine policy rules
- Provide contextual assistance within the IDP
- Automate deployment verification and rollback
Harness extends AI across CI, CD, and IDP, enabling faster and more consistent workflows.
Scaling Across Environments and Accounts
Scaling requires consistency and abstraction.
Environment Contracts
Each environment defines:
- Standard inputs
- Environment-specific policies
- Version-controlled configurations
Developers target environments, not infrastructure details.
Abstracting Complexity
Credentials, access, and guardrails are tied to environments.
The IDP presents simple choices, while underlying complexity is managed centrally.
Preventing Drift
- Maintain a small set of shared templates
- Enforce changes through pipelines
- Avoid ad hoc exceptions
This ensures consistency as scale increases.
Measuring ROI and Control With Scorecards
Self-service must be measured, not assumed. A useful scorecard includes:
Developer Velocity
- Lead time for changes
- Deployment frequency
- Mean time to restore
Infrastructure Efficiency
- Provisioning time
- Resource utilization
Quality and Reliability
- Change failure rate
- Rollback frequency
Adoption and Compliance
- Workflow usage in the IDP
- Policy pass rates
- Audit completeness
Scorecards live in the IDP, providing a shared view for developers and platform teams.
Autonomy With Guardrails: Your Next 90 Days
Start with a single golden path. Define guardrails. Prove value.
Expose that path through the Harness Internal Developer Portal as the front door to governed self-service, backed by Infrastructure as Code Management, CI, and CD.
Track adoption, speed, and policy outcomes. Use those results to expand systematically.
Self-service infrastructure becomes sustainable when autonomy and governance are built into the same system.
Frequently Asked Questions
How can organizations implement self-service infrastructure without sacrificing security?
Codify policies and enforce them at request and deployment time. Combine this with RBAC and audit logs for full visibility.
What are best practices for governed self-service?
Provide a small set of golden-path templates through an IDP. Keep credentials and policies centralized at the platform level.
What challenges arise when scaling?
Inconsistent environments, template sprawl, and unmanaged exceptions. Standardize inputs and enforce all changes through pipelines.
How do you measure ROI?
Track adoption, delivery speed, and policy outcomes. Use IDP scorecards to connect performance and governance metrics.
What is a realistic rollout timeline?
Approximately 90 days: define one path, automate guardrails, and launch through the IDP.
How does AI impact self-service?
AI accelerates onboarding, policy creation, and deployment validation, reducing manual effort while maintaining control.

Phil Christianson on Balancing Innovation and Reliability in Modern Product Teams
At SREday NYC 2026, the ShipTalk podcast spoke with Phil Christianson, Chief Product Officer at Xurrent, for a leadership perspective on the intersection of product strategy, engineering investment, and platform reliability.
While many of the conversations at the conference focused on tools, automation, and incident response, Phil offered a view from the C-suite level, where decisions about engineering priorities and R&D investment ultimately shape how reliability practices evolve.
In the episode, ShipTalk host Dewan Ahmed, Principal Developer Advocate at Harness, spoke with Phil about how product leaders decide when to invest in new features versus strengthening the underlying platform that supports them.
🎧 Listen to the Full Episode
Balancing Innovation and Platform Stability
For product leaders responsible for large engineering budgets, the tension between innovation and reliability is constant.
New technologies—especially AI—create strong pressure to ship new features quickly. At the same time, the long-term success of a platform depends on its stability and reliability.
Phil has managed large R&D investments across global teams, and he believes that sustainable innovation requires a careful balance between these priorities.
Organizations that focus only on new features often accumulate technical debt that eventually slows development. On the other hand, teams that focus exclusively on stability risk falling behind competitors.
The role of product leadership is to ensure that innovation and reliability evolve together, rather than competing for resources.
When to Invest in the SRE Foundation
One of the hardest decisions for product leaders is determining when it is time to shift focus from new features to foundational improvements.
Investments in areas like observability, reliability engineering, and infrastructure automation may not immediately produce visible product features, but they can dramatically improve long-term development velocity.
Phil argues that product leaders should view these investments not as overhead but as strategic enablers.
When systems are reliable and well-instrumented, engineering teams can ship faster, experiment more safely, and recover from incidents more effectively.
In this sense, the work of SRE teams becomes an important part of the product roadmap itself.
Turning SRE Into a Catalyst for Innovation
Reliability engineering is sometimes perceived as the team that slows things down—adding guardrails, enforcing deployment policies, and pushing back on risky changes.
Phil believes that perspective misses the bigger picture.
When reliability practices are integrated into product development correctly, SRE teams can actually accelerate innovation.
By improving deployment safety, observability, and automation, SRE teams allow developers to move faster with confidence.
Instead of acting as a barrier, reliability engineering becomes a catalyst that enables experimentation without compromising system stability.
This shift in mindset requires empowered teams, strong collaboration between product and engineering, and leadership that values long-term platform health.
The Role of Empowered Teams
A recurring theme in Phil’s leadership philosophy is the importance of empowered teams.
Rather than managing work through strict task lists and top-down directives, he emphasizes creating environments where engineers can take ownership of the systems they build.
In these environments:
- product leaders provide strategic direction
- engineers have autonomy to design solutions
- reliability practices are built directly into development workflows
This model allows teams to balance creativity and discipline—two qualities that are essential when building large-scale platforms.
Final Thoughts
Phil Christianson’s perspective highlights an important truth about modern software platforms.
Reliability engineering is not just an operational concern—it is a product strategy decision.
When organizations invest in strong reliability foundations and empower their teams to build safely, they create platforms that can evolve faster and scale more effectively.
In the end, the most successful products are not just the ones with the most features.
They are the ones built on systems that teams—and customers—can rely on.
🎧 Listen to the Full Episode
Subscribe to the ShipTalk Podcast
Enjoy conversations like this with engineers, founders, and technology leaders shaping the future of reliability and platform engineering.
Follow ShipTalk on your favorite podcast platform and stay tuned for more stories from the people building the systems that power modern technology. 🎙️🚀
Streamline your Workflows with Environment Management
We’ve come a long way in how we build and deliver software. Continuous Integration (CI) is automated, Continuous Delivery (CD) is fast, and teams can ship code quickly and often. But environments are still messy.
Shared staging systems break when too many teams deploy at once, while developers wait on infrastructure changes. Test environments get created and forgotten, but over time, what is running in the cloud stops matching what was written in code.
We have made deployments smooth and reliable, but managing environments still feels manual and unpredictable. That gap has quietly become one of the biggest slowdowns in modern software delivery.
This is the hidden bottleneck in platform engineering, and it's a challenge enterprise teams are actively working to solve.
As Steve Day, Enterprise Technology Executive at National Australia Bank, shared:
“As we’ve scaled our engineering focus, removing friction has been critical to delivering better outcomes for our customers and colleagues. Partnering with Harness has helped us give teams self-service access to environments directly within their workflow, so they can move faster and innovate safely, while still meeting the security and governance expectations of a regulated bank.”
At Harness, Environment Management is a first-class capability inside our Internal Developer Portal. It transforms environments from manual, ticket-driven assets into governed, automated systems that are fully integrated with Harness Continuous Delivery and Infrastructure as Code Management (IaCM).
This is not another self-service workflow. It is environment lifecycle management built directly into the delivery platform.
The result is faster delivery, stronger governance, and lower operational overhead without forcing teams to choose between speed and control.
Closing the Gap Between CD and IaC
Continuous Delivery answers how code gets deployed. Infrastructure as Code defines what infrastructure should look like. But the lifecycle of environments has often lived between the two.
Teams stitch together Terraform projects, custom scripts, ticket queues, and informal processes just to create and update environments. Day two operations such as resizing infrastructure, adding services, or modifying dependencies require manual coordination. Ephemeral environments multiply without cleanup. Drift accumulates unnoticed.
The outcome is familiar: slower innovation, rising cloud spend, and increased operational risk.
Environment Management closes this gap by making environments real entities within the Harness platform. Provisioning, deployment, governance, and visibility now operate within a single control plane.
Harness is the only platform that unifies environment lifecycle management, infrastructure provisioning, and application delivery under one governed system.
Blueprint-Driven by Design
At the center of Environment Management are Environment Blueprints.
Platform teams define reusable, standardized templates that describe exactly what an environment contains. A blueprint includes infrastructure resources, application services, dependencies, and configurable inputs such as versions or replica counts. Role-based access control and versioning are embedded directly into the definition.
Developers consume these blueprints from the Internal Developer Portal and create production-like environments in minutes. No tickets. No manual stitching between infrastructure and pipelines. No bypassing governance to move faster.
Consistency becomes the default. Governance is built in from the start.
Full Lifecycle Control
Environment Management handles more than initial provisioning.
Infrastructure is provisioned through Harness IaCM. Services are deployed through Harness CD. Updates, modifications, and teardown actions are versioned, auditable, and governed within the same system.
Teams can define time-to-live policies for ephemeral environments so they are automatically destroyed when no longer needed. This reduces environment sprawl and controls cloud costs without slowing experimentation.
Harness EM also introduces drift detection. As environments evolve, unintended changes can occur outside declared infrastructure definitions. Drift detection provides visibility into differences between the blueprint and the running environment, allowing teams to detect issues early and respond appropriately. In regulated industries, this visibility is essential for auditability and compliance.
Governance Built In
For enterprises operating at scale, self-service without control is not viable.
Environment Management leverages Harness’s existing project and organization hierarchy, role-based access control, and policy framework. Platform teams can control who creates environments, which blueprints are available to which teams, and what approvals are required for changes. Every lifecycle action is captured in an audit trail.
This balance between autonomy and oversight is critical. Environment Management delivers that balance. Developers gain speed and independence, while enterprises maintain the governance they require.
"Our goal is to make environment creation a simple, single action for developers so they don't have to worry about underlying parameters or pipelines. By moving away from spinning up individual services and using standardized blueprints to orchestrate complete, production-like environments, we remove significant manual effort while ensuring teams only have control over the environments they own."
— Dinesh Lakkaraju, Senior Principal Software Engineer, Boomi
From Portal to Platform
Environment Management represents a shift in how internal developer platforms are built.
Instead of focusing solely on discoverability or one-off self-service actions, it brings lifecycle control, cost governance, and compliance directly into the developer workflow.
Developers can create environments confidently. Platform engineers can encode standards once and reuse them everywhere. Engineering leaders gain visibility into cost, drift, and deployment velocity across the organization.
Environment sprawl and ticket-driven provisioning do not have to be the norm. With Environment Management, environments become governed systems, not manual processes. And with CD, IaCM, and IDP working together, Harness is turning environment control into a core platform capability instead of an afterthought.
This is what real environment management should look like.

AI for GitOps: Tame your Argo Sprawl
Innovation is moving faster than ever, but software delivery has become the ultimate chokepoint. While AI coding assistants have flooded our repositories with an unprecedented volume of code, the teams responsible for actually delivering that code, our Platform and DevOps engineers, are often left drowning in manual toil.
If you’re managing Argo CD at an enterprise scale, you’re painfully familiar with the "Day 2" reality. It can become tab fatigue as a service: jumping between dozens of instances, chasing out-of-sync applications, and manually diffing YAML just to figure out where your configuration drifted.
Today, we are thrilled to introduce AI for Harness GitOps. It’s an agentic intelligence layer designed to help you manage, monitor, and troubleshoot your entire GitOps estate through simple, natural language.
From "ClickOps" to Conversational Control
Standard GitOps tools are excellent at syncing state, but they often lack the high-level orchestration required by complex enterprises. When an application goes out of sync, you shouldn't have to click through multiple tabs and clusters just to find out why.
With AI for GitOps, Harness brings a new level of context-aware, agentic intelligence to your delivery lifecycle:
- Fleet-Wide Troubleshooting: Imagine asking, "I have four out-of-sync apps; are they out of sync for the same reason?" Instead of checking each one manually, the Harness DevOps Agent researches the resource trees across your clusters, identifies a common Kustomization CRD issue, and provides a resolution in seconds.
- Agentic Configuration Management: The AI doesn't just read data; it acts on it. You can now manage the configuration of GitOps applications and Harness resources directly.
- Intelligent Workflow Orchestration: The AI can now modify and optimize the Harness Pipelines that surround your GitOps activities. If a deployment pattern is consistently failing due to timeout issues, you can instruct the agent to "Adjust the orchestration logic in the deployment pipeline to include an automated verification gate" and increase the health check timeout.
- Deep-Dive Diagnostics: Instantly retrieve container logs, track deployment events, and map resource dependencies using natural language prompts.
Why This Matters for the Enterprise
We built this because scaling GitOps shouldn't mean scaling your headcount. Our mission is to provide an Enterprise Control Plane that enhances your existing Argo investment rather than replacing it.
1. Eliminate "Day 2" Toil
Platform engineering teams are often overwhelmed and understaffed. By moving from manual root cause analysis to automated reasoning and active configuration management, we free up engineers to focus on innovation rather than repetitive maintenance tasks.
2. Accelerate MTTR
By leveraging the Harness Software Delivery Knowledge Graph, our AI understands your unique workflows, policies, and ecosystem. It doesn't just show you an error; it explains it in the context of your specific environment and can proactively suggest (or execute) the configuration changes needed to resolve the issue. The goal here is to move the needle on Mean Time to Recovery (MTTR) from hours to minutes.
3. Governance at Speed
Here’s the thing: speed without safety is just a faster way to break things, and work more nights and weekends fixing them. Harness ensures that enterprise-grade governance is built in, not bolted on. Every AI-driven action, including configuration updates and pipeline modifications, is governed by your existing RBAC and OPA (Open Policy Agent) policies, providing an immutable audit trail for every change.
Bottom Line: Ship Faster & Safer with AI
The promise of AI for developers has been held back by the limitations of the deployment pipeline. Harness AI for GitOps bridges that gap, providing a "prompt-to-production" workflow that is finally as fast as the code being written.
Simply put, it's time to stop syncing and start orchestrating. Experience the future of intelligent delivery with Harness.
Want to see it live? Get a demo.

Ansible vs Terraform Explained: Key Differences for Modern Infrastructure Automation
- Ansible and Terraform work well together. Terraform is best for setting up and managing infrastructure, while Ansible is great for configuration, orchestration, and ongoing operations.
- Using Ansible and Terraform together in managed GitOps workflows helps enterprise teams automate infrastructure at scale, keep records for audits, and meet compliance needs. This approach also removes manual steps and reduces configuration drift.
- Harness Continuous Delivery & GitOps offers a single, AI-powered control panel that manages both Terraform and Ansible. It brings together governance, visibility, and policy enforcement for complex deployment pipelines.
If DevOps teams mix up the roles of Ansible and Terraform, deployment pipelines can become unreliable. Manual handoffs slow down changes, and audits may find gaps where responsibilities overlap. Each tool solves different problems, so using them correctly avoids delays and compliance risks.
Are you dealing with scattered provisioning and configuration workflows? Harness Continuous Delivery offers an AI-powered control panel that manages both Terraform and Ansible, giving you unified visibility and policy enforcement.
Ansible vs Terraform: Core Concepts, Strengths, and Trade-Offs
Understanding the differences between Ansible and Terraform starts with recognizing that they solve complementary layers of infrastructure automation. Terraform excels at declaring and managing cloud resources, while Ansible shines at configuring the workloads that run on that infrastructure. Both tools are agentless and complement each other, but their architectural approaches and state-management philosophies yield distinct strengths and limitations.
Terraform: Declarative Provisioning and Lifecycle Management
Terraform specializes in infrastructure provisioning through declarative HashiCorp Configuration Language (HCL). It maintains a state file that tracks every resource it provisions, enabling planned changes and drift detection.
This stateful approach makes Terraform ideal for managing cloud resources like VPCs, databases, and Kubernetes clusters across multiple providers. Research shows Terraform's immutable infrastructure philosophy, replacing rather than modifying resources, reduces configuration drift and improves reproducibility at scale.
Ansible: Agentless Configuration and Orchestration
While Terraform sets up infrastructure, Ansible uses a task-based method with easy-to-read YAML playbooks run over SSH. Ansible does not keep a persistent state. Instead, it uses idempotent modules that give the same results no matter how many times you run them.
This makes Ansible a strong choice for configuring operating systems, deploying applications, and handling ongoing maintenance after the first setup. Studies describe Ansible as a tool for making changes directly on servers, which is useful for managing many machines at once.
State Management: Plans vs Push-Based Execution
The main difference between these tools is how they manage state. Terraform’s state file is the main record, letting you preview changes before making them. This setup helps detect drift and allows rollbacks using Infrastructure as Code tools.
On the other hand, Ansible sends configurations straight to target systems using idempotent tasks. This makes setup easier at first, but you need other ways to prevent drift and check changes in large environments.
Enterprise Scale: Governance and Visibility Matter
For large organizations, choosing the right tool is less important than having good governance and visibility. Using policy-as-code frameworks like Open Policy Agent, keeping audit trails, and using templates for consistency are all key.
Modern platforms provide GitOps control planes that orchestrate both Terraform provisioning and Ansible configuration within governed workflows, ensuring compliance without blocking developer productivity.
When to Choose Terraform for Provisioning at Scale
Terraform is best when you need to manage infrastructure across many cloud providers, environments, and teams. For large organizations with hundreds of services, using Terraform at scale helps ensure reliable and trackable infrastructure delivery.
- Set up cloud resources using Terraform’s plan-and-apply workflow. You can manage identity systems, VPCs, databases, Kubernetes clusters, and storage across AWS, Azure, and GCP. Any resource with an API can be managed as code.
- Enforce reusable standards through Terraform modules and registries that codify your organization's networking patterns, security baselines, and compliance requirements, preventing configuration drift across teams and regions.
- Organize workspaces by environment and team boundaries, following workspace best practices like separating stateful resources (databases) from volatile ones (compute) to minimize blast radius and enable safe parallel development.
- Use policy-as-code tools like OPA or Sentinel to automatically check resource settings, costs, and security before making any changes to production.
- Set up remote state management and deployment pipelines to track every infrastructure change from development to production. This creates permanent audit trails for compliance teams.
- Coordinate complex releases by integrating Terraform provisioning with GitOps workflows that can automatically create ephemeral environments, run verification tests, and promote successful changes across your infrastructure.
Ansible and Terraform Together in GitOps and CI/CD (2026 Best Practices)
The question of whether Ansible and Terraform can be used together has a clear answer: they work best as complementary layers in modern delivery pipelines. Define your cloud infrastructure with Terraform, then configure and orchestrate with Ansible, tying both to Git repositories and promotion workflows to reduce drift and manual handoffs. Terraform actions now support direct integration, enabling a single Terraform apply to dispatch Ansible Event-Driven Automation workflows while keeping inventories synchronized across both tools.
In practice, this setup works best when you use GitOps controllers like ArgoCD to deliver Kubernetes applications, while Terraform manages the clusters and cloud resources underneath.
This separation makes roles clear: Terraform sets up what you need, GitOps delivers your applications, and Ansible takes care of node setup, runbooks, and ongoing tasks that aren’t covered by Kubernetes.
For large organizations, centralize visibility and governance by using golden-path templates, OPA policy checks, and release management. This reduces manual work and helps keep compliance consistent.
Modern platforms solve Argo sprawl by offering a single control panel for managing multi-stage releases, enforcing policy-as-code, and keeping audit trails across all deployments. This helps teams deliver faster while keeping the governance needed for complex, regulated environments.
FAQ: Ansible vs Terraform for Enterprise DevOps Workflows
Enterprise teams managing hundreds of services often face complex decisions about when to use automated infrastructure setup versus hands-on system configuration. These frequently asked questions address practical concerns about combining both approaches while maintaining governance and visibility at scale.
What are the main differences between Ansible and Terraform for enterprise DevOps workflows?
Terraform excels at declarative infrastructure provisioning with state management and drift detection, making it ideal for cloud resources and lifecycle management. Ansible specializes in imperative system configuration, application deployment, and orchestration tasks across existing infrastructure. Air France-KLM successfully combined both, using Terraform for provisioning and Ansible for post-deployment setup, scaling to 7,200 workspaces supporting 450+ teams.
How do Ansible and Terraform compare for automating cloud infrastructure in 2026?
Terraform leads infrastructure provisioning with its declarative model and comprehensive cloud provider support, while Ansible remains the preferred choice for system configuration and Day 2 operations.
Which tool is better for CI/CD pipeline automation: Ansible or Terraform?
Both tools serve different pipeline stages rather than competing directly. Terraform handles infrastructure provisioning steps, while Ansible manages application setup and deployment tasks. Modern CI/CD platforms orchestrate both tools within unified pipelines, using failure strategies and conditional logic to coordinate Terraform applies followed by Ansible configuration runs based on environment and deployment context.
Can Ansible and Terraform be used together for scalable infrastructure management?
Yes, they work exceptionally well together. Enterprise teams typically use Terraform for infrastructure provisioning with S3-backed state management, followed by Ansible for OS setup and application installation. This separation of concerns enables teams to leverage each tool's strengths while maintaining clear boundaries between infrastructure lifecycle and system configuration responsibilities.
How should teams handle state, idempotence, and drift when combining Ansible and Terraform?
Terraform manages infrastructure state through remote backends with drift detection, while Ansible ensures idempotent system setup through declarative playbooks. Teams should establish clear ownership boundaries, use Terraform for stateful cloud resources, and leverage Ansible for application configuration that doesn't require persistent state tracking. Centralized GitOps platforms provide unified visibility across both tools' operations and drift detection.
What governance and compliance practices help standardize changes across 25+ clusters and 50+ repos?
Implement Policy as Code using Open Policy Agent (OPA) to enforce guardrails across both Terraform and Ansible workflows. Pre-written policy sets for compliance frameworks like NIST SP 800-53 accelerate adoption. Centralize policy management, use template-based approaches for consistency, and integrate policy checks into CI/CD pipelines to catch violations before deployment across distributed infrastructure.
From Tools to Outcomes: Standardize with Golden Paths and Governed GitOps
Choosing between Ansible and Terraform becomes simpler when you focus on outcomes rather than tools. Create golden-path templates that codify your Terraform provisioning and Ansible configuration processes together. Enforce OPA policies at every stage to maintain compliance without blocking developer velocity.
Meaningful scale happens when you centralize GitOps visibility to eliminate Argo sprawl across your infrastructure. Use AI to generate pipelines from natural language and automatically verify deployments with intelligent rollback capabilities. Start with one service, establish your workflow patterns, then propagate templates across all environments with automated governance that scales with your team.
Ready to move beyond manual pipeline creation and fragmented GitOps management? Harness Continuous Delivery transforms your Terraform and Ansible pipelines into AI-powered, policy-governed systems that deliver software faster and more securely.

Deterministic by Design: How Harness Grounds AI Agents in Structured Data
When AI agents operate across a multi-module platform like Harness (from CI/CD to DevSecOps to FinOps), the number one goal is to give you answers that are correct, consistent, and grounded in real data. Getting there requires a deliberate architectural choice: when a question can be answered from structured platform data, the agent should use a schema-driven Knowledge Graph rather than raw API calls via MCP.
The principle is simple: if the data is modeled, retrieval should be deterministic.
The Problem with Exposing APIs Directly
MCP (Model Context Protocol) lets LLMs call external tools, including REST and gRPC APIs, by reading tool descriptions and deciding which to invoke. It's flexible and useful, but it comes with a high hidden cost when used as the default path for analytical questions.
To understand why, consider a real question a platform engineering lead might ask:
"Show me the pipelines with the highest failure rate in the last 30 days, and for each one, show which services they deploy and whether those services have any critical security vulnerabilities."
This spans four Harness modules: Pipeline, CD, STO, and SCS. Here's what happens under each approach:
MCP (Raw API) Path
1. The agent must discover which APIs exist across 4 modules → ~2,000 tokens
2. It calls the Pipeline API to list executions → full objects returned, 50+ fields each → ~100,000–150,000 tokens
3. It calls the CD API to correlate services → ~50,000–80,000 tokens
4. It calls the STO API to find vulnerabilities → ~40,000–60,000 tokens
5. It synthesizes everything in context → ~30,000–50,000 more tokens
Total: 5+ LLM calls, ~250,000–350,000 input tokens, high latency. And along the way, the agent may call APIs in the wrong order, miss pagination, misinterpret nested fields, or hallucinate field names.
Knowledge Graph Path
To query the data in our knowledge graph, we built a query language, Harness Query Language (HQL), which is a domain-specific query language designed for querying heterogeneous data sources in the Harness Data Platform.
1. The Type Selector receives the question and picks the right entity types from the schema catalog → ~4,000 tokens total
2. The Query Builder generates 2–3 Harness Query Language (HQL) queries using exact fields, known relationships, and valid aggregations
3. The Knowledge Graph executes those queries and returns structured, aggregated results → ~2,000 tokens
4. The agent summarizes the structured output → ~3,000 tokens
Total: 2–3 LLM calls, ~12,000 input tokens, low latency. That's a 15–25x reduction in token cost, and the answer is deterministic, not guessed.
Why Data Shape Is Everything
The Knowledge Graph stores rich metadata for every field. Take this example:
{
  "name": "duration",
  "field_type": "FIELD_TYPE_LONG",
  "display_name": "Duration",
  "description": "Pipeline execution duration in seconds",
  "unit": "UNIT_CATEGORY_TIME",
  "aggregation_functions": ["SUM", "AVERAGE", "MIN", "MAX", "PERCENTILE"],
  "searchable": true,
  "sortable": true,
  "groupable": false
}
This single definition tells the AI agent everything it needs:
- 1. It's a number, not a string, so duration = 'fast' is invalid
- 2. It's time-based: display in seconds or minutes, not raw integers
- 3. You can aggregate it (SUM, P95), but you can't GROUP BY it. It's continuous
- 4. You can filter and sort by it
Without this metadata, the LLM has to guess. And guessing is where hallucinations happen.
Relationships Don't Need to Be Inferred
Cross-module relationships are explicitly declared in the Knowledge Graph, including which entities connect, which fields to join on, cardinality (one-to-many, many-to-many), and human-readable traversal names. With MCP, the agent has to infer these connections from API documentation and field naming conventions, hoping that pipeline_id in the CD response matches execution_id in the Pipeline response. With the Knowledge Graph, the join is declared and reliable.
Semantic Annotations Enable Fast Routing
Type annotations act as a routing index over the Knowledge Graph:
- 1. Cost/billing questions → types tagged ccm, cost, billing
- 2. Pipeline/CI-CD questions → types tagged pipeline_orchestration
- 3. Security questions → types tagged sto, security
- 4. Compliance questions → types tagged ssca, sbom
This means the agent can select the right 1–3 types out of 80+ without scanning the full API surface of every module. The selection step runs at 0.1 temperature with strict JSON output, making it nearly deterministic.
HQL Is Safer Than Generating API Calls
When an LLM generates an invalid field in HQL, the query fails immediately with a clear, retry-able error, not a silent wrong answer.
A Four-Tier Model for Data Ownership
Not all data can be fully modeled, and MCP still has a role. The right framework is a four-tier data ownership model that determines how each type of data should be accessed:
The practical guidance:
- 1. Default to the Knowledge Graph (Tier 1) for all read, query, and analyze operations
- 2. Use schema-guided bridges (Tier 2) for logs and traces, query the modeled event envelope via HQL, then scope content retrieval using the resulting keys
- 3. Curate Harness-managed integrations (Tier 3) for key external systems, reshape data via API when needed, use MCP passthrough when it's sufficient
- 4. Enable external MCP (Tier 4) as an open extension point, but never optimize for it
- 5. Continuously move data up the tiers, every domain modeled into Tier 1 permanently reduces cost and increases reliability
- 6. Measure determinism, not just capability, a feature that works 95% of the time is worth more than one that works 70% of the time, but "can do anything"
The Bottom Line
The Harness Knowledge Graph and semantic layer aren't just another abstraction; they're the foundation that makes AI orchestration viable across a multi-module platform. By modeling entity types, relationships, field metadata, and aggregation rules upfront, we give AI agents the constraints they need to be deterministic and the structure they need to be efficient.
MCP is a tool for getting things done. The Knowledge Graph is the knowledge needed to understand things. Agents need both, but they need the understanding part first.

Authentication vs Authorization: What’s the Difference and Why It Matters
- Authentication (autnN) proves identity; authorization (authZ) controls what that identity can access. You need both. One without the other leaves gaps.
- In modern apps and microservices, you typically authenticate once but authorize at every sensitive boundary: APIs, services, and individual resources.
- Strong authN/authZ, plus runtime protection, give you the layered defense modern web apps and APIs actually need.
Let's get something out of the way: authentication and authorization are not the same thing.
We know, we know. People swap the two terms constantly. And honestly, it's easy to see why. They both start with "auth," they both deal with security, and they often show up in the same conversations on access control. But if you build or secure software, blurring the line between authentication and authorization is how you end up with a system where everyone is logged in and everyone is an admin. Not great.
Getting this distinction right is really the starting point for securing any modern web app or API with strong access controls. Authentication proves who's calling. Authorization decides what that caller can actually touch. And if you want runtime protection that goes beyond just getting those two right (think API discovery, security testing, and real-time threat defense), that's where a platform like Harness Web Application & API Protection (WAAP) fits in.
But first, let's break this down properly.
What Is Authentication?
Authentication answers one question: "Are you who you say you are?"
That's it. It's the process of verifying that a user, service, or machine is actually who they claim to be. They present something only they should possess; you check it against something you trust. Done.
The factors you'll see in practice usually fall into three buckets:
- Something you know. Passwords, PINs, challenge question answers.
- Something you have. Hardware tokens, authenticator apps, SMS codes, smart cards.
- Something you are. Fingerprints, facial recognition, voice recognition.
Most modern systems don't rely on just one of these. They combine them into multi-factor authentication (MFA). You've done this yourself: type in your password, then confirm with a code from your authenticator app, which is often called two-factor authentication (2FA).
Here's what a typical authentication flow looks like in a web or mobile app:
- A user submits credentials on a login page.
- An identity provider (IdP) or authentication server verifies those credentials.
- If everything checks out, the system creates an authenticated session and issues an authentication token.
- Subsequent requests include that session identifier, the authentication token, or both, depending on the implementation, to prove the user has already been authenticated.
A handy way to think about it: authentication is the front desk of a secure building checking your ID badge before you’re able to walk in.
And this doesn't just apply to end users. In a mature engineering setup, you also want strong authentication to control access to your delivery tools. If you're using Harness Continuous Integration or Harness Continuous Delivery & GitOps, that means tying in SSO and MFA so only verified identities can trigger or modify your pipelines. It's a seemingly small matter, but it prevents big headaches.
What Is Authorization?
Authorization answers a different question entirely: "What are you allowed to do?"
Someone can be fully authenticated — you know exactly who they are — and still be blocked from certain actions. That's authorization doing its job.
There are a few common models for expressing authorization:
- Discretionary Access Control (DAC). The resource owner decides who gets access. Think file sharing permissions.
- Role-Based Access Control (RBAC). Permissions get grouped into roles like "viewer," "editor," or "admin." You assign users roles rather than giving them raw permissions one by one.
- Attribute-Based Access Control (ABAC). Access decisions factor in attributes — department, region, environment, risk score, time of day. More flexible, but more complex.
Some quick examples of authorization in the real world:
- A regular user can view their own profile but can't edit someone else's.
- A team member can see project data, but only the project owner can delete the project.
- An internal service can read from a database but can never write to certain tables.
If authentication is the front desk checking your ID, authorization is the badge reader on each door deciding which rooms your badge actually opens.
You see this play out in any mature platform. Fine-grained RBAC and policy controls determine who can deploy, who can approve changes, and who can modify infrastructure or experiment with configurations. It's not enough to know who someone is; you need to control what they can do.
Authentication vs Authorization: Key Differences at a Glance
Here's a quick comparison table you can bookmark and come back to.
The short version: authentication proves identity, authorization limits power.
How Authentication Works in Modern Applications
Password-based login. The classic username-and-password combo, usually augmented with MFA these days.
Single Sign-On (SSO). You authenticate once against an IdP, then use multiple apps without logging in again. Typically powered by SAML or OpenID Connect. If you've ever clicked "Sign in with Google" at work and had five different tools just... work, that's SSO.
Passwordless authentication. Magic links, WebAuthn, hardware keys, or biometrics. The whole idea is to reduce your dependence on passwords, which — let's be honest — people are terrible at managing.
A few protocols and standards worth knowing:
- OAuth 2.0. A framework for delegated access. Often paired with OpenID Connect for authentication.
- OpenID Connect (OIDC). Sits on top of OAuth 2.0 and defines how to authenticate users and issue ID tokens.
- SAML 2.0. The XML-based standard you'll see all over enterprise SSO setups.
A typical OIDC-based flow looks like this:
- Your application redirects the user to the IdP login page.
- The user authenticates with credentials (and possibly MFA).
- The IdP issues an ID token (who the user is) and often an access token (for API calls).
- Your application validates the token and starts an authenticated session.
But here's the thing people forget: once someone is authenticated, they still need authorization checks for every specific action they try to take. That's the next layer.
And as you automate more of your software delivery lifecycle with tools like Harness CI/CD and Harness Feature Management & Experimentation, enforcing strong authentication for deploys, rollouts, and feature flag operations becomes part of your security posture — not something you bolt on later.
How Authorization Works in Modern Applications
After authentication establishes identity, authorization decides what that identity is actually allowed to do. This is where the real granularity lives.
The key building blocks:
Roles and permissions. Roles like "user," "manager," "admin," "billing," "support." Permissions like "read:projects," "update:billing," "delete:users." You map permissions to roles, and roles to identities. Usually, this is synonymous with permissioning data and functionality so that people can access them, but in the age of AI, identities are increasingly machines.
Policies. Conditional rules, for instance: "Allow role = manager to approve expenses up to $10,000" or "Deny write access to production logs for everyone except SREs." This is where things get interesting.
Scopes. Common in OAuth flows: strings like read:user or write:orders that get granted to clients or tokens.
Here's a practical example. Imagine a project management SaaS:
- Members can create and edit tasks within their own projects.
- Project owners can invite users and manage project-level permissions.
- Organization admins can configure billing and company-wide settings.
In code, authorization checks can live in several places:
- API gateways (route level)
- Middleware (request pipeline)
- Business logic (right before executing an operation),
- External policy engines (dedicated decision services your app queries).
The best practice? Keep these rules streamlined, centralized, and auditable. If access rules are scattered across dozens of gateways, controllers, and routing services, you’ll struggle to track what's actually enforced.
Common Pitfalls When You Mix Up Authentication and Authorization
Confusing authentication and authorization isn't just a terminology slip. It's a security problem that shows up in real systems all the time.
Here are the mistakes we see most often:
- "If you're logged in, you can do everything." The system treats authentication as the only gate. The result? Every authenticated user basically has admin access. This is more common than you'd think, especially in internal tools that start as quick prototypes and never get proper authorization layers.
- Authorization checks only in the UI. The buttons are hidden from certain users, but the underlying APIs don't enforce the same rules. Anyone with network access and a bit of curiosity (or a tool like Postman) can call privileged endpoints directly.
- Permissions scattered across the codebase with no central view. Developers copy-paste authorization checks into controllers, services, and frontends. Over time, it becomes impossible to understand who can actually do what in the system.
- Over-trusting third-party auth. Teams assume that because SSO or social login is in place, authorization is "handled." But authentication-as-a-service doesn't mean authorization is solved. They're separate problems.
The fix is straightforward in concept: treat authentication and authorization as separate, layered concerns; each with their own design, tooling, and governance. Strong identity and access control at the application and platform level, combined with runtime defense from something like Harness WAAP, gives you visibility, prevention, and protection to mitigate threats that inevitably arise.
Authentication vs Authorization in Cloud and Microservices
In distributed cloud-native systems, the authentication vs authorization picture gets more complex. It's not just about human users anymore. It's also services, workloads, and machines, or non-human identities (NHI) talking to each other. Authentication material, often referred to as secrets, can proliferate rapidly.
Here are the patterns that matter:
- API and gateway authentication. Gateways and microgateways verify tokens, certificates, or API keys. Once a request is authenticated, authorization policies determine which backend services or microservices it can actually reach.
- Service-to-service identity. Microservices authenticate to each other using mutual TLS, service accounts, or workload identities. Authorization then defines which services can call which APIs, and with what HTTP methods.
- Fine-grained authorization per resource. Picture a multi-tenant SaaS that authorizes every single request based on tenant, user role, resource owner, and environment (dev, staging, production). That's a lot of decisions happening very fast.
A useful mental model: Authenticate once. Authorize often. Identity gets established at the start of a request. Authorization happens at every gate where something sensitive might occur.
At this scale, you also need visibility. Harness WAAP discovers APIs (including shadow APIs and zombie APIs you didn't even know existed), understands traffic patterns, and applies API-centric protection on top of whatever access controls you already have in place. It's built for cloud-native environments, with deployment options ranging from out-of-band traffic mirroring to inline agents at the gateway level to edge-delivered protection.
Choosing the Right Authentication Strategy
A good authentication strategy balances usability, security, and operational overhead. Here's what to think about:
- MFA by default for admin accounts, financial operations, and anything touching production. MFA should also be a preferred default for customer identity, particularly when controlling access to sensitive or regulated data like PHI or PII.
- Single Sign-On with a central IdP for teams and enterprises. It reduces password reuse and credential fatigue so users stop creating variations of "Summer2024!" across twelve different applications.
- Passwordless options where you can get away with them, such as in customer applications where lower friction and higher usability are paramount. These options cut phishing risk dramatically.
- Token-based auth such as JSON Web Tokens (JWT) and opaque tokens for APIs and mobile apps, with proper expiration and rotation policies.
Some design questions worth asking early:
- Who are your users? Humans, non-human identities, or both?
- How critical is the data or operation they're accessing?
- What regulatory or compliance requirements apply?
- How will you cleanly onboard and offboard users?
On the delivery side, use strong authentication for everything that can change your production system. Production impact should never hang on a shared service account or a weak auth story.
Designing a Solid Authorization Model
Authorization design has a direct impact on how secure and maintainable your system feels day to day. Get it right early, and life is good. Get it wrong, and you'll be untangling spaghetti permissions for years.
Here's what works:
- Use roles, not individual permission lists everywhere. Map your real-world responsibilities to roles, then assign permissions to those roles. It's far easier to reason about "what can an editor do?" than to track permission assignments for 500 individual users.
- Add attributes when roles aren't enough. ABAC patterns shine when you need to factor in department, geography, environment, or risk signals. Not every access decision is as simple as "admin or not admin."
- Enforce least privilege. Start with minimal permissions and add what's actually needed. This sounds obvious, but the default in most organizations is to hand out broad access and hope for the best.
- Centralize your decision logic. Use a consistent policy engine or middleware for all authorization checks, with proper logging and audit trails.
- Review regularly. Roles and policies drift over time. People change teams, projects wind down, new services spin up. Periodic reviews keep your model aligned with reality.
Platforms that bake in policy-as-code, governance, and auditability make this much more practical.
Get Authentication and Authorization Right Early
The difference between authentication and authorization is simple to describe and surprisingly easy to forget in the day-to-day rush of shipping features. Authentication proves identity. Authorization defines and enforces what that identity can do. Two separate problems, two separate layers of defense.
Designing both layers up front — with clear models, strong authentication, and auditable authorization policies — saves you from painful retrofits, compliance surprises, and security incidents down the road.
Then you protect everything you've built at runtime. For full API visibility and real-time defense of your web apps and APIs — without slowing down your engineering teams — take a closer look at Harness Web Application & API Protection (WAAP) and pair it with secure delivery powered by Harness CI/CD.
Book a demo to get started.
FAQ: Authentication vs Authorization
Why is it important to understand authentication vs authorization?
Because they solve different problems. Authentication proves identity. Authorization controls access. If you blur that line, you either block valid users from doing their work or, worse, grant excessive power to anyone who can log in.
Can you have authorization without authentication?
In any secure system, not really. You need an authenticated identity before you can make meaningful authorization decisions. There are anonymous or public access patterns, sure, but those are modeled as very limited authorization cases; not a free pass.
What are some real-world examples of authentication?
Typing a password into a login form. Using Face ID on your phone. Inserting a smart card into a corporate laptop. Scanning a fingerprint to open a secure door. Confirming a login with a one-time code from an authenticator app. If you're proving you are who you say you are, that's authentication.
What are some real-world examples of authorization?
Being able to view a dashboard but not edit system settings. Having read-only access to a database table. Being allowed to approve expenses up to a certain dollar amount. Having permission to deploy to staging but not to production. If the system is deciding what you can and can't do, that's authorization.
How do OAuth 2.0 and OpenID Connect relate to authentication vs authorization?
OAuth 2.0 started primarily as a framework for authorization — specifically, delegated access. OpenID Connect adds a standardized authentication layer on top of OAuth 2.0. In practice, many systems use them both, but they still map cleanly to the separate ideas of "who are you" (authentication) and "what can you do" (authorization).

The pipeline that never reached production
How template-driven CD prevents governance drift
Modern CI/CD platforms allow engineering teams to ship software faster than ever before.
Pipelines complete in minutes. Deployments that once required carefully coordinated release windows now happen dozens of times per day. Platform engineering teams have succeeded in giving developers unprecedented autonomy, enabling them to build, test, and deploy their services with remarkable speed.
Yet in highly regulated environments-especially in the financial services sector-speed alone cannot be the objective.
Control matters. Consistency matters. And perhaps most importantly, auditability matters.
In these environments, the real measure of a successful delivery platform is not only how quickly code moves through a pipeline. It is also how reliably the platform ensures that production changes are controlled, traceable, and compliant with governance standards.
Sometimes the most successful deployment pipeline is the one that never reaches production.
This is the story of how one enterprise platform team redesigned their delivery architecture to ensure that production pipelines remained governed, auditable, and secure by design.
The subtle risk in fast CI/CD platforms
A large financial institution had successfully adopted Harness for CI and CD across multiple engineering teams.
From a delivery perspective, the transformation looked extremely successful. Developers were productive, teams could create pipelines quickly, and deployments flowed smoothly through various non-production environments used for integration testing and validation. From the outside, the platform appeared healthy and efficient.
But during a platform architecture review, a deceptively simple question surfaced:
“What prevents someone from modifying a production pipeline directly?”
There had been no incidents. No production outages had been traced back to pipeline misconfiguration. No alarms had been raised by security or audit teams.
However, when the platform engineers examined the system more closely, they realized something concerning.
Production pipelines could still be modified manually.
In practice this meant governance relied largely on process discipline rather than platform enforcement. Engineers were expected to follow the right process, but the platform itself did not technically prevent deviations. In regulated industries, that is a risky place to be.
The architecture shift: separate authoring from execution
The platform team at the financial institution decided to rethink the delivery architecture entirely. Their redesign was guided by a simple but powerful principle:
Pipelines should be authored in a non-prod organization and executed in the production organization. And, if additional segregation was needed due to compliance, the team could decide to split into two separate accounts.
Authoring and experimentation should happen in a safe environment. Execution should occur in a controlled one.
Instead of creating additional tenants or separate accounts, the platform team decided to go with a dedicated non-prod organization within the same Harness account. This organization effectively acted as a staging environment for pipeline design and validation.
Architecture diagram
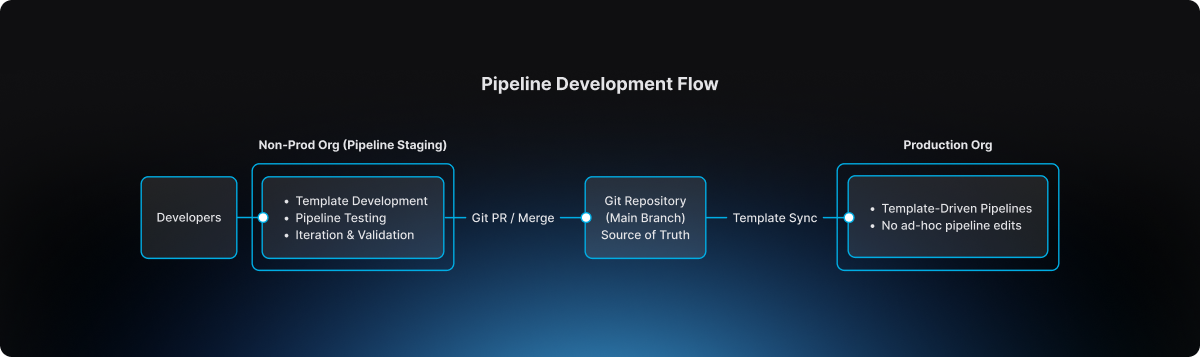
This separation introduced a clear lifecycle for pipeline evolution.
The non-prod organization became the staging environment where pipeline templates could be developed, tested, and refined. Engineers could experiment safely without impacting production governance.
The production organization, by contrast, became an execution environment. Pipelines there were not designed or modified freely. They were consumed from approved templates.
Guardrail #1: production pipelines must use templates
The first guardrail introduced by the platform team was straightforward but powerful.
Production pipelines must always be created from account-level templates.
Handcrafted pipelines were no longer allowed. Project-level template shortcuts were also prohibited, ensuring that governance could not be bypassed unintentionally.
This rule was enforced directly through OPA policies in Harness.
Example policy
package harness.cicd.pipeline

deny[msg] {
  template_scope := input.pipeline.template.scope
  template_scope != "account"
  msg = "pipeline can only be created from account level pipeline template"
}
This policy ensured that production pipelines were standardized by design. Engineers could not create or modify arbitrary pipelines inside the production organization. Instead, they were required to build pipelines by selecting from approved templates that had been validated by the platform team.
As a result, production pipelines ceased to be ad-hoc configurations. They became governed platform artifacts.
Guardrail #2: governance starts in the non-prod organization
Blocking unsafe pipelines in production was only part of the solution.
The platform team realized it would be even more effective to prevent non-compliant pipelines earlier in the lifecycle.
To accomplish this, they implemented structural guardrails within the non-prod organization used for pipeline staging. Templates could not even be saved unless they satisfied specific structural requirements defined by policy.
For example, templates were required to include mandatory stages, compliance checkpoints, and evidence collection steps necessary for audit traceability.
Example policy
package harness.ci_cd

deny[msg] {
  input.templates[_].stages == null
  msg = "Template must have necessary stages defined"
}

deny[msg] {
  some i
  stages := input.templates[i].stages
  stages == [Evidence_Collection]
  msg = "Template must have necessary stages defined"
}
These guardrails ensured that every template contained required compliance stages such as Evidence Collection, making it impossible for teams to bypass mandatory governance steps during pipeline design.
Governance, in other words, became embedded directly into the pipeline architecture itself.
The source of truth: Git
The next question the platform team addressed was where the canonical version of pipeline templates should reside.
The answer was clear: Git must become the source of truth.
Every template intended for production usage lived inside a repository where the main branch represented the official release line.
Direct pushes to the main branch were blocked. All changes required pull requests, and pull requests themselves were subject to approval workflows that mirrored enterprise change management practices.
Governance flow
.png)
This model introduced peer review, immutable change history, and a clear traceability chain connecting pipeline changes to formal change management records.
For auditors and platform leaders alike, this was a significant improvement.
The promotion workflow
Once governance mechanisms were in place, the promotion workflow itself became predictable and repeatable.
Engineers first authored and validated templates within the non-prod organization used for pipeline staging. There they could test pipelines using real deployments in controlled non-production environments.
The typical delivery flow followed a familiar sequence:
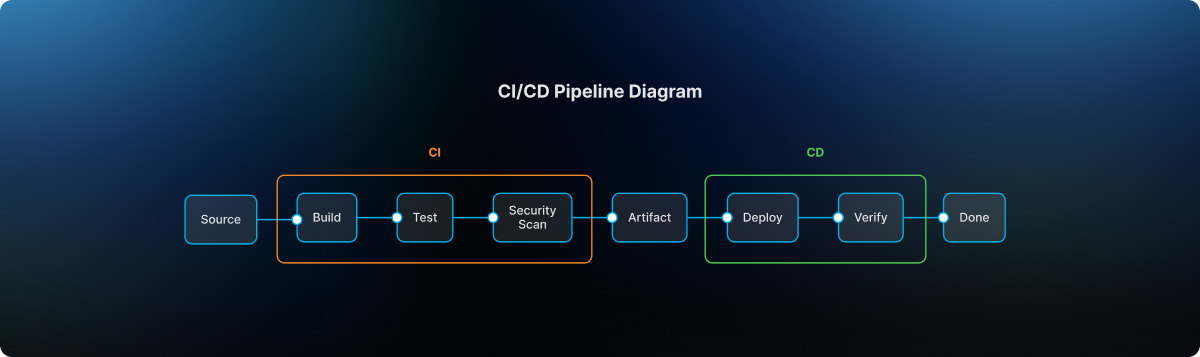
After validation, the template definition was committed to Git through a branch and promoted through a pull request. Required approvals ensured that platform engineers, security teams, and change management authorities could review the change before it reached the release line.
Once merged into main, the approved template became available for pipelines running in the production organization. Platform administrators ensured that naming conventions and version identifiers remained consistent so that teams consuming the template could easily track its evolution.
Finally, product teams created their production pipelines simply by selecting the approved template. Any attempt to bypass the template mechanism was automatically rejected by policy enforcement
The day the model proved its value
Several months after the new architecture had been implemented, an engineer attempted to modify a deployment pipeline directly inside the production organization.
Under the previous architecture, that change would have succeeded immediately.
But now the platform rejected it. The pipeline violated the OPA rule because it was not created from an approved account-level template.
Instead of modifying the pipeline directly, the engineer followed the intended process: updating the template within the non-prod organization, submitting a pull request, obtaining the necessary approvals, merging the change to Git main, and then consuming the updated template in production.
The system had behaved exactly as intended. It prevented uncontrolled change in production.
Why this model works
The architecture introduced by the large financial institution delivered several key guarantees.
Production pipelines are standardized because they originate only from platform-approved templates. Governance is preserved because Git main serves as the official release line for pipeline definitions. Auditability improves dramatically because every pipeline change can be traced back to a pull request and associated change management approval. Finally, platform administrators retain the ability to control how templates evolve and how they are consumed in production environments.
The lesson for platform teams
Pipelines are often treated as simple automation scripts.
In reality they represent critical production infrastructure.
They define how code moves through the delivery system, how security scans are executed, how compliance evidence is collected, and ultimately how deployments reach production environments. If pipeline creation is uncontrolled, the entire delivery system becomes fragile.
The financial institution solved this problem with a remarkably simple model. Pipelines are built in the non-prod staging organization. Templates are promoted through Git governance workflows. Production pipelines consume those approved templates.
Nothing more. Nothing less.
Final takeaway
Modern CI/CD platforms have dramatically accelerated the speed of software delivery.
But in regulated environments, the true achievement lies elsewhere. It lies in building a platform where developers move quickly, security remains embedded within the delivery workflow, governance is enforced automatically, and production environments remain protected from uncontrolled change.
That is not just CI/CD. That is platform engineering done right.

Agentic Coding And The New Role Of Internal Developer Portals
- Agentic coding turns AI from fancy autocomplete into something closer to a junior engineer — one that can plan work, execute it, run tests, debug failures, and iterate, all using your actual tools and environments.
- Internal Developer Portals (IDPs) become the control plane that gives those agents the map, the rules, and the guardrails they need to work safely at scale.
- Getting “agent-ready” isn’t about buying the shiniest new tool. It’s about having trustworthy metadata, standardized golden paths, executable policies, and programmatic access to your platform capabilities. A pretty portal UI alone won’t cut it.
Here’s the thing about agentic coding: it’s what happens when AI stops suggesting code and starts doing the work. You describe a high-level goal — something like “add email verification to user signup” — and an AI agent takes it from there. It plans the approach, digs through the repo, edits files, runs tests, debugs what breaks, and keeps going until the job is done. You’re not approving one autocomplete suggestion at a time anymore. You’re supervising an autonomous workflow that’s plugged into your actual CI pipelines, your docs, your tickets, your environments.
That kind of autonomy can’t run on top of chaos. It needs a structured, trusted surface where services, workflows, and policies are laid out clearly. And that’s exactly where the Internal Developer Portal stops being “a catalog and some links” and starts acting as the control plane for both humans and agents.
If you want that control plane today, Harness Internal Developer Portal gives you the service catalog, golden paths, policies, and orchestration layer you need to adopt agentic coding without losing sleep.
What Does Agentic Coding Actually Look Like?
Traditional AI-assisted coding is reactive. You write a prompt, it completes the line, and you stay firmly in the driver’s seat.
Agentic coding flips that dynamic. The industry is converging on a few defining traits:
You give the agent a goal, not a line of code. Something like: “Implement user signup with email verification.”
From there, the agent explores your codebase, reads documentation, and puts together a plan. It edits or creates files, runs tests, and if something breaks, it debugs. It keeps looping through that cycle until the goal is met — or until guardrails tell it to stop.
The big shift here is autonomy combined with tool use. These agents are wired into your repo, your CI pipelines, your docs, your ticketing system — sometimes even your infrastructure. They decide what to do next based on outcomes, much like a junior engineer working through a ticket queue.
Why Agentic Coding Needs An Internal Developer Portal
Here’s something anyone who’s managed a team already knows: people do their best work in structured environments. They struggle in ambiguous ones. Agents are no different.
The major cloud and security vendors are all saying the same thing: agentic systems work best when they have well-defined tools, schemas, and policies to operate within. An IDP provides exactly that structure.
- The service catalog becomes the map.
Ownership, dependencies, environments, APIs, lifecycle stage, repo links — it’s all there. When an agent changes a shared library, it can actually reason about which downstream services might be affected. Without that metadata? You’re flying blind.
- Workflows and golden paths keep agents on the rails.
CI/CD pipelines, infra provisioning, incident playbooks, and compliance checks — in Harness, these are defined as reusable platform flows. Agents trigger the approved flows instead of improvising their own, which is how you keep actions compliant and predictable.
- Policy and governance become executable, not just documented.
OPA policies, RBAC, freeze windows, required checks — they become rules the system enforces automatically. This matters because agents don’t “remember” tribal knowledge. They run code. If the rule isn’t encoded, it doesn’t exist to them.
Put it all together, and the portal becomes both the system of record and the operations surface. Humans click buttons or fill out forms. Agents call the same flows through APIs. Same guardrails, same audit trail, different interface.
New Capabilities — And New Risks — For Platform Teams
Once agents can act through an IDP, some genuinely useful workflows open up.
- Environment provisioning is a natural fit.
An agent reads environment templates from the portal, fills in the parameters, spins up a new sandbox or preview environment, and registers it back into the catalog. No tickets, no waiting.
- Routine deployments work well too — at least for low-risk services with strong test coverage and solid observability.
An agent can promote builds along a golden path, run automated checks, and roll back if anomaly detection flags something. Harness’s delivery platform already supports this kind of automated pipeline orchestration.
- Dependency impact analysis is where things get really interesting.
Before upgrading a shared library, the agent queries the catalog for dependents, opens PRs across those services, runs pipeline checks, and reports back with results. That’s hours of toil, automated.
But let’s be honest about the risks, too. Every serious security analysis of agentic coding points to the same concerns:
- Scaled errors are the big one. A misconfigured agent can update dozens of services in minutes. If your templates and policies are optional — just suggestions that people (and now agents) can ignore — the agent will amplify every inconsistency in your system.
- Configuration drift sneaks in when agents bypass golden paths and call underlying tools directly. Your carefully designed “standards” become more like… suggestions.
- Security and compliance gaps emerge when you can’t prove what an agent did and why. In regulated environments, that’s a dealbreaker.
Harness IDP addresses these risks with enforced templates, auditable workflows, drift detection, OPA policies, and granular RBAC. Each agent identity only touches what it’s explicitly allowed to — same as you’d scope permissions for any engineer.
An Agentic Coding Maturity Model For Your Portal
Nobody goes from “we have a portal” to “AI is co-piloting our delivery” overnight. And honestly, trying to skip steps is how you end up with agents making a mess. Maturity matters more than the shiny new feature.
Here’s a practical way to think about the journey:
Stage 0: Portal As Brochure.
The service catalog is incomplete. Templates are optional. Workflows live in wikis and docs rather than automation. If you let an agent loose at this stage, it’s going to expose every gap you’ve been meaning to fix.
Stage 1: Trusted Metadata.
Every service has clear ownership, lifecycle status, environments, and repo links. The catalog is accurate, and people actually maintain it. This is where humans benefit first — and agents will benefit later.
Stage 2: Standardized Golden Paths.
You’ve built production-ready templates for your common service types, with CI, observability, security, and infra defaults baked in. Both developers and agents start from these paths, not from scratch.
Stage 3: Executable Guardrails.
Policies for licenses, infra validation, PII handling, and deployment checks are encoded directly into your CI and portal workflows. Gates fire automatically — nobody needs to “remember” them.
Stage 4: AI-Governed Control Plane.
The IDP is a unified control plane for humans and agents alike. Every capability can be invoked programmatically. Autonomy levels are tuned based on incident reviews and audits. This is where agentic coding really shines.
Harness IDP is designed to help teams move along this curve — from organizing metadata, to defining golden paths, to enforcing policy-as-code, and finally to safely plugging in agents.
Getting Agent-Ready In The Next 6–12 Months
If you want to be running agentic coding workflows on top of your IDP within a year, work backwards from what agents actually need.
On the technical side:
Clean up your service catalog and make it your source of truth. If the metadata is stale or incomplete, agents will make bad decisions based on bad data.
Wrap your core platform operations in reusable flows and templates instead of one-off scripts. Agents need repeatable, well-defined actions to call — not artisanal shell scripts that only one person understands.
Encode your key policies into CI and portal workflows so they run on every relevant change. If a check matters, automate it.
On the cultural side:
Treat agents like junior engineers, not magic. They need code review, bounded scopes, and feedback loops — just like any new hire.
Establish clear ownership for portal data quality. If nobody owns the metadata, the agent’s output will be just as fuzzy.
On the process side:
Start small. Pick narrow, low-risk workflows like preview environment creation or doc updates. Let the team build confidence.
Measure impact with straightforward DevEx metrics: how long do developers wait for environments? What’s your time-to-merge? Deployment success rates?
Expand agent scope gradually — only where guardrails and signal quality are genuinely strong.
The end result is an IDP that can safely host agentic coding experiments without turning your platform into a free-for-all.
Turn Your IDP Into An Agentic Control Plane
Agentic coding is already reshaping how software gets built. The question isn’t whether agents will touch your delivery workflows — they will. The real question is whether they’ll operate inside a governed control plane or out on the edges of your tooling where nobody’s watching.
An Internal Developer Portal that works as a real control plane — not just a dashboard — is how you keep humans productive and agents accountable. Harness IDP gives you that: trusted metadata, golden paths, executable policies, and platform flows that work for human clicks and agent API calls alike.
Book a demo with Harness and see how it works in practice.
Agentic Coding FAQ
What is agentic coding?
Agentic coding is AI-assisted development where an autonomous agent plans, executes, and iterates on multi-step coding tasks using your real tools and environments. Think of it less like autocomplete and more like handing a well-scoped ticket to a junior engineer who happens to work very, very fast.
How is agentic coding different from traditional AI code assistants?
Traditional assistants respond to each prompt in isolation — you stay in tight control the whole time. With agentic coding, the AI pursues a goal end-to-end: editing files, running tests, interpreting results, and making follow-up decisions on its own. You supervise rather than micromanage.
Why does agentic coding need an Internal Developer Portal?
Because agents need accurate metadata, standardized workflows, and encoded policies to act safely. An IDP provides that structured map of services, environments, and golden paths that agents can actually navigate and operate within. Without it, you’re giving an autonomous system the keys to a disorganized house.
What are the main risks of agentic coding?
The biggest concerns are scaled mistakes (one bad config propagated across dozens of services), configuration drift (agents bypassing your golden paths), and security gaps (lack of audit trails and policy enforcement). These risks grow fast in complex or regulated environments.
How can Harness help teams adopt agentic coding safely?
Harness Internal Developer Portal centralizes service metadata, enforces golden paths and policy-as-code, and exposes reusable platform flows. Together, these create the guardrails and observability you need to introduce agentic coding with confidence rather than anxiety.

Introducing Zero Trust Architecture for Software Delivery
For the world’s largest financial institutions, places like Citi and National Australia Bank, shipping code fast is just part of the job. But at that scale, speed is nothing without a rock-solid security foundation. It’s the non-negotiable starting point for every release.
Most Harness users believe they are fully covered by our fine-grained Role-Based Access Control (RBAC) and Open Policy Agent (OPA). These are critical layers, but they share a common assumption: they trust the user or the process once the initial criteria are met. If you let someone control and execute a shell script, you’ve trusted them to a great extent.
But what happens when the person with the "right" permissions decides to go rogue? Or when a compromised account attempts to inject a malicious script into a trusted pipeline?
Harness is changing the security paradigm by moving beyond Policy as Code to a true Zero Trust model for your delivery infrastructure.
The Challenge: When Permissions Aren't Enough
Traditional security models focus on the "Front Door." Once an employee is authenticated and their role is verified, the system trusts their actions. In a modern CI/CD environment, this means an engineer with "Edit" and "Execute" rights can potentially run arbitrary scripts on your infrastructure.
If that employee goes rogue or their credentials are stolen, RBAC won't stop them. OPA can control whether shell scripts are allowed at all, but it often struggles to parse the intent of a custom shell script in real-time.
The reality is that verify-at-the-door is a legacy mindset. We need to verify at execution time. CI/CD platforms are a supply-chain target that are often targeted. The recent attack against the Checkmarx GitHub Action has been a painful reminder of the lesson the Solarwinds fiasco should have taught the industry.
Introducing Harness Zero Trust
Harness Zero Trust is a new architectural layer that acts as a mandatory "interruption" service at the most critical point: the Harness Delegate (our lightweight runner in your infrastructure).
Instead of the Delegate simply executing tasks authorized by the control plane, it now operates on a "Never Trust, Always Verify" basis.
How It Works: The Final Line of Defense
When Zero Trust is enabled, the Harness Delegate pauses before executing any task. It sends the full execution context to a Zero Trust Validator, a service hosted and controlled by your security team.
This context includes:
- User Identity: Who triggered the action?
- Task Specifics: Exactly what is the Delegate being asked to do?
- Script Content: The full body of any shell scripts.
- Environment Variables: The inputs and secrets being injected into the task.
The Delegate waits a moment. Only if the validator returns a "True" signal does the task proceed. If the signal is "False," the execution is killed instantly.
Why This Matters for Enterprise DevSecOps
By moving validation to the Delegate level, we provide a "Last Line of Defense" that hits several key enterprise requirements:
- Rogue Employee Protection: Even if a user has the rights to run a pipeline, your security service can flag suspicious patterns (like a script attempting to delete a production database or exfiltrate data) and stop it before it starts.
- Architectural Superiority: While competitors struggle with stability and baseline security, Harness is doubling down on a hardened architecture. RBAC protects the door; OPA governs the "what"; and Zero Trust validates the "how."
- Custom Judgement: Because Harness sends the complete task details, you can point this validator at a customer algorithm or an AI-powered security tool to judge the "safety" of scripts in real-time. Essentially, you are peer-reviewing every line of automation at execution time.
The Takeaway
We built this capability alongside some of the world's most regulated institutions to ensure it doesn't become a bottleneck. It’s designed to be a silent guardian. It shuts down the 1% of rogue actions while the other 99% of your engineers continue to innovate at high velocity.
The bottom line: at Harness, we believe that the promise of AI-accelerated coding must be met with an equally advanced delivery safety net. We’re building out that safety net every day. Zero Trust is the next piece.

From Chaos to Confidence: Debunking the 3 Biggest Myths of Chaos Engineering
Many organizations hesitate to adopt chaos engineering because of persistent misconceptions that make it seem reckless or reserved for tech giants.
But the reality is far more practical and far more accessible.
Drawing from experience building the chaos engineering program at Target.com, Matt Schillerstrom breaks down the three biggest myths holding teams back and what is actually true.
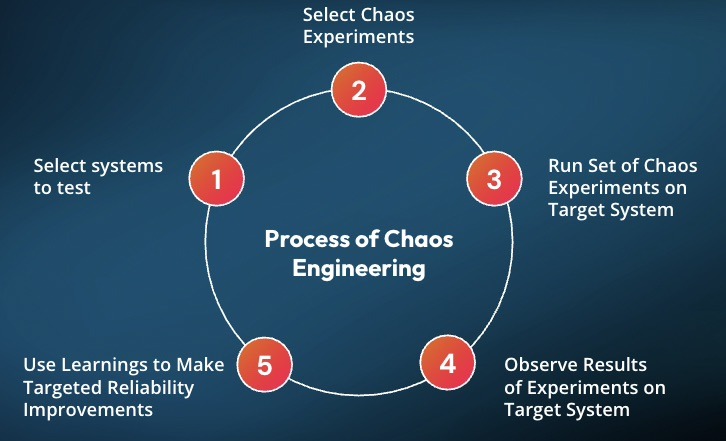
Myth 1: Chaos Engineering Means Random Failure
The fear is understandable. Engineers unplugging servers, triggering outages, and hoping for the best.
The Reality: Chaos engineering is not random. It is disciplined, which helps teams build trust and confidence in their systems.
It is built on hypothesis-driven experimentation. Every test starts with a clear expectation: what should happen if this component fails?
Instead of breaking things randomly, teams run controlled experiments. For example, stopping one out of ten servers to observe how the system adapts. These scenarios are planned, reviewed, and executed with intention.
At Target, when Matt was working with engineering teams, they would learn something before running a test by getting the whole team aligned on the experiment's hypothesis. It would require teams to review their architecture diagrams, documentation, and runbooks, often revealing issues before a test was started.
The goal is not disruption. The goal is learning.
Today, teams are taking this further with AI, automatically identifying resilience risks and generating experiments before issues reach production.
Read how this works in practice: AI-Powered Resilience Testing with Harness MCP Server and Windsurf
Myth 2: It’s Only for FAANG Companies
Chaos engineering is often associated with Netflix, Google, and other hyperscalers. That makes it feel out of reach.
The Reality: You do not need massive scale to get meaningful value.
You can start small today.
A simple experiment, such as increasing memory utilization on a single service, can reveal whether your auto-scaling actually works. These small tests validate that the resilience mechanisms you are using will function when issues happen, rather than having your customers impacted.
What matters is not scale. What matters is consistency and learning how your system behaves under stress.
Myth 3: Chaos Engineering Replaces Traditional Testing
Some teams worry that adopting chaos engineering means replacing QA or existing testing workflows.
The Reality: Chaos engineering strengthens what you already do.
At Target, chaos experiments were layered into monthly load testing. While simulating peak traffic, failure scenarios such as payment authorization latency were introduced to observe system behavior under real pressure.
This approach does not replace testing. It makes it more realistic and more valuable.
Build Confidence, Not Chaos
Chaos engineering is not about breaking systems. It is about understanding them.
When teams move from ad hoc testing to small, continuous, hypothesis-driven experiments, they gain something far more valuable than test results. They gain confidence.
Confidence that their systems will behave as expected.
Confidence that failures will not become outages.
Confidence that they are ready for the unexpected.
See It in Action
If you are thinking about chaos engineering, the best way to understand it is to start.
Harness helps teams safely design, run, and learn from controlled chaos experiments without putting production at risk.
Want to try your first chaos engineering test? Sign up for your free Resilience Testing account today. Prefer a hands-on demo with an expert? Click here for a personalized demo.
.png)
Get Ship Done: Everything We Shipped in March 2026
According to our AI Velocity Paradox report, many engineering teams say AI has made them ship code faster, but quality and security issues have exasperated across the SDLC. That gap is the whole story. AI coding assistants are compressing the time to write and commit code, but the bottlenecks have just moved downstream: into builds, security scans, deployment pipelines, incident response, and cost controls. In March, we shipped 55 features, most of them targeting exactly those downstream stages. This is what closed-loop AI velocity looks like.
AI Built Into Every Step
Harness MCP v2 (Early Preview)
The next version of the Harness MCP server is rolling out to early access customers. It ships with 10 unified tools, CRUD and execute support across 119+ resource types, and 26 built-in prompt templates that chain tools together for multi-step workflows, debug a pipeline failure, deploy an app, review DORA metrics, and triage vulnerabilities. Install it in one command: npx harness-mcp-v2. No cloning, no local setup.
Learn more about how we redesigned our MCP server to be more agentic AI-friendly.

AI Skills for Your IDE
A new skills repository sits on top of MCP to let AI coding assistants, such as Claude Code, Cursor, and OpenAI Codex, act within Harness without the user needing to know Harness. Skills are structured instruction files. "Create a CI pipeline for my Node.js app" turns into the right tool calls automatically.
GitOps Troubleshooting via AI
The AI velocity paradox doesn't end at deployment. It continues into operations, especially in systems like GitOps, where small configuration issues can cascade quickly.
Harness AI now understands GitOps entities and can detect misconfigurations in manifests, identify missing dependencies or clusters, diagnose connectivity issues, and suggest fixes in context. With the expansion of the "Ask AI" assistant into GitOps, teams can troubleshoot issues directly where they occur, not after the fact.
Watch GitOps and Harness AI in action:
AI Chat: OPA Policy Enforcement on Generated Resources
With Harness AI, users can now do much more around Open Policy Agent (OPA). AI-driven entity creation is now automatically evaluated against your organization's Open Policy Agent policies, so when the agent generates a Harness resource, it checks compliance in real time and surfaces validation messages directly in the chat. This means governance isn't a post-creation audit; it's baked into the moment of creation.

Security Baked Into the Pipeline
EPSS-Based Vulnerability Prioritization
Vulnerability prioritization now includes EPSS (Exploit Prediction Scoring System) scores alongside CVSS severity. EPSS predicts the probability that a CVE will be exploited in the wild within 30 days. Teams can stop triaging by theoretical severity and focus on the vulnerabilities that attackers are actively targeting.

Manual Severity Override
Security teams can now adjust scanner-assigned severity levels when the tool's rating doesn't match real-world risk in their environment. Override the score, add context, and move on.
Full OSS Dependency Visibility
Supply Chain Security now covers both direct and transitive (indirect) open source dependencies in code repositories, with vulnerability intelligence from the Qwiet database. When a vulnerable child dependency is three layers deep, you can see exactly where it was introduced and trace the path to fix it.
AutoFix Directly in GitHub Pull Requests
A new GitHub App delivers AI-generated security fixes from Harness SAST and SCA scanning directly inside the GitHub PR workflow. Developers get automated fix suggestions and can have a back-and-forth conversation about the remediation without leaving GitHub.
AutoFix for Harness Code Repositories
The same AutoFix capability now works in Harness Code. SAST and SCA scans automatically open pull requests with AI-generated fixes, including plain-language explanations of what was changed and why.
Dependency Firewall
The Artifact Registry Dependency Firewall now ships with a full Harness CLI, letting developers audit dependencies for npm, Python, Maven, NuGet, and Go packages before they hit a build. Maven and Gradle plugins are included. In testing against a multi-module Maven project, artifact upload time improved 10x compared to standard flows.
AI Discovery for Your AI Ecosystem
Automatically discovers AI assets across models, APIs, and MCP servers in your environment. Provides deep visibility into prompts, responses, tool usage, and data flows, with continuous posture evaluation and centralized governance controls.
AI Firewall (Beta)
Runtime protection for AI applications: detects prompt injection, model misuse, unsafe outputs, and data leakage across multi-hop AI application flows with policy-driven enforcement.
DAST AI Testing (Beta)
DAST for LLM applications covering the OWASP LLM Top 10 vulnerability categories. Runs during development, before production.
Secure AI Coding in Cursor, Windsurf, and Claude (Beta)
Real-time security scanning now runs inside AI-native development environments. The existing IDE extension handles the integration; no new tooling is required.
Deploy Faster and More Reliably
Release Orchestration
Release Orchestration replaces Slack threads, spreadsheets, and war-room calls that still coordinate most multi-team releases. Services and the teams supporting them move through shared orchestration logic with the same controls, gates, and sequence, so a release behaves like a system rather than a series of handoffs. And everything is seamlessly integrated with Harness Continuous Delivery, rather than in a separate tool.

Feature Flags as First-Class Pipeline Steps
14 out-of-the-box feature flag steps are now available in the step library: create flags, manage targets, set allocations, trigger kill switches. Combine them with approvals and manual gates to coordinate releases exactly when you want them to happen. This improved pipeline and policy support for feature flags and experimentation enables teams to deploy safely, and release progressively to the right users even though the number of releases is increasing due to AI-generated code. They can quickly measure impact on technical and business metrics, and stop or roll back when results are off track. All of this within a familiar Harness user interface they are already using for CI/CD.
Warehouse-Native Feature Management and Experimentation
Warehouse-Native Feature Management and Experimentation lets teams test features and measure business impact directly with data warehouses like Snowflake and Redshift, without ETL pipelines or shadow infrastructure. This way they can keep PII and behavioral data inside governed environments for compliance and security.
Feature Flag Archiving
Retire feature flags without deleting them. Archived flags stop being sent to SDKs and disappear from default views, but all historical data, impressions, configurations, and audit logs are preserved for compliance and analysis.
ECS Scale Step
Scale ECS services up or down without triggering a full deployment. This is a dedicated step; it doesn't touch your service definition or redeploy anything.
ECS Scheduled Actions
Define time-based auto-scaling policies for ECS services directly in Harness, using the new EcsScheduledActionDefinition manifest type.
Helm Values Overrides in Service Hooks
Native Helm deployments can now expose Harness values overrides to service hooks before Helm runs. Use this to decrypt override files (e.g., with SOPS) in a pre-run hook.
Host Groups for WinRM Deployments
Physical data center WinRM deployments can now assign independent credentials to different groups of hosts within a single infrastructure definition. Unblocks environments running Just Enough Administration (JEA) configurations where each server group has distinct endpoint settings.
Google Cloud Storage for MIG Manifests
Managed Instance Group deployments on GCP can now pull manifests and templates from Google Cloud Storage.
Pipeline Notifications for Approval Waits
Pipelines now send notifications the moment they pause for user input, such as approvals, manual interventions, or runtime inputs.
Faster Builds
CPU and Memory Metrics in Build Execution View
Build stages now display real-time CPU and memory usage directly in the execution view. Use it to right-size infrastructure and troubleshoot memory pressure before it causes failures.
Branch-Based Build Version Counters
Build numbers now track independently per branch. Teams running parallel branches no longer share a global counter.
Real-Time Step Status for Container Step Groups
Container-based step groups report step status in real time during execution rather than waiting for the group to complete.
Cache Intelligence: Azure Blob Storage
Build caches can now be stored and retrieved from Azure Blob Storage with principal authentication and OIDC-based access.
Cache Intelligence: Go Builds on Linux
Automatic dependency caching is now available for Go projects building on Linux.
Docker Proxy Auto-Detection
The Docker Build and Push plugins now automatically detect and pass HARNESS_HTTP_PROXY, HARNESS_HTTPS_PROXY, and HARNESS_NO_PROXY as Docker build arguments. No manual proxy configuration needed.
API and Runtime Security
Traceable Now Embedded in Harness
Traceable's API security capabilities, discovery, inventory, threat detection, and runtime protection are now accessible directly in the Harness UI as a native embedded experience, without switching tools or tabs.
Self-Service Bot and Abuse Protection Policies
Bot and abuse protection now supports self-serve policy templates. The Velocity/Aggregation template lets you write rules like "Flag all users who have logged in from more than 5 countries in the last 30 minutes" or "Flag bot IPs distributing attacks across more than 10 countries over 24 hours." Covers both fast-moving and slow distributed attack patterns.
Dynamic Payload Matching in Custom API Policies
Custom policies, such as signature, rate-limiting, DLP, enumeration, and exclusion, now support dynamic payload matching. Both sides of a comparison can reference live values from the request, response, or extracted attributes.
Incident Response, Upgraded
Native ServiceNow Actions in Runbooks
Runbooks can now create ServiceNow incidents, update records, and add comments natively, without custom webhook configuration. Fields pull dynamically from your ServiceNow instance. Previously, this required PagerDuty or OpsGenie to accomplish via custom integrations; it's now first-class.
Reusable Webhook Templates
Configure a webhook once, save it as a template, and reuse it across integrations. Templates are organization-scoped and use copy-on-write, i.e., changes don't propagate to existing webhooks.
Named Alert Rules
Alert rules now support custom display names. Identify and manage rules by name instead of opaque identifiers.
Active Pages View for On-Call
On-call users can now see all currently active pages from a single view: status, assigned responders, escalation progress, and acknowledgment state in one table.
Cloud Cost Visibility
Partial Savings Auto-Inference
The savings inference engine now detects partial infrastructure changes, not just fully realized ones. Track savings as they accumulate, not only after a recommendation is fully implemented.
AWS Cost Optimization Hub Integration
Recommendations now expand across all major AWS resource types. Moving from Cost Explorer Hub to Cost Optimization Hub, with AWS costs shown as net-amortized directly from the console.
Anomaly Whitelisting for Reserved Instances and Savings Plans
Whitelist expected RI/SP billing events, renewals, purchases, and adjustments, to reduce false-positive noise in anomaly detection.
Budgets Decoupled from Perspectives
Budgets no longer require a Perspective to exist first. They're now based on Cost Categories, making them importable into BI dashboards and usable in more governance contexts.
Cluster Orchestrator Savings Report
A read-only savings report shows projected savings before Cluster Orchestration is enabled and actual savings after. Understand the value before committing, then track realized results over time.
Node Pool Recommendations with Cloud Billing Tags
Node pool recommendations now surface AWS cost allocation and environment tags alongside Kubernetes node labels, giving recommendations more operational context.
Database Changes Without the Drama
Snowflake Support
Database DevOps, now with Snowflake support, brings schema changes into the same pipeline as application code, so the two move together through the same controls with the same auditability. If a rollback is needed, the application and database schema can rollback together seamlessly. This matters especially for teams building AI applications on warehouse data, where schema changes are increasingly frequent and consequential.
Online Schema Changes for MySQL with Percona Toolkit
Run online schema changes on MySQL with zero table locks. Enable it from the DB schema edit dialog.
Keyless Auth for Google Spanner
Authenticate to Cloud Spanner using Workload Identity, eliminating service account keys from Spanner deployments entirely.
Code Management
Repo Forking
Harness Code now supports repository forking. Developers can fork any repo, make changes, and open a pull request back to the upstream source, the same workflow as GitHub.
Git LFS Upload Performance
Large file uploads via Git LFS are faster. File content now streams during OID calculation instead of buffering in memory.
Automated Testing
On the testing/AI Test Automation side, updates focused on handling complexity at scale: better organization with nested test tasks, improved traceability with Jira integration, more flexible AI-driven test creation, and UX improvements for navigating large test suites. Because if AI increases the volume of changes, testing systems need to become more adaptive, not more manual.
Other Updates
- Platform: Proactive email alerts at 80%, 95%, and 100% of account resource limits (users, projects, connectors, secrets, roles) with up to 5 configurable recipients.
- Build logs now display the actual machine size name (e.g., medium) instead of the internal flex label.
- Chaos Engineering: Splunk Observability probe support, user-defined variables, load test integration, native Windows network chaos faults, Linux chaos faults (network, API, JVM, process, service, DNS, disk fill), and Disaster Recovery component support added.
- AI SRE documentation restructured into separate tracks for administrators and incident responders.
Conclusion
The throughput you see here, 55 features in 31 days, reflects what happens when the AI acceleration loop closes end to end. Teams writing code faster with AI agents need pipelines, security scans, deployments, and incident response to keep pace. That's the bet we're making: engineering velocity compounds when AI works across the entire delivery chain, not just the code-generation process. What's next? Look out for our April updates.
AI Demos Are Easy. Enterprise AI Is Not.
Why 90% of AI prototypes never make it to production, and what to do about it.
Every week, someone on my team shows me a demo that looks incredible. An agent that writes deployment pipelines. A chatbot that triages incidents. A copilot that generates test cases from Jira tickets. The demo takes 20 minutes. The audience claps. Everyone leaves convinced we're six weeks from shipping it.
We're not.
I've spent the last two years building AI systems at an enterprise software company, and if there's one lesson I keep re-learning, it's this: the demo is the easy part. Getting from a compelling prototype to a system that works reliably, at scale, across thousands of customers with different configurations, permissions, and expectations? That's where the real engineering begins.
This isn't a hot take. It's an industry-wide pattern. Most AI prototypes stall somewhere between "wow, that's cool" and "okay, but can we actually ship this?" The reasons are predictable, and they have nothing to do with model quality. They have everything to do with context, evaluation, memory, and governance. The unglamorous infrastructure work that doesn't make it into the demo.
The Demo Trap
Here's why demos fool us. In a demo, you control everything. You pick the happy-path input. You choose the right model. You pre-load the context. You're essentially showing a curated performance. A magician who only performs the trick with the deck they've stacked.
Production is different. In production, a user types a half-formed sentence into a chat window at 2 AM while an incident is melting their deployment pipeline, and your agent needs to understand not just what they're asking, but who they are, what they're working on, which services are affected, and what they're actually allowed to do about it.
The gap between these two worlds isn't a gap in model capability. GPT-4, Claude, and Gemini are all remarkably good. The gap is in everything around the model.
I think of this as the four pillars of enterprise AI:
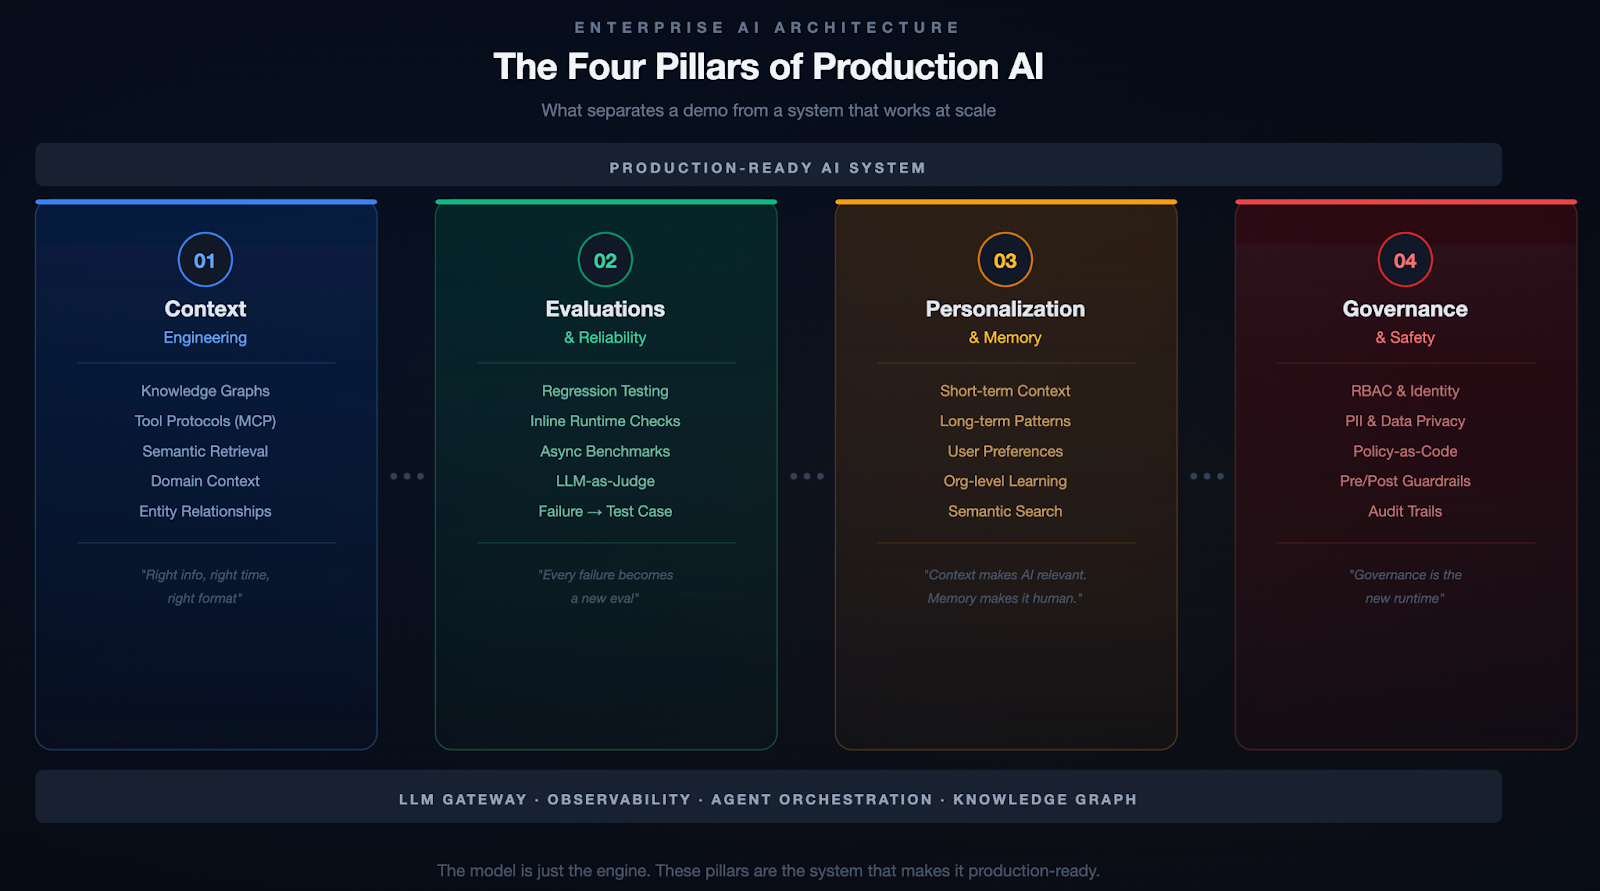
Pillar 1: Context Engineering
If you've been in the AI space for even six months, you've probably heard the term "prompt engineering." Write better prompts, get better results. That was the 2023 playbook. It's insufficient.
Context engineering is the delicate art and science of filling the context window with just the right information for the next step. — Andrej Karpathy
The keyword is just right. Not everything. Not nothing. The right information, at the right time, in the right format. In an enterprise setting, this is where it gets hard.
Your data is siloed. To help a developer debug a failed deployment, an AI agent needs pipeline config, recent code changes, service topology, incident history, and team ownership. That's five different systems, each with its own data model and access control. A demo grabs one of these. Production needs all of them, stitched together coherently.
Generic LLMs don't speak your language. Every organization has its own jargon, abbreviations, and naming conventions. Without domain-specific context, the model either hallucinates confidently or gives you a generic answer that's technically correct but operationally useless.
More context isn't always better. Many teams fall into this trap. They dump every document, log file, and metadata chunk into a massive prompt. And the model's performance degrades. Signal gets buried in noise, token costs go through the roof, and responses slow to a crawl.
What Actually Works: Knowledge Graphs
The approach that's worked for us is building a knowledge graph as the organizational memory layer. Instead of dumping raw data into the context window, you model the relationships between entities across your software delivery lifecycle: services, pipelines, deployments, code changes, feature flags, incidents, test results, security scans, infrastructure changes, and even cloud spend.
At Harness, we call this the Software Delivery Knowledge Graph. Here's what it looks like in practice:
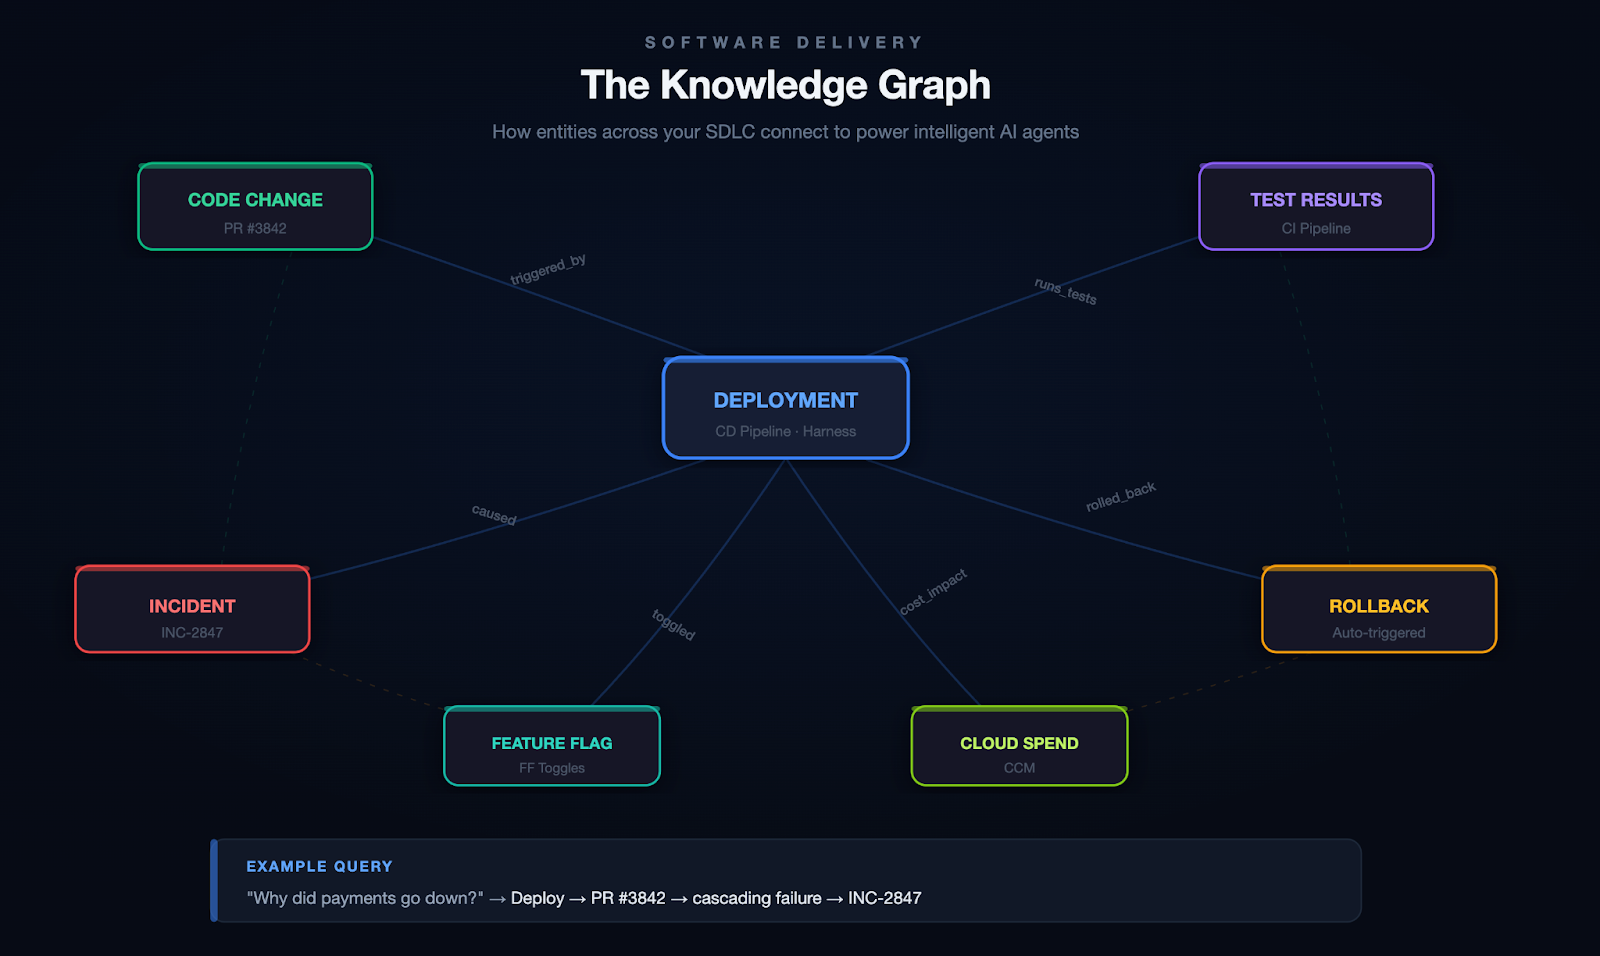
Scenario: Root Cause Analysis
A developer asks: "Why did the payments service go down last night?" Without a knowledge graph, your agent searches logs and may find the error. With a knowledge graph, it traces the full causal chain:
Deploy 11:47 PM → PR #3842 (retry logic change) → cascading failure → fraud-detection svc → INC-2847 → on-call: @platform-eng
The graph connects the deploy to the code change, the code change to the author, the PR to the CI pipeline that ran (and the test that didn't catch it), and the incident to the engineer who responded. That's not a search result. That's a full causal narrative.
Scenario: Autonomous Remediation
Your agent detects that error rates on a canary deployment are spiking. It queries the knowledge graph to find which services are in the blast radius, checks whether a feature flag can isolate the change, confirms the rollback policy for this service tier, and executes the rollback. Then it files the incident, tags the PR that caused it, and notifies the team.
All of this depends on the graph knowing how these entities relate to each other.
On top of the knowledge graph, you need a way to get context to the model at runtime. This is where tool protocols like MCP (Model Context Protocol) become valuable. They give your agents a standardized way to discover and call tools, retrieve context, and interact with external systems without hardcoding every integration.
From 20+ Sub-Agents to One Unified Agent
We learned this the hard way. Our first DevOps agent had 20+ sub-agents, each responsible for a different domain (CI, CD, feature flags, infrastructure, etc.). It was a nightmare to maintain, slow to execute, and fragile. Responses took upwards of 40 seconds. Accuracy was inconsistent because each sub-agent had its own narrow view of the world.
When we consolidated into a single unified agent backed by a knowledge graph and a tool registry, the results weren't incremental:
One agent with full context consistently outperformed twenty agents with partial context.
Pillar 2: Evaluations
This is the pillar most teams skip entirely. And it's the one that bites hardest.
You cannot look at an LLM's output and reliably tell whether it's good. You might catch obvious failures (a hallucinated API endpoint, a completely wrong answer), but the subtle errors? The ones where the model gives a 90%-correct pipeline configuration that will silently break in a specific edge case? Those slip through.
Unlike traditional software, where a bug either crashes or doesn't, LLM outputs fail on a spectrum. They can be subtly wrong, misleadingly confident, or technically correct but contextually inappropriate.
The Three-Layer Eval Pipeline
The most important principle we adopted: when something breaks, it becomes a test case. Most teams fix the bug, update the prompt, and move on. Without adding the failure to their eval suite, they have no guarantee it won't regress.
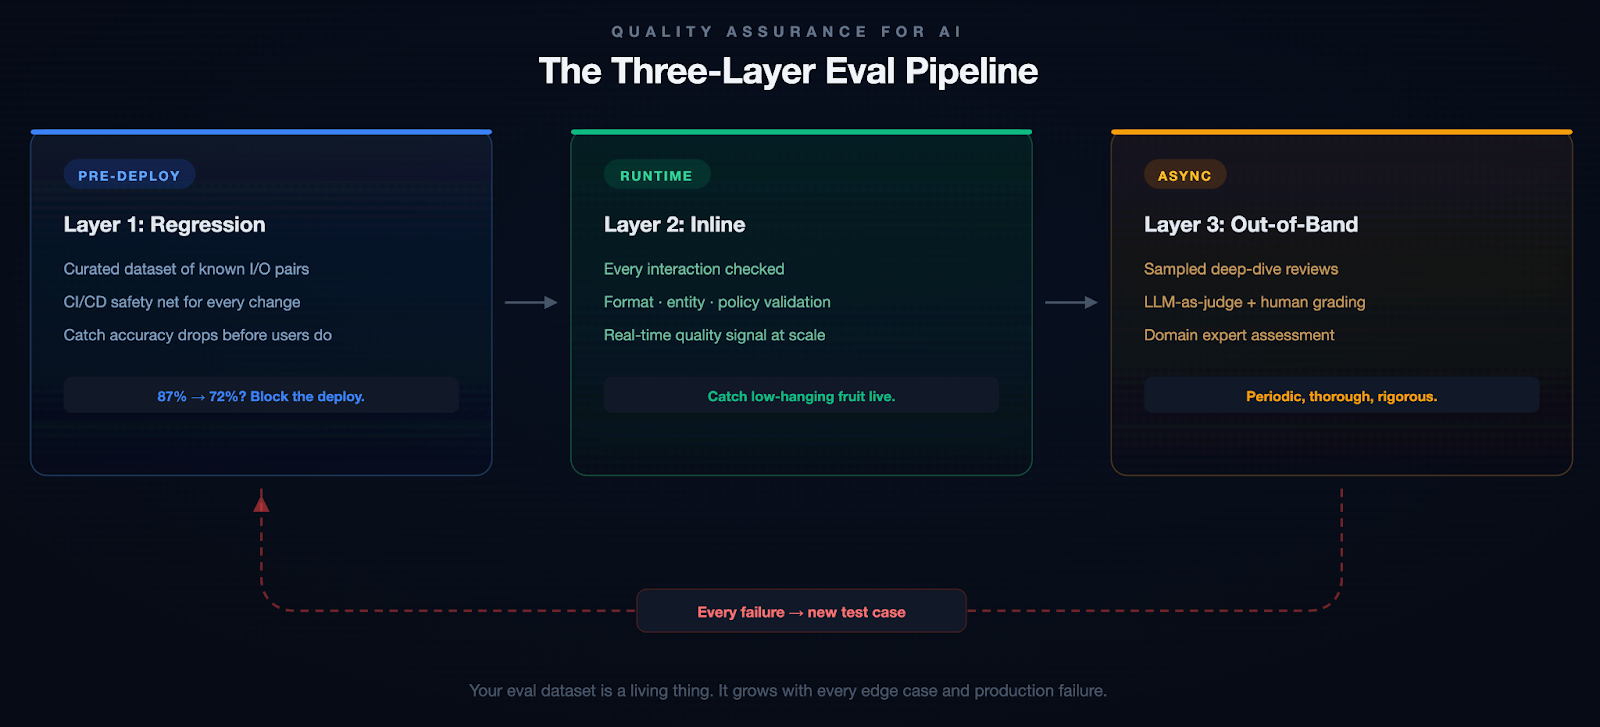
Example: A Subtle Failure
Our pipeline generation agent once produced a valid-looking Kubernetes deployment manifest. It passed inline checks. But it defaulted the resource limits to values that worked in staging and would have OOM-killed the pods in production under real traffic. A human caught it in review. That edge case is now a regression test, and we added resource-limit validation to our inline evals.
We started with about 200 test cases for our pipeline generation agent. That number grows every week. And don't just include success cases. Include examples of what good rejection looks like. When should the model say "I don't know"? Those boundaries matter as much as the correct answers.
Pillar 3: Personalization & Memory
If you've ever used an AI assistant for a few weeks and noticed that it asks you the same clarifying questions every single time, you've experienced the memory problem. Most AI systems are stateless. Every conversation starts from scratch. They don't remember that you prefer YAML over JSON, that your team uses a specific branching strategy, or that last week's deployment issue was caused by a misconfigured feature flag.
This is fine for a chatbot. It's unacceptable for an enterprise tool.
Short-term memory is about maintaining context within a session. If you've already provided the service name, the error logs, and the deployment history, the system shouldn't ask for three messages again later.
Long-term memory is harder and more interesting. Which deployment strategies does this team prefer? What's this user's role and expertise level? When this organization encounters a certificate error, what's their typical resolution path?
Memory in Action
Without memory: A senior SRE asks the agent to help triage an incident. The agent asks which environment, which service, what the escalation policy is, and what monitoring stack they use. It does this every single time.
With memory: The agent already knows this SRE is responsible for the payments cluster in prod-west, that they prefer Datadog dashboards over raw logs, that their team's escalation policy involves PagerDuty, and that last month's similar incident was a connection pool exhaustion. It skips the 20 questions and gets straight to work.
The implementation involves extracting key information from recent interactions, comparing it against what you already know about the user, and deciding whether to store, update, or ignore it. Getting this right without the memory becoming stale or bloated is harder than it sounds.
Without memory, AI feels like talking to a brilliant amnesiac. With it, it feels like working with a colleague who's been paying attention.
Pillar 4: Governance & Safety
Nobody wants to talk about governance. It doesn't make for good demos, it doesn't generate engagement on X, and it's not the reason anyone got into AI. But if you're building AI for enterprises, especially in regulated industries or sensitive domains, governance isn't optional.
Governance breaks down into four areas:
Access & Identity. Your AI agent should respect the same RBAC policies as the rest of your application. If a developer can't deploy to production, neither should the agent.
Data & Privacy. PII detection, data residency, and GDPR compliance. These aren't things you bolt on after launch. They need to be baked in from the start.
Policy Enforcement. Pre- and post-generation guardrails via policy-as-code. Define rules in OPA, validate I/O, and reject anything outside the boundaries.
Auditability. Every action should be traceable: which model, what context, what output, what actions. Not just for compliance. It's how you debug and build trust.
Why This Matters
An AI agent with broad API access can do a lot of good. It can also delete a production database, expose customer PII in a log, or deploy untested code to a critical environment. These aren't hypothetical risks. They're the kind of thing that happens when you give an agent tool access without thinking through the permission model. Governance isn't bureaucracy. It's the difference between a tool your security team trusts and one they shut down.
Context is the new code. Governance is the new runtime.
The Evolution: From Chatbots to Autonomous Agents
These four pillars apply at every level of AI capability, but the stakes compound as systems become more autonomous.
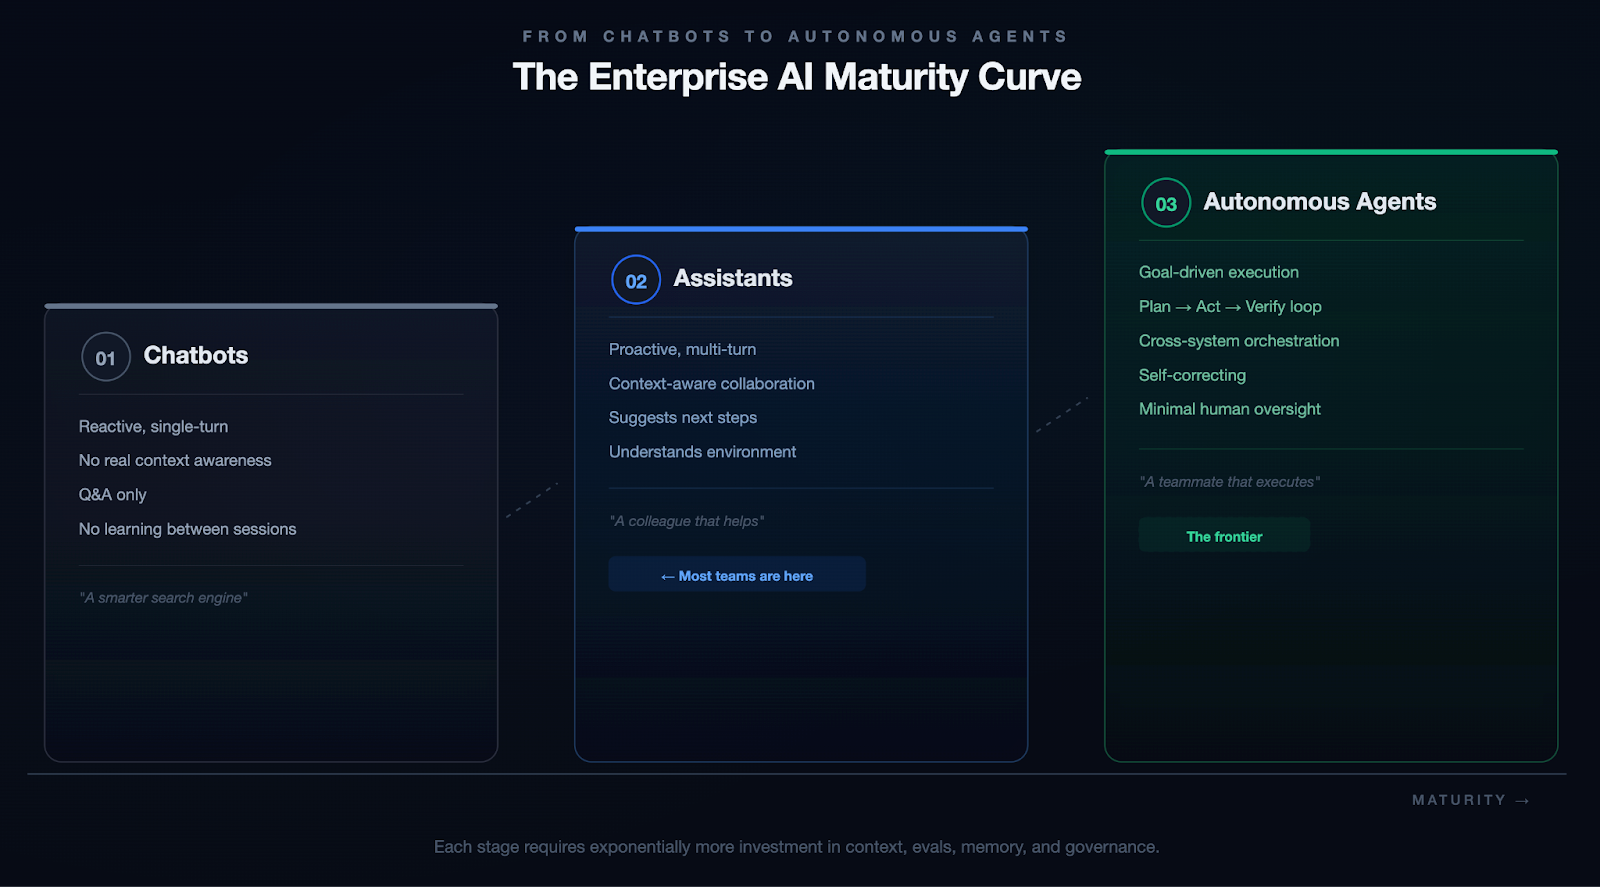
We're not fully at Stage 3 yet. Nobody is. But every investment in context, evals, memory, and governance compounds as you move along that spectrum.
The Practical Blueprint
If you're reading this and thinking, "Okay, but where do I actually start?" Here's the honest answer: start small, go deep, and resist the urge to build everything at once.
- Pick one use case with clear boundaries. A specific workflow (pipeline generation, incident triage, code review) where you have clean data, measurable outcomes, and users who will give you honest feedback.
- Build your context layer first. Before you optimize prompts or fine-tune models, invest in the plumbing. What data does the model need? Where does it live? How do you get it into the context window without drowning in noise?
- Instrument everything from day one. Set up tracing and observability before you ship. Not after. When (not if) something breaks, you need to trace through the entire chain.
- Write evals before you write prompts. Define what "good" looks like before you start iterating. Otherwise, you're optimizing by vibes, and vibes don't scale.
- Treat governance as architecture, not paperwork. Build access controls, data policies, and audit trails into your system from the start. It's ten times cheaper to build them in than to retrofit later.
Conclusion: The System Is the Product
Scaling AI is not about bigger models. The models are already incredibly capable. The real bottleneck is the infrastructure around them.
The teams that will win aren't chasing the newest model release or the flashiest demo. They're quietly building the systems that make AI reliable, trustworthy, and useful at scale.
The demo is the easy part. The system is the hard part. And the system is where the value lives.
The Modern Software Delivery Platform®
Need more info? Contact Sales