Harness Blog
Featured Blogs
AI is writing more of the code. Software delivery, the work between writing code and running it in production, is where most of the day still goes. Building, testing, scanning, deploying, remediating, and operating still require the same, if not more, effort as before AI.
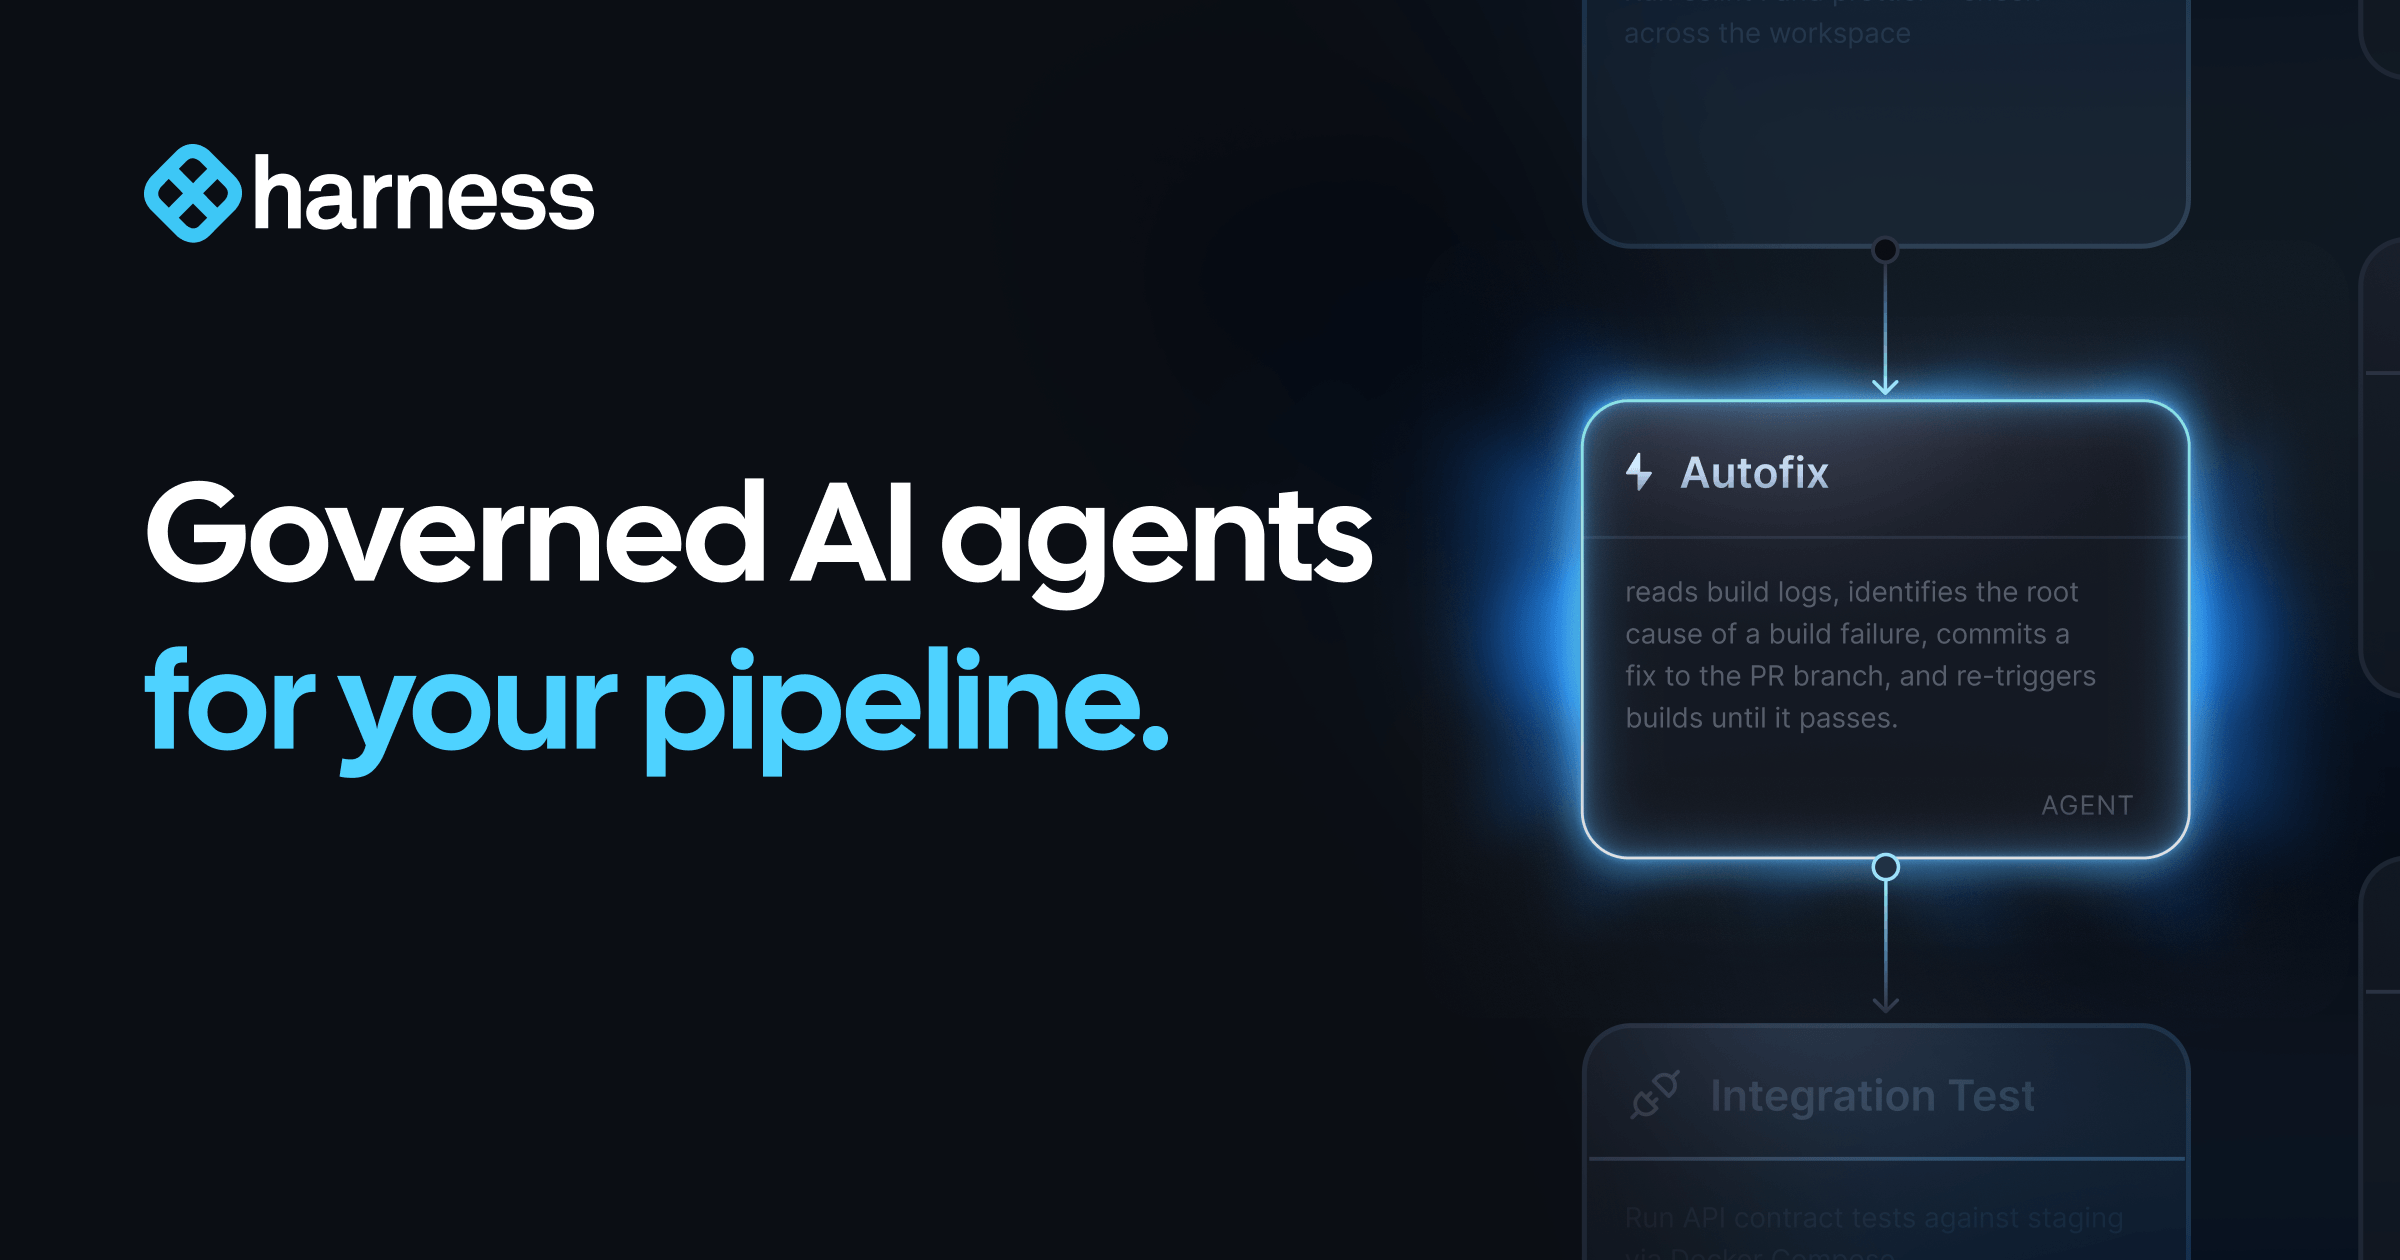
Today, we're introducing Autonomous Worker Agents for software delivery: the platform for enterprises to build and safely run AI agents that handle the work between writing code and shipping it to production.
Autonomous Worker Agents execute as pipeline steps and produce auditable outputs. Their memory is the organization: services, pipelines, deployments, incidents, policies, all connected through the Harness Knowledge Graph, and their capability is powered by the Harness MCP. They operate in production and support the deployment, security, remediation, and validation of your code.
They join Harness Expert Agents, which have been available to customers for some time, to form a complete AI layer across the platform.
Each agent runs as a step inside a Harness pipeline, on customer-controlled infrastructure, with full governance: scoped credentials, OPA policy enforcement, approval gates, and complete audit trails.
Safe to Run in Production
Autonomous Worker Agents are invoked as pipeline steps or independently. They inherit the governance Harness pipelines already provide. Instead of trying to teach an AI agent a massive list of corporate rules, the agent operates entirely within the constraints of your existing software delivery pipelines.
- OPA Policies that gate production deployments gate the agents.
- RBAC that controls who can push to production controls who can trigger an agent.
- Approval Gates apply before an agent's fix ships, just as they do before any release.
Safety is architected in as well. Workloads execute on Harness Delegates, lightweight runtimes installed inside the customer's own Kubernetes cluster or VPC. An agent that "shouldn't be able to merge to main" cannot merge to main, even if its prompt asks it to. The architecture enforces it.
We built RiskSentinel, a Harness Autonomous Worker Agent, to demonstrate that governed AI can move beyond identifying security issues to safely remediate them while maintaining enterprise controls, auditability, and compliance. When building with Harness, what stood out most was how intuitive the experience was — it enabled our team to move from an initial idea to a production-ready agent in just four days, allowing us to focus on solving a real enterprise challenge rather than the underlying platform. That combination of developer experience and enterprise-ready capabilities is what will enable organizations to confidently scale AI across software delivery.
- Ratna Devarapalli, Director IT, United Airlines
Six additional controls make Autonomous Worker Agents production-safe.
1. Sandboxing
Agents are run containerized, with non-root execution (UID 65534, "nobody"). Their filesystem is read-only except for the workspace. Network access is configurable per agent: unrestricted, restricted to allowed MCP servers, or fully disabled.
An agent that produces a malicious bash command has nowhere to send the data.
2. Scoped Credentials
When a pipeline triggers, Harness mints an ephemeral scoped token. Its scope is the intersection of the agent's permissions and the triggering user's RBAC.
Token deletes on completion. TTL as a failsafe. MongoDB TTL index as final backstop.
3. Policy Enforcement
OPA policies, the same framework Harness customers use to govern deployments, apply to agents. Policies govern the agent at runtime and during configuration.
4. Audit Trails
Every execution is captured in the Harness Audit Trail. This includes a full provenance chain: who or what triggered the agent, template version, every action taken, and final outcome.
Prompts and reasoning chains are sanitized before persistence: secrets stripped, and PII is stripped.
5. Cost Tracking
Token consumption and costs are surfaced per execution, per agent, and per pipeline. Running totals are shown live in the step header.
6. Chaining
Agents are architected to run within pipelines and can be naturally composed into multi-step workflows.
- Sequential: Agent B consumes Agent A's output.
- Parallel: agents run simultaneously.
- Conditional: an agent runs only if a previous step meets a condition.
- Matrix: same agent across repos, environments, or services.
Output handoff happens via pipeline expressions and shared workspace files.
Three ways to create an agent
Using YAML
A Worker Agent is defined in a single file. Here's a complete agent that reviews every pull request for security issues:
agent:
   group:
     steps:
       - name: Run Code Coverage Agent
         id: runCodeCoverageAgent
         if: <+Always>
         run:
           container:
             image: pkg.harness.io/vrvdt5ius7uwygso8s0bia/harness-agents/harness-ai-agent:latest
           env:yam
             ANTHROPIC_MODEL: ${{inputs.model_name}}
             PLUGIN_HARNESS_CONNECTOR: ${{inputs.llm_connector.id}}
             PLUGIN_MAX_TURNS: "150"
             PLUGIN_MCP_FORMAT: harness
             PLUGIN_MCP_SERVERS: <+connectorInputs.resolveList(<+inputs.mcp_connectors>)>
             PLUGIN_TASK: |
               Autonomous Harness Code Coverage Agent; no prompts. Resolve branch/repo/clone_url/account/org/project/execution strictly: input -> env -> MCP, never guess; branch must exist via SCM MCP or fail.
               Use /harness first, else $HARNESS_WORKSPACE; if repo missing, clone (SCM MCP preferred, git fallback) and checkout resolved branch.
               Detect language/test/coverage stack, run baseline coverage (overall + per-file), and target >=90% overall and >=80% per-file.
               Add meaningful tests for critical uncovered paths (happy/edge/error/boundary); allow only minimal production testability tweaks.
               Re-run full tests + coverage + lint + build; all must pass before continuing.
               Review full diff (SCM MCP preferred, git diff fallback); allow only tests + minimal testability tweaks (+ COVERAGE.md only if it already exists; never create it).
               Build report with overall before->after, per-file before/after for touched files, and key improvements.
               Stage files one-by-one only; never use git add -A or git add .; verify staged diff is clean and in-scope.
               Create exactly one commit: "Code coverage: automated test additions by Harness AI"; push plain to origin <branch> (no pull/rebase/merge/force).
               If push fails, print rejection, git reset --hard HEAD~1, exit non-zero; never commit unrelated changes, never weaken existing tests, never log secrets.
YAML frontmatter on top. Natural language below ---. The same convention Jekyll, Hugo, and AI agent definitions across the industry use.
Save the file, commit it to the repo, and the agent is live, governed, and in the catalog. Every PR triggers it. Every run is audited. Every action is scoped by RBAC. From a blank file to a live governed agent in minutes.
The Harness pipeline engine handles container runtime, scoped credentials, MCP server integration, audit logging, and cost tracking.
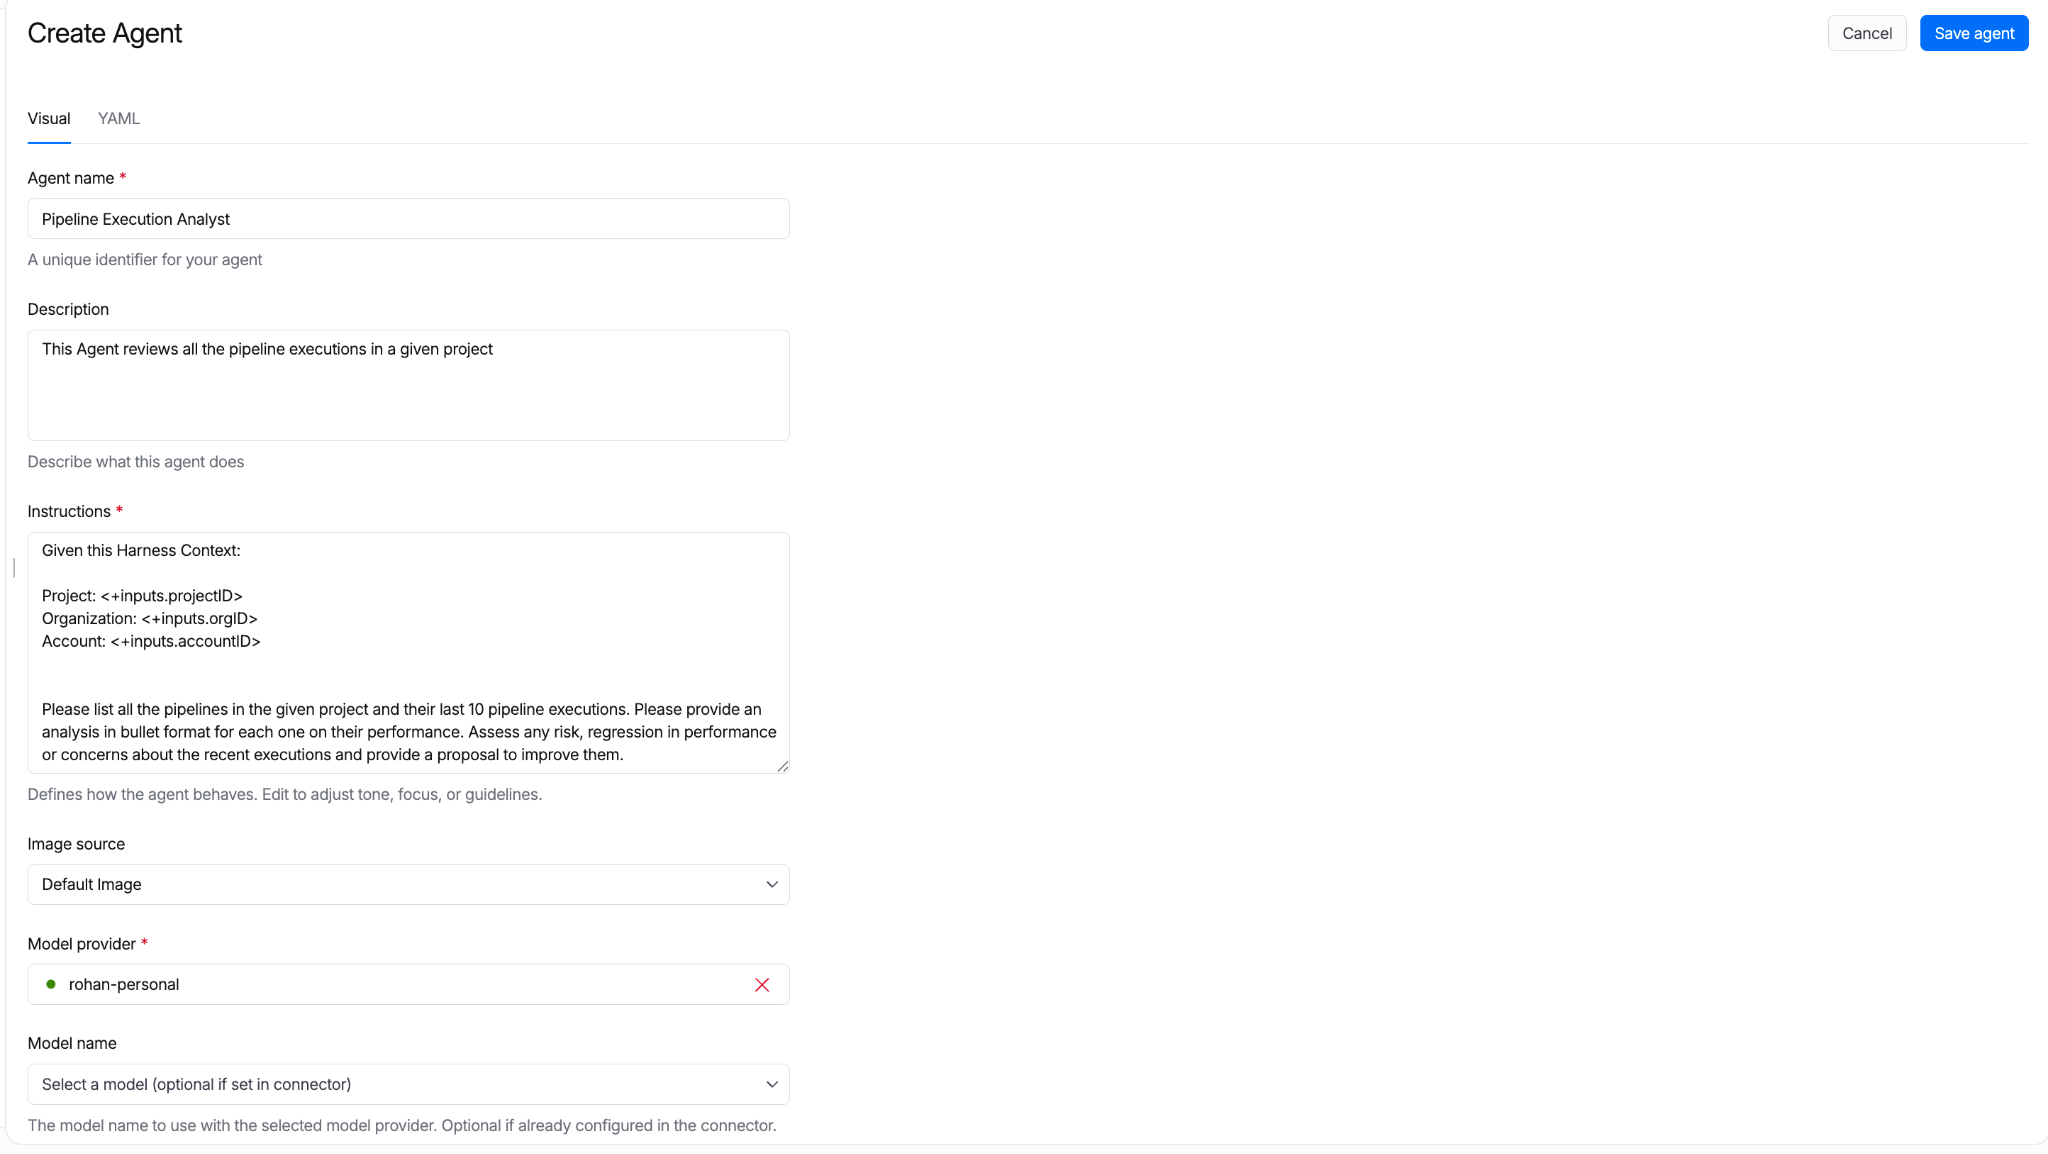
Using the UI
The Harness Agent Builder is a simple form for configuring your Agents. Define your prompts in plain English, referencing Harness constructs through common expressions. This experience makes it easy to see what you need to provide and set up your agent in minutes.
All agent definitions are stored in Harness. Their reference in pipelines can be managed in Git. Approval gates apply. Pipeline Branch-based versions let teams test new agent behavior in feature branches before merging to main.
"We built an agent that handles log analysis directly inside Harness. No tool switching, no context loss. The ability to stay on one platform and have the agent surface what's happening and review it for us was the biggest immediate win. We're planning to use it in production."
- Mandy Pearce, Senior Engineer, Cloud Automation, Verint
Create with MCP
Using your favorite coding agent, you can connect to Harness over the MCP. The MCP bridges the AI Coding agents’ inner-loop context and the outer-loop context and the constructs in Harness.
Agents as Pipeline Steps
Most software delivery workflows have more than one step. Autonomous Worker Agents compose with shell scripts, plugins, approval gates, and other agents to make full pipelines.
Referencing an Agent in a Pipeline
pipeline:
 stages:
   - steps:
       - name: Feature Agent
         template:
           uses: ca_feature_triage_agent@1.0.2
       - name: Plan Agent
         template:
           uses: ca_work_planning_agent@1.0.2
       - name: Build Feature Agent
         template:
           uses: ca_builder_agent@1.0.2
uses: references a Worker Agent template by name and version. The agent runs as one step alongside everything else a Harness pipeline can run.
Sequential: Output Handoff
Agent B consumes Agent A's output. The pipeline expression ${{ steps.<agent_id>.output }} carries the result forward.
pipeline:
 stages:
   - steps:
       - name: spec design
         parallel:
           steps:
             - name: Feature Agent
               template:
               uses: ca_feature_triage_agent@1.0.2
             - name: PR Body
               template:
                 uses: pr_body_writer
                 with:
                   artifactPath: ${{featureagent.output.artifact}}
                   issueKey: cds-1234
Parallel
Multiple agents run simultaneously:
 parallel:
           steps:
             - name: Feature Agent
               template:
                 uses: ca_feature_triage_agent@1.0.2
             - name: PR Body
               template:
                 uses: pr_body_writer
                 with:
                   artifactPath: ${{featureagent.output.artifact}}
                   issueKey: cds-1234
Step Groups
A Step Group bundles agents and deterministic steps into a single reusable unit:
         group:
           steps:
             - name: feature anaylzer
               template:
                 uses: feature_ingester_agent@1.0.2
             - name: work planner
               template:
                 uses: ca_work_planning_agent@1.0.4
Save the group as a template. Reference it from any pipeline. The PR Autofix workflow ships as a Step Group template.
Conditional and Matrix
An agent runs only when a condition is met:
  - steps:
         group:
           steps:
             - name: feature ingest
               template:
                 uses: feature_ingester_agent
             - name: work planner
               template:
                 uses: ca_work_planning_agent
     name: Spec Driven Development
     if: <+OnPipelineSuccess>
The same agent runs across multiple targets:
             - name: work planner
               template:
                 uses: ca_work_planning_agent
               strategy:
                 fail-fast: true
                 for:
                   iterations: 3
Approval gates, failure strategies, retry policies, and rollback work the same way they do for any other pipeline step.
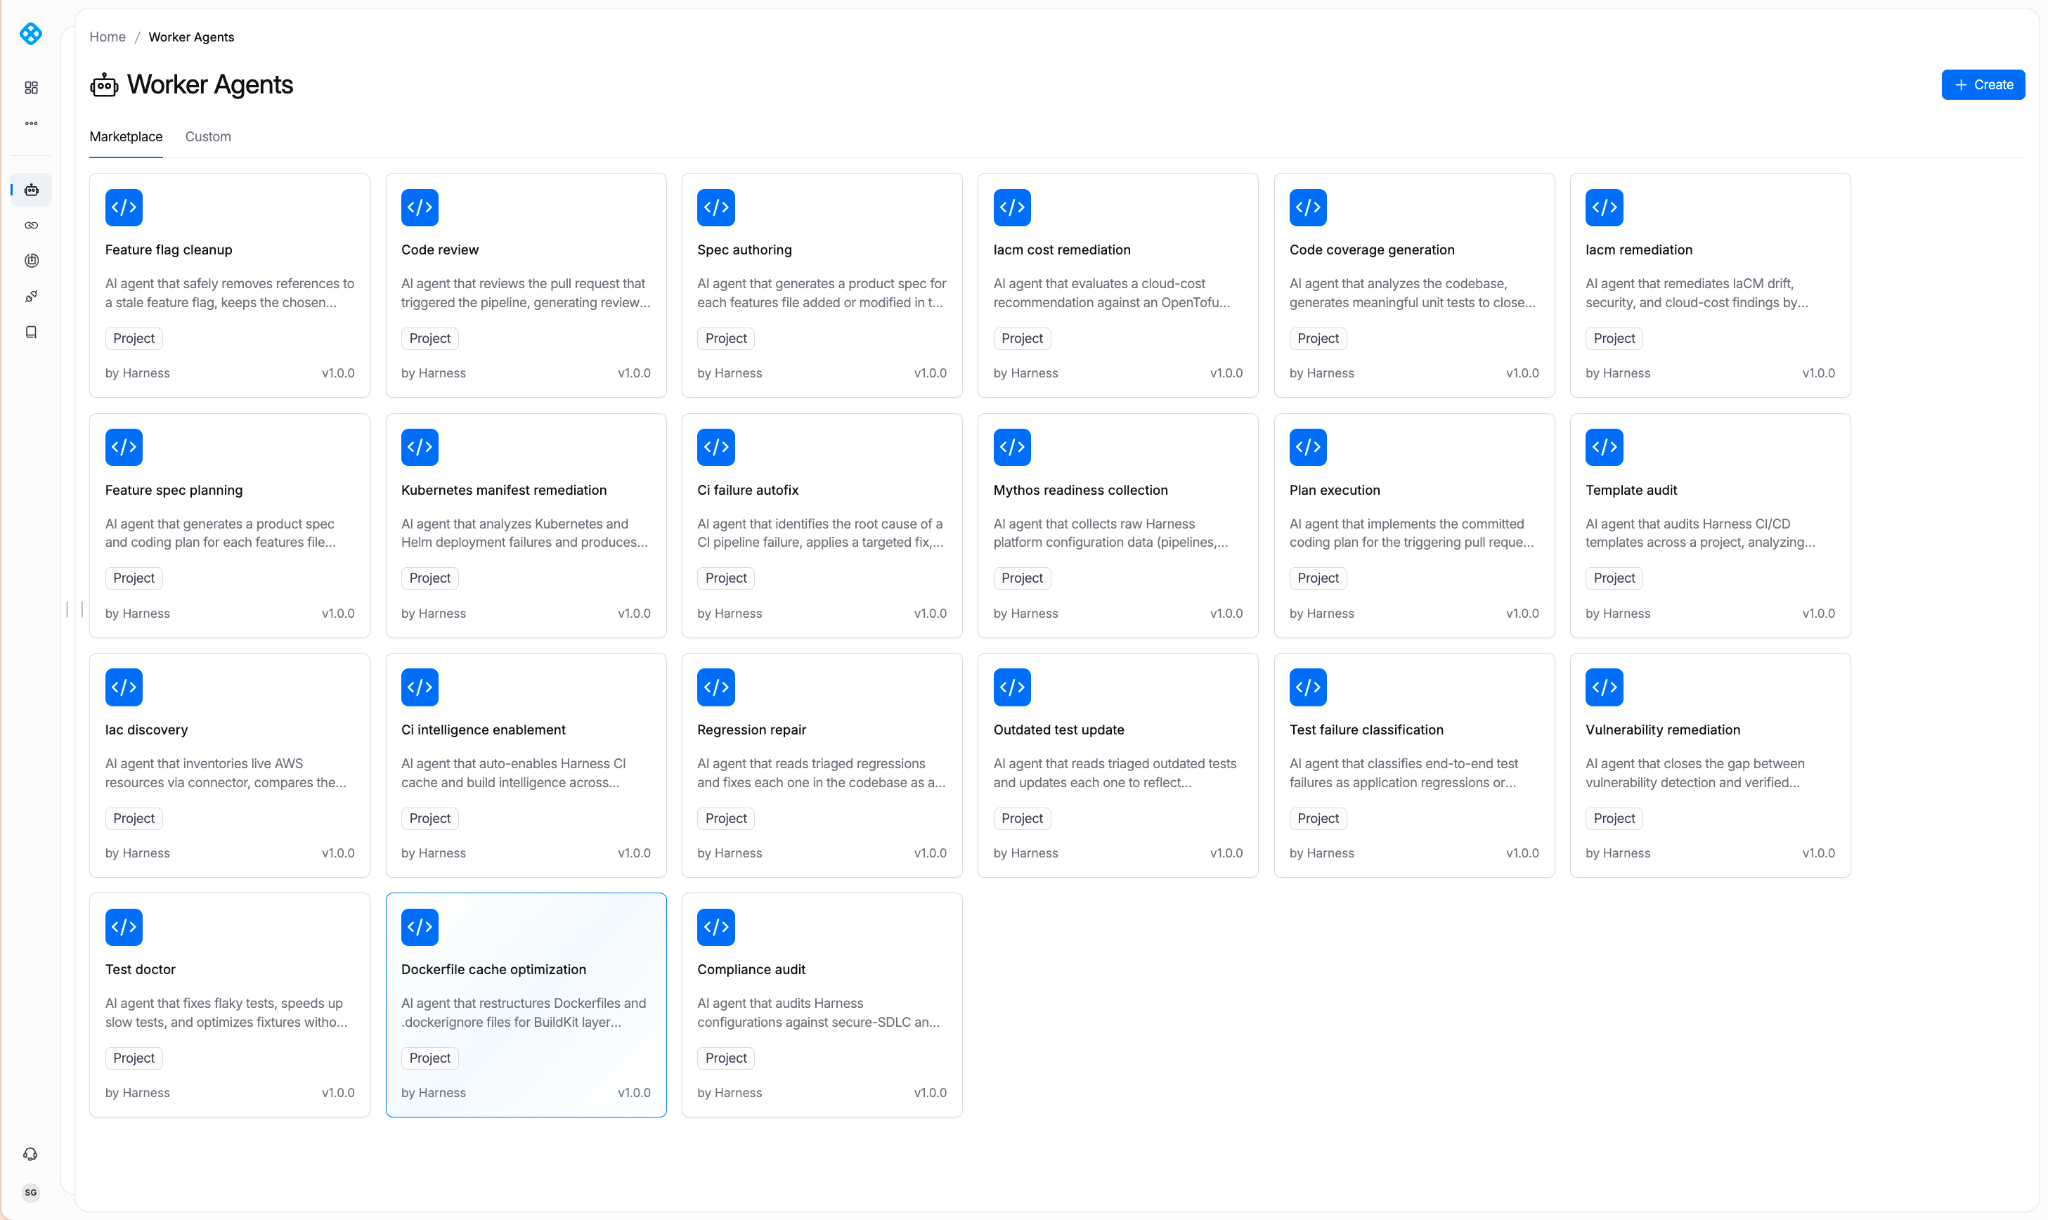
Introducing the Harness Agent Marketplace
The Harness Agent Marketplace is where teams discover, install, fork, customize, and publish Autonomous Worker Agents.
Three publisher tiers anchor it:
- Harness Managed: Built and maintained by Harness. SLA-backed. Versioned. Pinnable (e.g., harness.autofix@1.2).
- Harness Certified: Partner-built. Reviewed and certified by Harness engineering and security. Examples: dependency vendors with their own scanning agents, cloud providers with cloud-specific deployment agents.
- Community: Published by the broader Harness community. Validated for schema, no secrets in prompt. Enterprise accounts can restrict via OPA policy. Allow only Managed and Certified in production, for instance.
Harness Managed Agents
With today’s launch, Harness has pre-built agents for the most requested use cases. Here are some examples of what’s currently available:
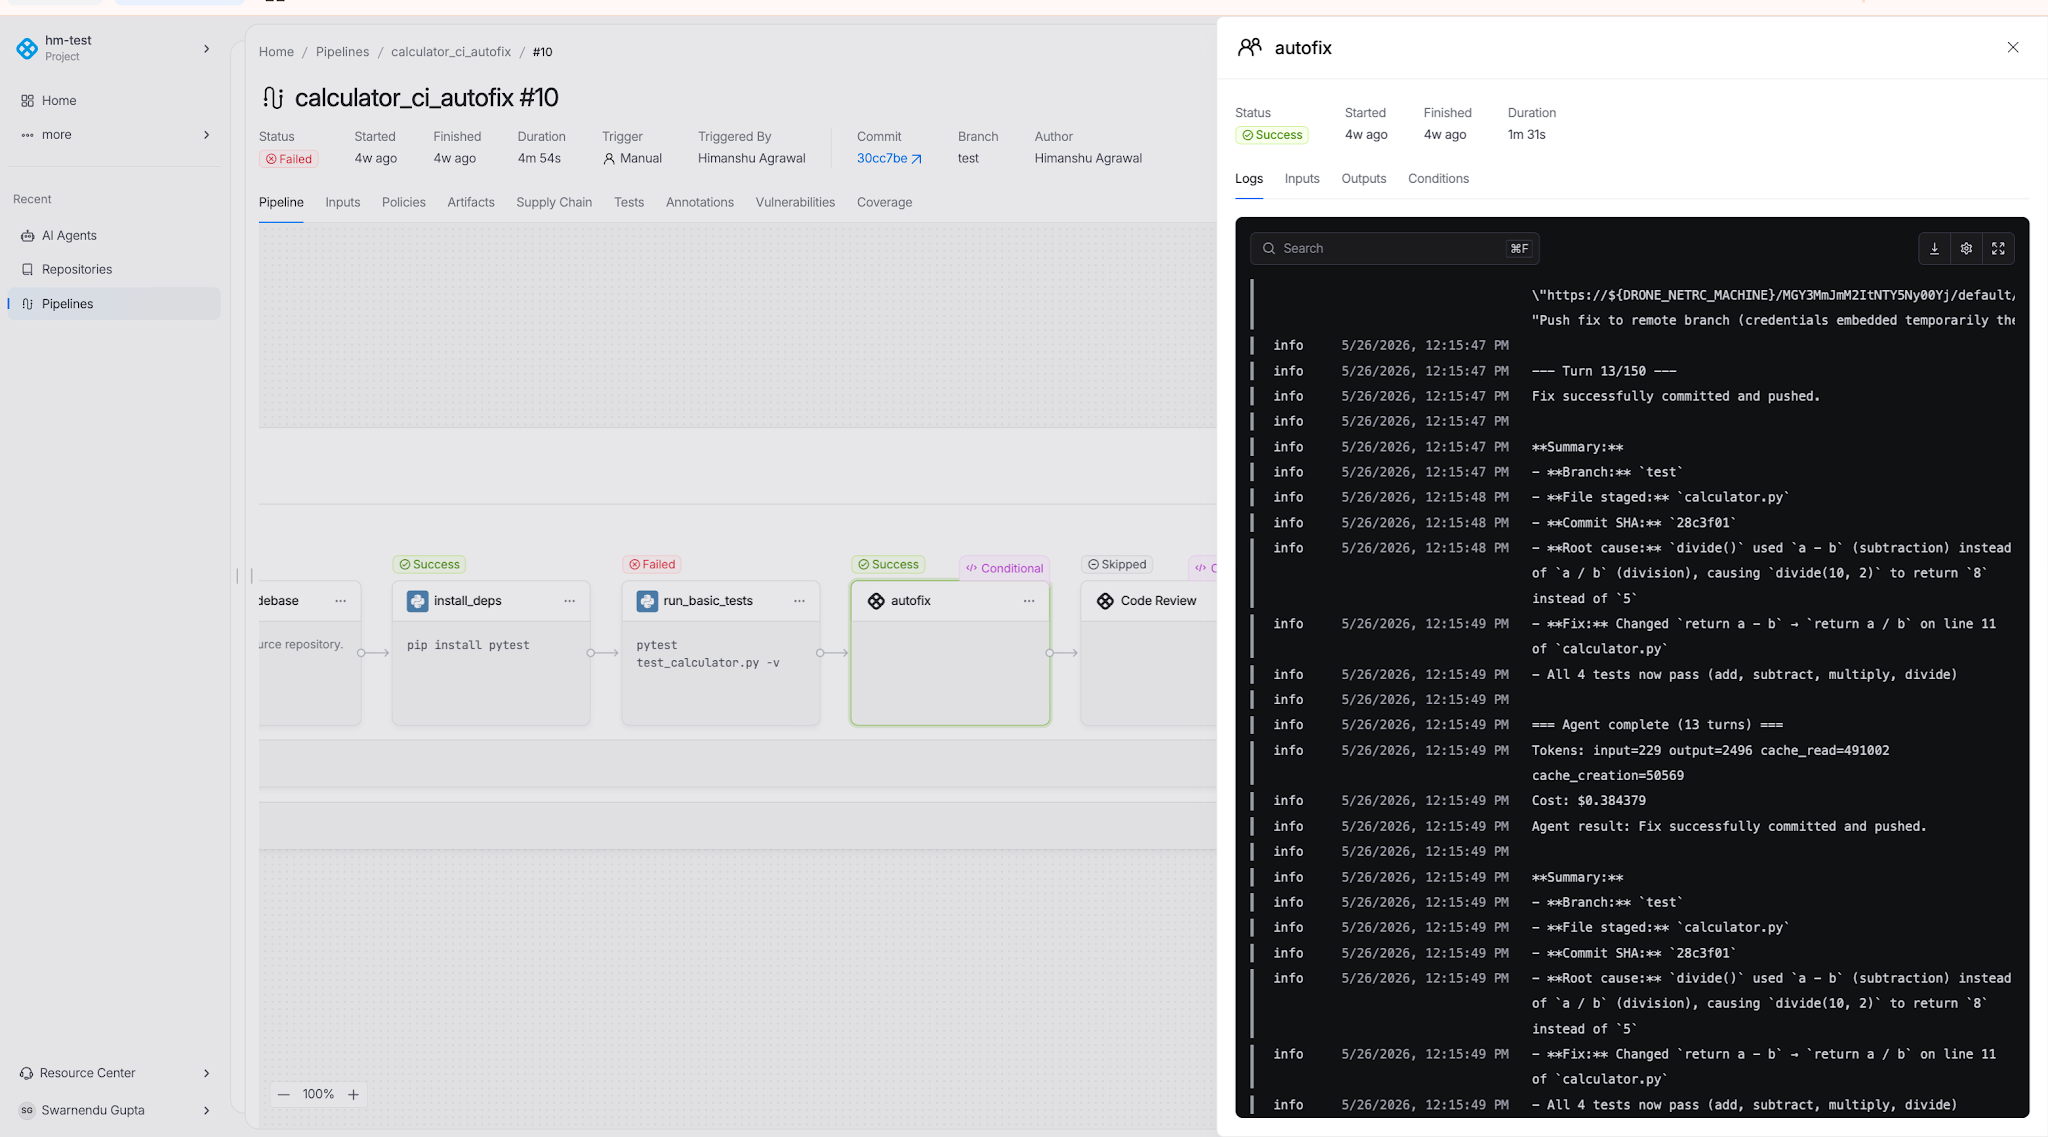
CI Autofix
Reads build logs from a failed PR build, identifies the root cause, commits a fix to the PR branch, re-triggers the build, and repeats until the build passes or the configured max-turns limit is reached.
Manifest Remediator
Analyzes failed Kubernetes deployments. Identifies whether the issue is the manifest, the cluster, or the workload. Fixes manifest issues. Used by teams managing dozens of services across multiple clusters.
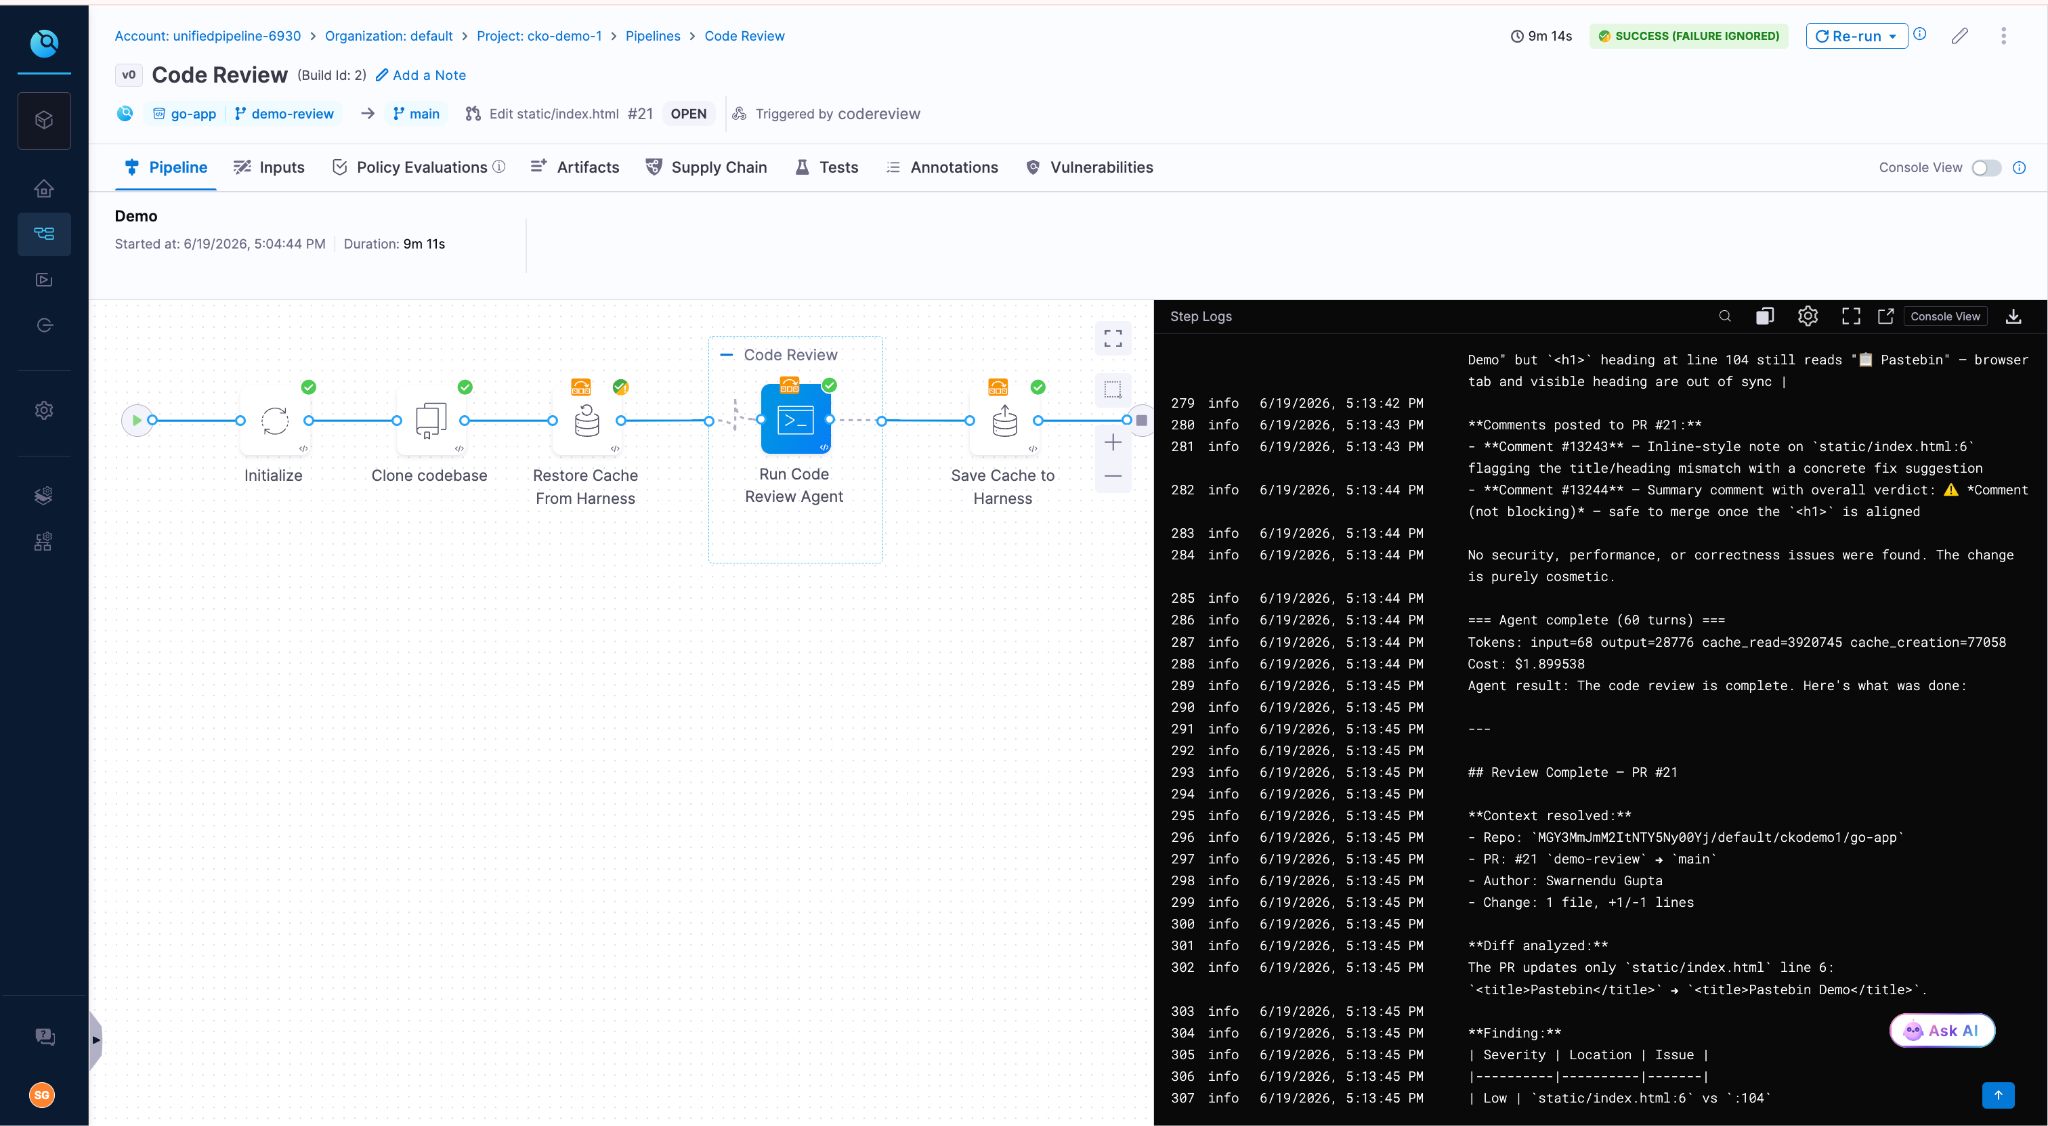
Code Review
Reviews PR diffs across security, quality, and test coverage. Outputs structured findings with severity ratings and concrete remediation. Grounded in the Harness Knowledge Graph, the agent knows which services are production-critical, which have had recent incidents, and which historical anti-patterns have caused outages.
Feature Flag Cleanup
Reads code, config, and flag-system state to identify feature flags that are fully rolled out or fully off. Once it validates removal is safe, the agent generates a cleanup PR. With this agent, the status of your experiments automatically informs you when flags are cleaned up, reducing flag debt and the drudgery of cleaning up old flags.
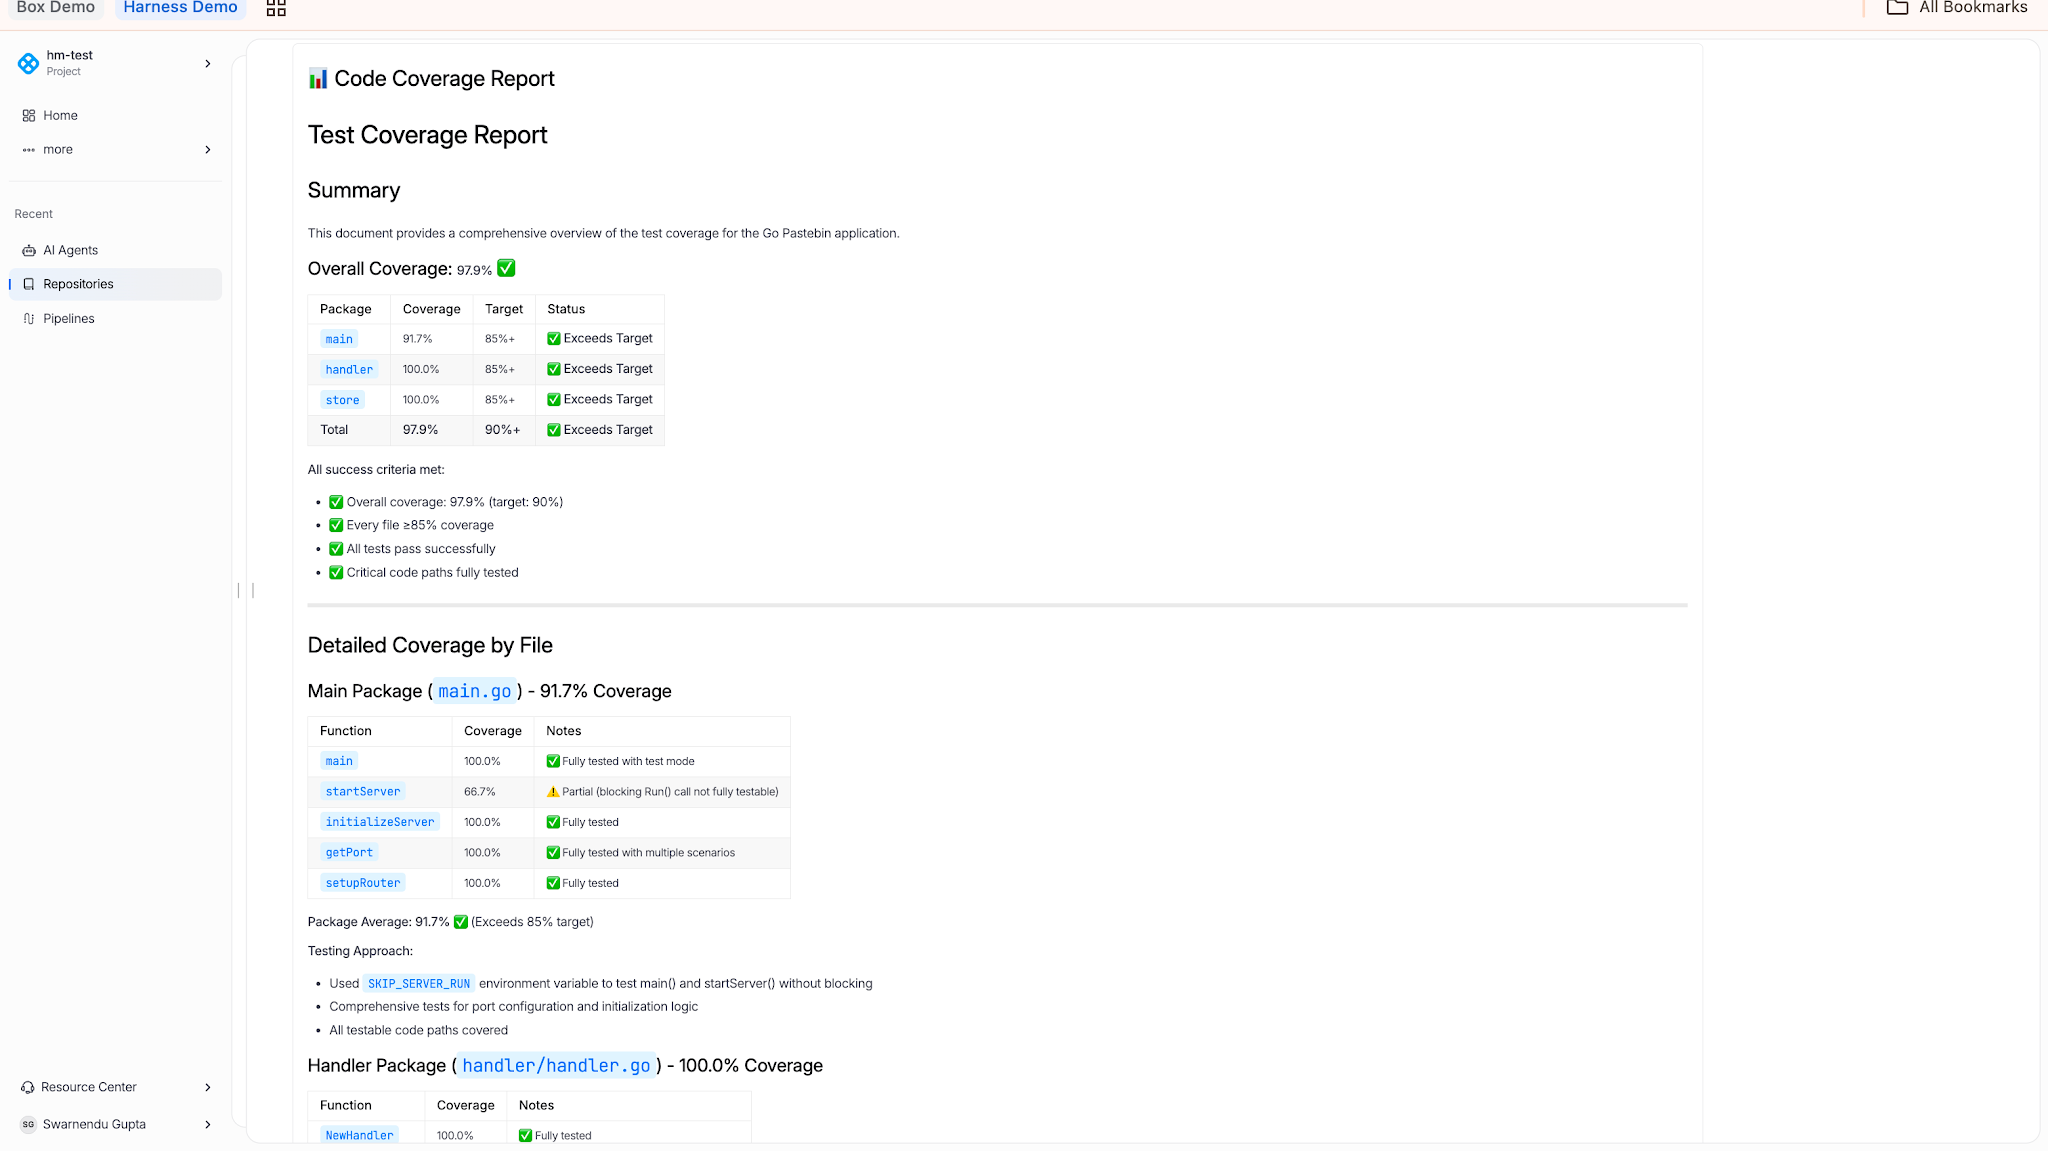
Code Coverage
Reads coverage reports, identifies untested lines, branches, and functions, and generates tests to close gaps. Used when a team has inherited a codebase with weak coverage and needs to lift it before a release.
IaCM Remediation
Fixes configuration drift, security findings, and cloud cost issues by editing infrastructure configurations.
Bring Your Own Model
Autonomous Worker Agents are model-agnostic. Connect LLM providers through Harness connectors:
- OpenAI: Direct to Provider
- Anthropic: AWS Bedrock, Direct to Provider
The model can be specified at three levels: in the agent template, at the pipeline step level (overriding the template), or at the account level via environment variable defaults. Switch models per agent, per environment, or per pipeline without changing agent logic.
Three reasons this matters:
- Cost. Different models have different price points. Routing high-volume work through cheaper models is a common pattern.
- Compliance. Some teams require AWS-routed Bedrock for billing consolidation, VPC routing, or Bedrock-specific compliance attestations.
- Future-proofing. Model leaders change. The enterprise decides which model today, which model tomorrow.
Getting Started
Autonomous Worker Agents are available today for all Harness customers. Learn more about Harness Autonomous Worker Agents or request a demo to see them in production.
Visit the in-app Harness Marketplace in app to try out any of the Worker Agents. Add it to your pipeline and watch it run.
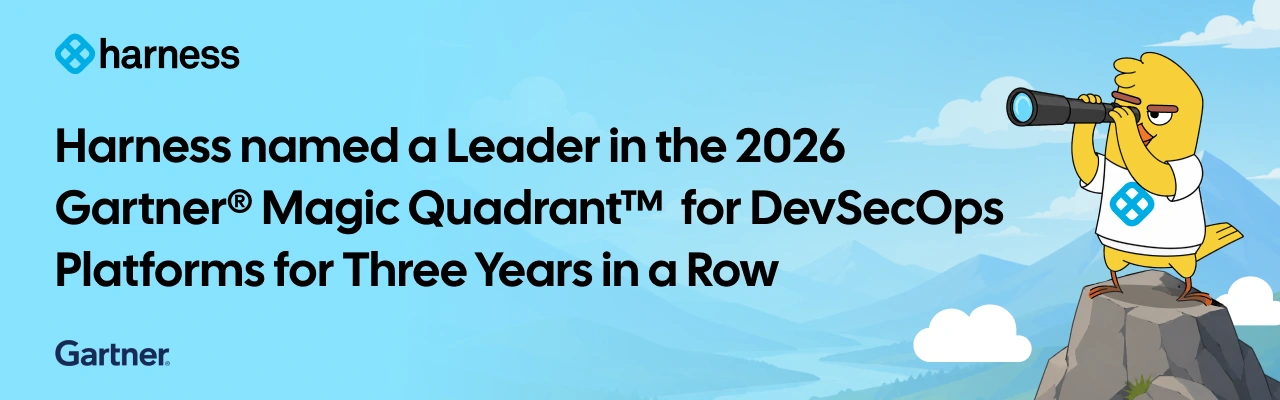
Harness has been recognized as a Leader in the 2026 Gartner® Magic Quadrant™ for DevSecOps Platforms for the third consecutive year. Harness was also positioned furthest on the Completeness of Vision axis in the report.
Our Key takeaways:
- Harness is named a Leader for the third consecutive year
- Harness is positioned furthest on the Completeness of Vision axis
- Harness continues investing in governed, AI-powered DevSecOps
Harness is the AI platform for engineering, security, and operations teams to build, secure, deploy, govern, and optimize software delivery across the SDLC.
We believe our recognition in the Gartner Magic Quadrant for DevSecOps Platforms reflects the continued evolution of the Harness platform and our commitment to helping teams deliver software faster, safer, and with greater governance across the software delivery lifecycle.
We’re thrilled to share this recognition, which we believe reflects the strength of our product strategy, the breadth of our platform, and our continued investment in helping enterprises modernize software delivery with security, reliability, cost management, and AI built into the development lifecycle.
Today, organizations across industries like United Airlines, Ancestry, and Citi rely on Harness to reduce delivery complexity, improve developer productivity, strengthen governance, and accelerate innovation across increasingly complex software environments.
Why This Matters Now
Software delivery has entered a new era. AI coding assistants are helping teams create software faster than ever, but faster code generation also means more changes, more tests, more vulnerabilities, more deployments, and more incidents for organizations to manage. The next era of DevSecOps will not be defined by who can generate code faster. It will be defined by who can safely convert that speed into reliable business outcomes.
Our view is that the future of DevSecOps is autonomous AI agents, governed and directed by expert engineers. As humans and AI agents both contribute to software change, enterprises will need one connected platform to understand, validate, secure, deploy, observe, optimize, roll back, and prove every change across the software delivery lifecycle.
Our Journey
As a pioneer in modern software delivery, Harness offers over 15 platform products and has built one of the industry’s most comprehensive platforms to support the full spectrum of application development, deployment, security, reliability, feature management, cost management, and operations.
Harness has evolved through a combination of product innovation, internal entrepreneurship, open source investment, and strategic acquisitions. We believe our recognition as furthest on the Completeness of Vision axis in the 2026 Gartner® Magic Quadrant™ for DevSecOps Platforms is proof that Harness is solving problems for our customers in a measurable way.
Over the past year, Harness has continued to expand platform capabilities and AI agents across:
- Security and risk management
- AI-native testing capabilities including flaky test detection and AI impact testing
- Feature Management and Experimentation
- Cloud and AI Cost Management
- AI DLC insights
- Resilience Testing, and more
This matters because software delivery is no longer just about building and deploying code. Teams must now manage security risk, release complexity, infrastructure cost, compliance requirements, production reliability, and the growing impact of AI-generated software. The Harness platform allows teams to adopt what they need, when they need it, in one place.
With operations across North America, Europe, APAC, Latin America, and India, Harness serves organizations of all sizes across industries. Customers choose Harness not only for the breadth of the platform but also for the flexibility to adopt individual modules or the full platform based on their needs, maturity, and business priorities.
What’s Next for Harness
This recognition in our opinion is a milestone, and we’re proud, but we’re even more excited by the road ahead.
We build security in the software delivery lifecycle natively, not as a separate stage or disconnected toolchain. As AI increases the volume of code, changes, and security findings, enterprises will need platforms that connect detection, prioritization, policy, remediation, deployment, and runtime defense into a single, governed workflow.
Harness is focused on helping enterprises meet that moment. We will continue investing in AI software delivery to help teams move faster without losing control. Our goal is to help every organization deliver software that is faster to build, safer to release, easier to govern, and more resilient in production.
Thank you to our customers, partners, employees, and community for your continued trust. We’re excited about the journey ahead and can’t wait to show you what’s next.
Learn More
Get a complimentary copy of the 2026 Gartner® Magic Quadrant™ for DevSecOps Platforms.
Or, to talk to someone about Harness, please contact us.
Gartner Disclaimer
Gartner, Magic Quadrant for DevSecOps Platforms, 2026, Keith Mann, Thomas Murphy, Bill Holz, 15 June 2026
Gartner does not endorse any vendor, product, or service depicted in its research publications and does not advise technology users to select only those vendors with the highest ratings or other designation. Gartner research publications consist of the opinions of Gartner’s research organization and should not be construed as statements of fact. Gartner disclaims all warranties, expressed or implied, with respect to this research, including any warranties of merchantability or fitness for a particular purpose.
GARTNER is a registered trademark and service mark of Gartner, and Magic Quadrant is a registered trademark of Gartner, Inc. and/or its affiliates in the U.S. and internationally, and is used herein with permission. All rights reserved.
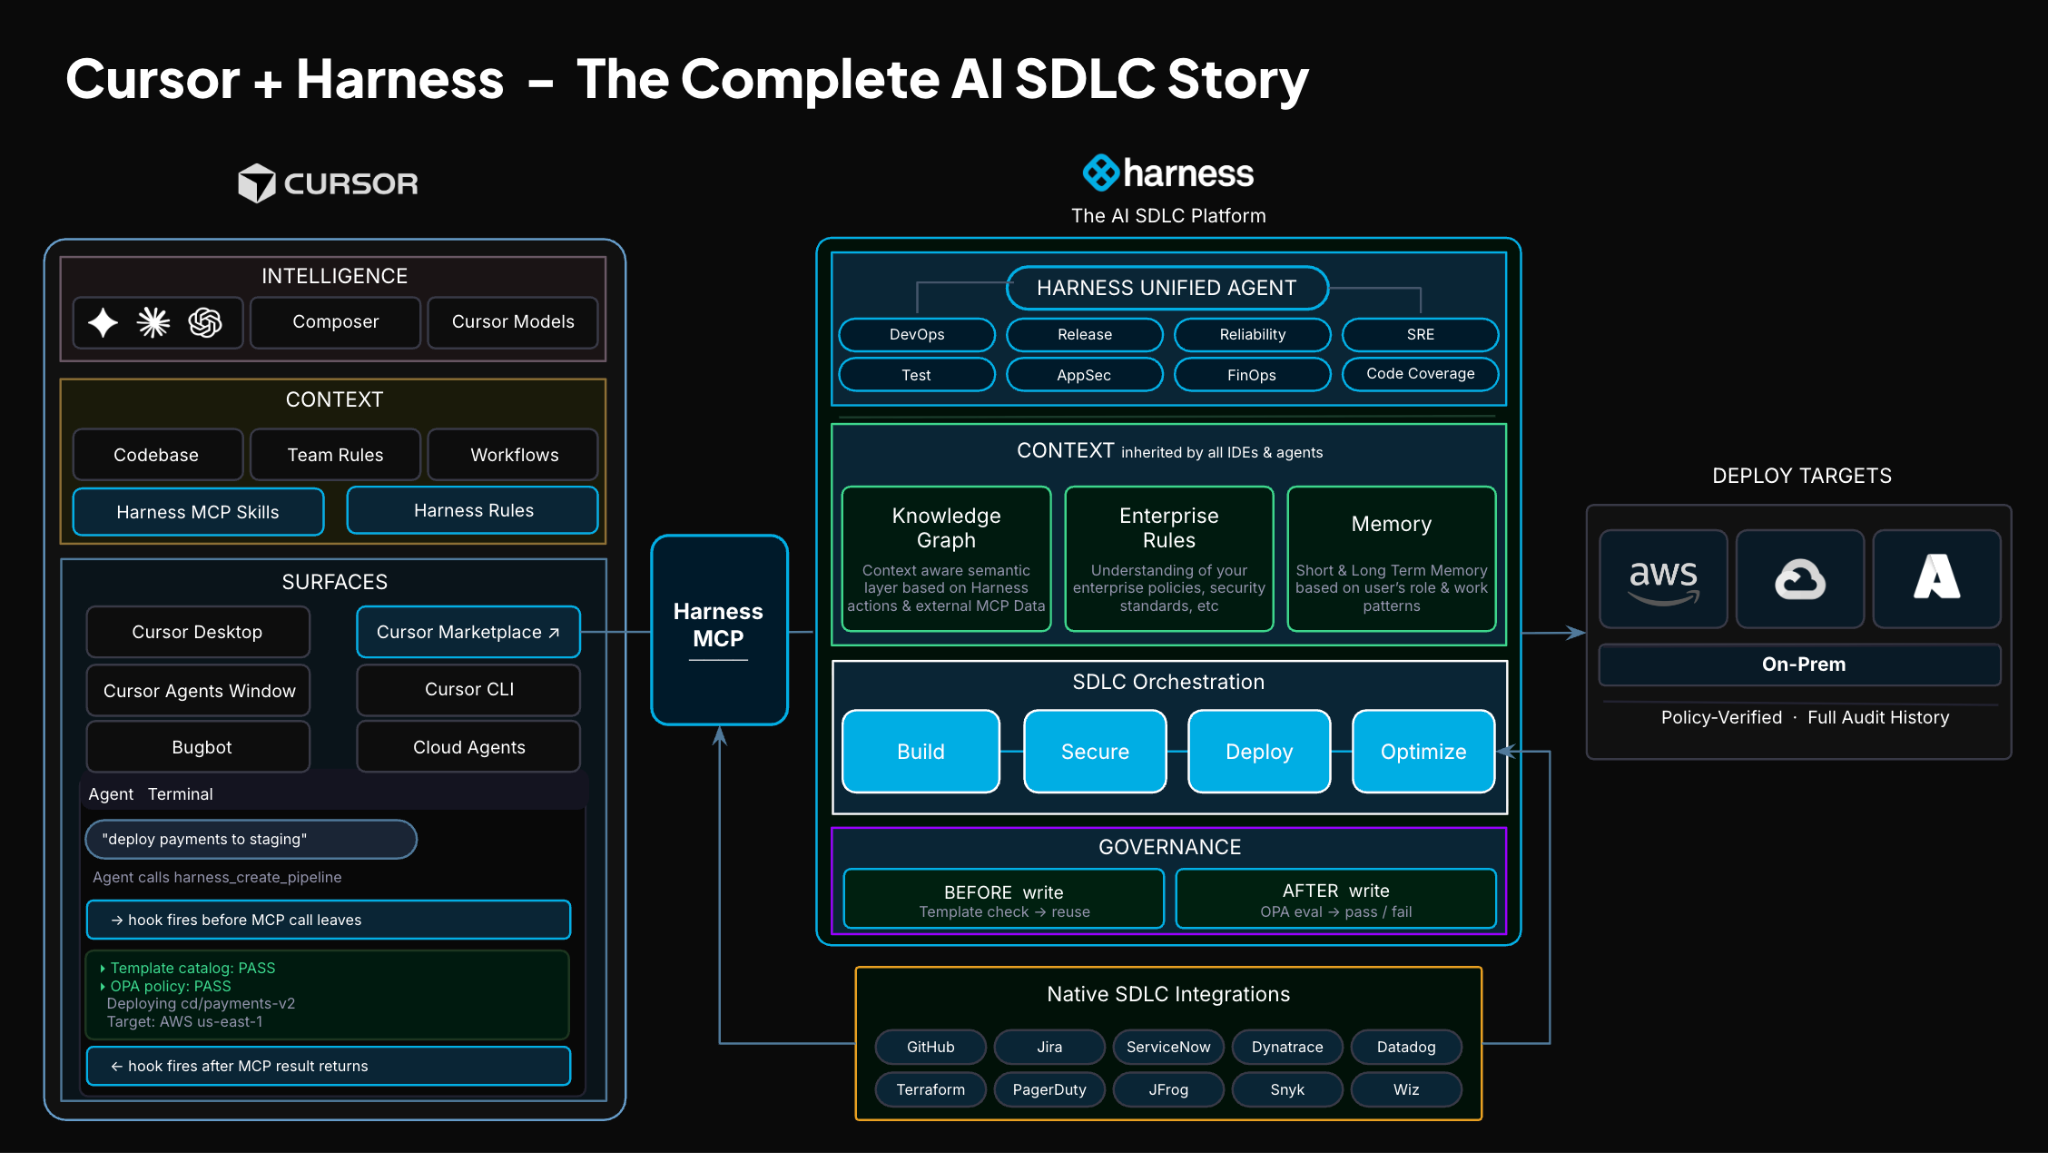
TLDR: Today, Harness is introducing the Harness Cursor Plugin, bringing the power of the Harness AI-native software delivery platform directly into Cursor. This integration, along with the Harness Secure AI Coding hook for Cursor, allows developers and AI agents to move from code changes to vulnerability detection, CI/CD execution, security validation, approvals, deployments, and operational insight without leaving the editor.
AI has completely changed how we write code. You can spin up functions, refactor entire files, and generate tests in seconds. The inner loop, writing and iterating on code, has never been faster. But the moment you try to ship that code, everything slows down. This is what we call the AI Velocity Paradox.
You are suddenly back to juggling pipelines, waiting on approvals, checking security scans, debugging failed runs, and bouncing between tools just to get a change into production.
That gap, between fast code and slow delivery, is what we kept running into. So we built something to fix it.
Today, we are introducing the Harness Plugin for Cursor, a way to go from PR to production without leaving your editor.
AI Made Coding Faster, But Delivery Did Not Catch Up
If you are using agentic coding tools, such as Cursor, you have probably felt this.
You can:
- Generate code instantly
- Understand unfamiliar repos faster
- Fix bugs and open PRs in minutes
But shipping still depends on everything outside your editor:
- CI/CD pipelines
- Security checks
- Approval flows
- Policy enforcement
- Deployment tooling
- Monitoring and debugging
And none of that got simpler just because AI showed up. In fact, AI makes the problem more obvious.
Now you can create changes faster than your delivery process can safely handle. And if those controls are not tight, you are introducing a whole new category of risk. Fast-moving code with fragmented governance.
AI did not break software delivery. It exposed how disconnected it already was.
What If You Could Just Ask
Instead of jumping between tools, what if you could just tell your editor what you want to happen?
Something like:
“Deploy PR #4821 to staging once the security scan passes, and Slack me if anything fails.”
That is the idea behind the Harness Cursor Plugin.
It connects Cursor directly to Harness, so you can trigger and manage your entire delivery workflow using natural language, right inside Cursor.
No tab switching. No manual orchestration. No guessing what is happening in the pipeline.
Some Sample Use Cases
Once connected, you can use Cursor to interact with your delivery system just as you do with your code.
For example, you can:

This builds on what we introduced last month, Secure AI Coding, which integrates directly with Cursor and scans code at the moment of generation rather than waiting for a PR review. Developers see inline vulnerability warnings with the option to send flagged code back to the agent for remediation, without leaving their workflow. Under the hood, it leverages Harness's Code Property Graph (CPG) to trace data flows across the entire codebase, surfacing complex vulnerabilities that simpler linting tools would miss.
The key thing is that you are no longer just interacting with code. You are interacting with the entire delivery system from the same place.
The Important Part: This Is Not Skipping Control
One of the biggest concerns with AI in delivery is obvious:
“Are we about to let agents push code to production without guardrails?”
No.
With Harness, everything runs through the controls that you can rely on:
- Granular RBAC permissions
- OPA policies
- Approval gates
- Audit logs
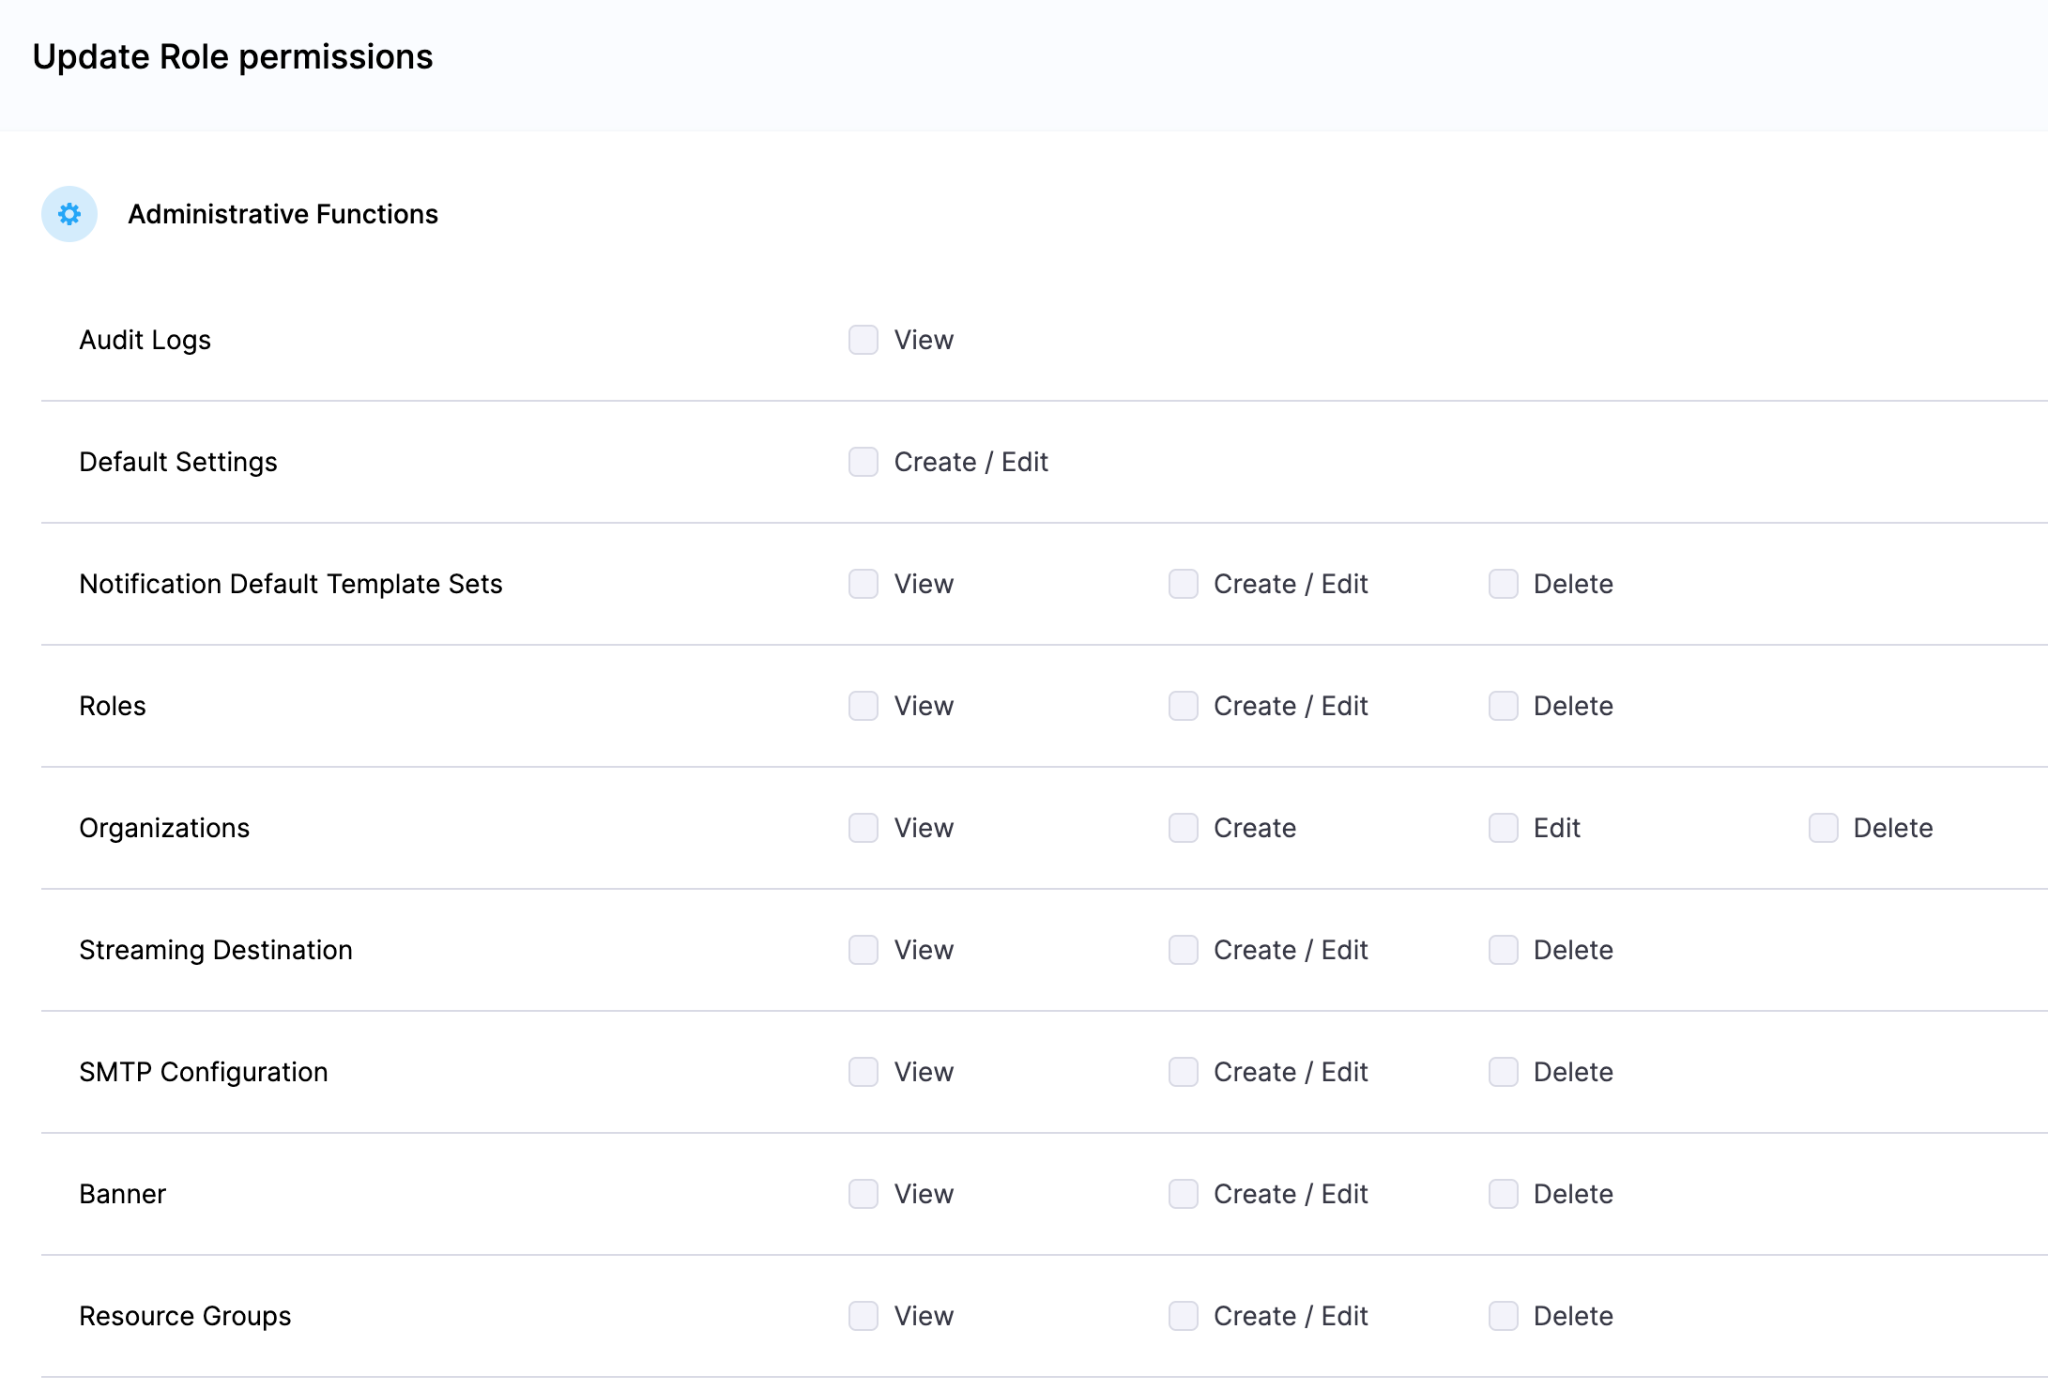
Instead of being manual checkpoints spread across tools, they are enforced automatically as part of the workflow while you stay in flow.
So AI can help move things faster, but it cannot bypass the governance that matters.
Why We Built It This Way
Most integrations today expose APIs or bolt AI onto existing systems. That is not what we wanted to do.
We designed the Harness Cursor Plugin specifically for how AI agents actually work:
- It is built around actions and workflows, not raw endpoints
- It spans the full delivery lifecycle, not just one step
- It gives agents enough context to reason about what to do next
Because shipping software is not a single action. It is a chain of decisions across CI, CD, security, approvals, and operations. If AI is going to help here, it needs access to that full picture. That’s where the Harness Software Delivery Knowledge Graph comes into play. It provides the necessary context for AI to take actions for you.
The knowledge graph models the relationships between services, pipelines, environments, policies, and operational signals in real time. Instead of treating each step in delivery as an isolated task, it creates a connected system of record that AI can reason over. This allows agents to understand not just what to do, but when and why to do it, based on dependencies, risk signals, and historical behavior.

In practice, this means smarter automation: deployments that adapt to context, approvals that are triggered based on policy and impact, and faster root cause analysis because the system already understands how everything is connected.
This Changes How Ideas Move To Prod
This is not just about convenience. It is a shift in how software actually moves from idea to production.
Instead of:
- Writing code in one place
- Managing delivery somewhere else
- And stitching it all together manually
You get a single, connected workflow:
- Code to pipeline to validation to deployment to operations
All accessible from your editor. Cursor accelerates the building. Harness governs the shipping. And the handoff between the two disappears.
Watch the demo:
Getting Started
If you want to try it:
- Install the Harness Cursor Plugin from the Cursor Marketplace
- Authenticate with Harness using OAuth. No API keys or setup headaches
- Start using natural language to run pipelines, debug issues, and manage deployments
For example:
“Run the CI pipeline for this branch, check if the security scan passed, and promote to staging if it did.”
That is it.
AI is not just changing how we write code. It is changing expectations for how fast we should be able to ship it. But speed without control does not work in real environments. What we are building toward is something simpler:
A world where every step, from PR to production, is:
- Fast
- Governed
- Observable
- Auditable
Without forcing developers to leave their flow. This plugin is one step in that direction.
Latest Blogs

Install Terraform: Secure & Scalable IaC Setup Guide
When you install Terraform without considering security and scale from the start, you build technical debt that manifests as state corruption, credential leaks, and configuration drift across teams. A proper Terraform installation guide addresses these operational realities before the first `terraform apply` runs.
This article walks through how to install Terraform with security hardening and scalability built into the foundation. You'll learn platform-specific installation steps, configuration best practices that prevent common pitfalls, and setup patterns that support team workflows without creating bottlenecks. By the end, you'll have a production-ready Terraform configuration management approach that scales with your infrastructure needs.
Understanding Terraform Installation Requirements
Before you install Terraform, understand what changes when you move from local experimentation to production automation. The binary itself is stateless, but the workflows it enables are anything but. Production Terraform deployments require state management, secret handling, version control, and team coordination.
Naive Terraform setup best practices focus on getting the CLI working. Real infrastructure as code security starts with recognizing that Terraform manages privileged access to your infrastructure. Every installation decision affects how credentials are stored, how state is accessed, and how teams collaborate without stepping on each other's changes.
At scale, the installation becomes less about the binary and more about the surrounding toolchain: where state lives, how modules are versioned, how plans are reviewed, and how drift gets detected. The baseline installation must anticipate these concerns, not retrofit them later.
How to Install Terraform Across Platforms
The installation process varies by platform, but the security and scalability considerations remain consistent.
Linux Installation
For Linux systems, install Terraform using the package manager to ensure automatic updates and signature verification:
wget -O- https://apt.releases.hashicorp.com/gpg | sudo gpg --dearmor -o /usr/share/keyrings/hashicorp-archive-keyring.gpg
echo "deb [signed-by=/usr/share/keyrings/hashicorp-archive-keyring.gpg] https://apt.releases.hashicorp.com $(lsb_release -cs) main" | sudo tee /etc/apt/sources.list.d/hashicorp.list
sudo apt update && sudo apt install terraform
This approach ensures signature verification on every package update. Manual binary downloads bypass this verification, introducing supply chain risk that becomes significant at scale.
macOS Installation
On macOS, use Homebrew for managed updates and version control:
brew tap hashicorp/tap
brew install hashicorp/tap/terraform
Homebrew maintains the formula and handles dependency resolution. For teams managing multiple IaC tool versions, consider using `tfenv` to switch between Terraform versions without breaking existing workflows.
Windows Installation
For Windows environments, use Chocolatey for automated infrastructure provisioning:
choco install terraformAlternatively, download the binary and add it to your system PATH. For enterprise environments, package the binary in your internal software distribution system to control which versions reach production workstations.
Version Management
After installation, verify the version and establish a version pinning strategy:
terraform versionLock your Terraform version in version control using a `.terraform-version` file or required_version constraint in your configuration. This prevents the "works on my machine" problem that emerges when different team members run different CLI versions.
Secure Infrastructure Automation Configuration
Once Terraform is installed, configure it for secure operations. The default configuration works for learning, but production deployments require explicit security boundaries.
State Backend Configuration
Never store Terraform state locally in production. Configure a remote backend before applying any infrastructure changes:
terraform {
  backend "s3" {
    bucket         = "prod-terraform-state"
    key            = "infrastructure/terraform.tfstate"
    region         = "us-east-1"
    encrypt        = true
    dynamodb_table = "terraform-locks"
  }
}
Remote backends provide state locking, preventing concurrent modifications that corrupt infrastructure state. Encryption at rest protects sensitive values stored in state. State locking using DynamoDB prevents race conditions when multiple pipelines run simultaneously.
Credential Management
Configure Terraform to retrieve credentials from external systems, not from configuration files:
export AWS_PROFILE=prod-automation
export ARM_CLIENT_ID="${AZURE_CLIENT_ID}"
export GOOGLE_APPLICATION_CREDENTIALS="/path/to/service-account.json"
Avoid hardcoding credentials in provider blocks. Use environment variables, credential files outside the repository, or integrate with secret management systems like HashiCorp Vault. Each credential leak represents infrastructure-wide exposure, not just a single service compromise.
Provider Configuration
Pin provider versions explicitly to prevent breaking changes from automatic updates:
terraform {
  required_providers {
    aws = {
      source  = "hashicorp/aws"
      version = "~> 5.0"
    }
  }
}
The `~>` constraint allows patch updates while preventing major version changes that introduce breaking API modifications. Test provider updates in non-production environments before promoting to production workflows.
## Scalable IaC Deployment Setup
When teams grow beyond a few engineers, installation alone doesn't solve workflow problems. Scalability requires workspace organization, module management, and drift detection.
### Workspace Structure
Organize workspaces by environment and team ownership:
terraform workspace new prod-networking
terraform workspace new prod-compute
terraform workspace new staging-networking
Workspaces isolate state, but they share backend configuration. For stronger isolation, use separate backend configurations per environment. This prevents accidental production modifications when someone forgets to switch workspaces.
Module Registry Access
Configure access to private module registries if you're standardizing infrastructure patterns:
module "vpc" {
  source  = "app.terraform.io/org-name/vpc/aws"
  version = "2.1.0"
}
Private registries enforce versioning and provide a central distribution point for validated infrastructure patterns. Without this, teams copy-paste configurations and diverge over time.
CI/CD Pipeline Integration
Integrate Terraform into your deployment pipelines rather than running it manually:
terraform-plan:
  script:
    - terraform init
    - terraform plan -out=tfplan
  artifacts:
    paths:
Automated pipelines provide audit trails, prevent manual errors, and enforce approval workflows. The plan artifact becomes a reviewable object, not just terminal output that disappears.
Common Installation and Configuration Pitfalls
Even with proper installation, several failure modes appear at scale.
State File Mismanagement
Teams often start with local state and migrate to remote backends later. This migration is error-prone. State files contain the complete infrastructure mapping, and any corruption during migration creates reconciliation problems. Always initialize with remote backends, even in development environments, to avoid migration complexity.
Version Drift
Without version constraints, different team members run different Terraform versions. A feature that works in 1.6 might fail in 1.5, or worse, succeed with different behavior. Version drift causes "flaky" infrastructure that works sometimes and fails others, depending on who ran the command.
Credential Exposure
Storing credentials in Terraform configuration files or state exposes them in version control and state storage. Even encrypted backends store credentials if you hardcode them in provider blocks. Use dynamic credential retrieval from external systems, not static credentials embedded in code.
Concurrent Modifications
Without state locking, two people running `terraform apply` simultaneously corrupt state. The second run overwrites partial changes from the first, leaving infrastructure in an undefined state that doesn't match reality or the code. Always configure state locking before any team uses Terraform.
How Harness IaCM Extends Terraform Enterprise Installation
Installing and configuring Terraform solves the technical problem, but operational scale requires governance layers that prevent drift, enforce policies, and provide visibility across teams.
Harness Infrastructure as Code Management handles the surrounding operational concerns while treating the IaC engine choice as an implementation detail. It supports OpenTofu, Terraform, and Terragrunt, allowing teams to work with their existing tooling while gaining centralized governance.
The platform provides a module registry that acts as a single source of truth for validated infrastructure patterns. Instead of teams copy-pasting configurations or maintaining dozens of module repositories, they pull from a central registry with versioning and access controls. This solves the "how do we standardize without blocking teams" problem that manual installation approaches leave unaddressed.
Variable sets and workspace templates eliminate repetitive configuration. Define backend settings, provider configurations, and common variables once, then apply them across environments. This prevents the credential leaks and version drift that emerge when each team member configures Terraform independently.
Default pipelines automate the plan-review-apply workflow without requiring custom CI/CD setup. Every infrastructure change follows the same approval process, creating audit trails and preventing manual `terraform apply` commands that bypass governance. The pipeline becomes the interface, not the CLI.
Drift detection runs continuously, comparing actual infrastructure state against the declared configuration. When someone makes a manual change outside Terraform, drift detection flags it before it cascades into broader problems. This visibility prevents the "infrastructure doesn't match code" problem that invalidates Infrastructure as Code benefits.
Policy enforcement using Open Policy Agent blocks non-compliant configurations before they reach production. Instead of discovering security violations after deployment, policies fail the plan stage. This shifts compliance left without requiring manual review of every Terraform plan output.
For installation workflows, this means you set up Terraform once, configure it to work with Harness, and let the platform handle the operational complexity. Teams still write Terraform code, but they don't manage state backends, configure pipelines, or build custom drift detection. The installation becomes simpler because the surrounding automation is handled centrally.
Learn more about [Harness Infrastructure as Code Management] or explore the [documentation] for configuration details.
Frequently Asked Questions
What is the difference between installing Terraform locally versus in a CI/CD pipeline?
Local installation is for testing and development. CI/CD pipeline installation automates the deployment workflow, enforces consistency, provides audit trails, and prevents manual errors that bypass governance controls.
How do I manage multiple Terraform versions across projects?
Use version management tools like `tfenv` or `asdf` to switch between versions per project. Pin the required version in your Terraform configuration using the `required_version` constraint to prevent version drift.
Can I install Terraform without internet access in air-gapped environments?
Yes. Download the binary from HashiCorp's release page, verify the SHA256 checksum, and distribute it through your internal software management system. Configure private module registries and provider mirrors for dependency management.
What happens if I forget to configure state locking?
Concurrent Terraform runs will corrupt your state file, leaving infrastructure in an undefined state that doesn't match your code or reality. Always configure state locking using DynamoDB, Azure Blob Storage lease, or Google Cloud Storage consistency tokens.
How do I migrate from local state to a remote backend?
Run `terraform init -migrate-state` after configuring the backend block. Terraform will copy the local state to the remote backend and delete the local file. Back up your local state before migration in case the process fails.
Conclusion
Installing Terraform is straightforward, but setting it up for secure infrastructure automation and scalable IaC deployment requires planning beyond the binary download. Remote state backends, credential management, version pinning, and workspace organization prevent the operational failures that emerge when teams scale Infrastructure as Code beyond individual contributors.
The installation provides the foundation, but production reliability comes from the surrounding governance: how state is managed, how credentials are secured, how changes are approved, and how drift is detected. These concerns don't disappear with better tooling, but platforms like Harness IaCM centralize them, allowing teams to focus on infrastructure logic rather than operational mechanics.
Start with a secure Terraform installation guide that addresses backend configuration, credential management, and version control. Build workflows that enforce these patterns across teams. When operational complexity grows beyond manual coordination, evaluate platforms that automate the governance layer while preserving your existing Terraform workflows.

Cloud Cost Optimization Strategy: Fix Your Approach
Your cloud cost optimization strategy just flagged a $47,000 anomaly in last month's Kubernetes spend. Finance wants answers. Engineering claims everything is running normally. Platform teams are scrambling through logs. Three hours later, you discover the spike came from a staging environment that someone forgot to tear down after a load test two weeks ago. The tooling caught the symptom. Your approach missed the disease.
This scenario repeats across organizations daily. Teams invest in sophisticated monitoring, deploy dashboards, set up alerts, then watch their cloud bills climb anyway. The problem is not the tooling. It is the assumption that visibility alone drives accountability.
Why Traditional Cloud Cost Optimization Approaches Fail
Most cloud cost optimization challenges stem from treating cost management as a periodic cleanup exercise rather than an operational discipline. Organizations implement dashboards, generate monthly reports, and schedule quarterly reviews. Then they wonder why engineers ignore the recommendations and spend continues growing.
The gap lies in the feedback loop. When cost data arrives weeks after the spending decision, engineers cannot connect their architectural choices to financial outcomes. A developer deploys a new microservice with default resource requests. Three weeks later, someone in finance notices the overprovisioning. By then, the service is in production, and rightsizing it requires another deployment cycle that nobody prioritizes.
This delayed accountability creates a culture where cost optimization becomes someone else's problem. Engineering builds features. Finance tracks spending. Platform teams inherit the reconciliation work. Nobody owns the relationship between technical decisions and their financial consequences.
The Reactive Cycle That Perpetuates Cloud Cost Optimization Challenges
Reactive cloud cost management approaches follow a predictable pattern. Teams deploy infrastructure, operate services, receive bills, analyze spending, identify waste, create tickets, prioritize work, and finally implement fixes. By the time optimization happens, new inefficiencies have already accumulated.
Consider how teams handle idle resources. Someone notices an underutilized EC2 instance during the monthly cost review. They create a ticket to investigate. Engineering confirms it is no longer needed. The ticket goes into the backlog. Two sprints later, someone finally terminates the instance. Meanwhile, that resource consumed another $600 in unnecessary spend.
This reactive model fails at scale because cloud environments change faster than monthly review cycles can track. Teams launch experiments, provision temporary infrastructure for testing, scale services to handle traffic spikes, then forget to scale back down. Each decision makes sense in isolation. Collectively, they create persistent waste that compounds month over month.
The FinOps strategy required to break this cycle involves embedding cost accountability into the workflows where spending decisions actually happen, not bolting it on afterward through reporting.
Building a Cloud Cost Governance Framework That Scales
Effective cloud spend optimization requires governance mechanisms that operate in real time, not historical analysis. Teams need to understand the cost implications of their architectural choices before those choices reach production, not weeks later when bills arrive.
This means establishing cost guardrails at the infrastructure provisioning layer. When an engineer requests resources, they should see projected spend alongside technical specifications. When a team deploys a new service, cost allocation should happen automatically based on tagging policies. When usage patterns change, teams should receive immediate feedback about the financial impact.
The cloud cost governance framework must also address ownership boundaries. Which team owns the cost of shared infrastructure? How do you allocate spending for platform services consumed by multiple applications? Who decides when optimization work takes priority over feature development?
Organizations that answer these questions clearly create sustainable cloud cost optimization best practices. Those that leave ownership ambiguous end up with fragmented accountability where nobody feels responsible for the overall spend.
Implementing a Sustainable Cloud Cost Management Approach
A functioning cloud cost management approach requires three operational components: real-time visibility into spending patterns, automated allocation to responsible teams, and integration with existing development workflows.
Real-time visibility means engineers see cost data during development, not during retrospectives. When someone modifies resource requests in a Kubernetes manifest, they should understand the monthly cost difference immediately. When a team considers using a managed service versus self-hosting, cost implications should inform the architectural discussion.
Automated allocation eliminates the manual reconciliation work that consumes platform team capacity. Tags applied during resource provisioning should automatically map spending to teams, services, and environments. Cost data should flow into the same systems teams already use for capacity planning and incident management.
Workflow integration ensures cost optimization does not become isolated work. Rightsizing recommendations should appear in pull requests. Anomaly alerts should route to the same channels as performance alerts. Budget tracking should connect to the same approval workflows used for infrastructure changes.
This integration transforms cost optimization from something teams do occasionally to something embedded in how they operate continuously.
How Harness Cloud Cost Management Enables Governance at Scale
Harness Cloud & AI Cost Management addresses these operational requirements by treating cost visibility as infrastructure, not reporting. The platform provides real-time cost tracking across AWS, Azure, and GCP, with automatic allocation based on Kubernetes labels, cloud tags, and organizational structure.
Teams get cost breakdowns by service, environment, and business unit without manual tagging reconciliation. Budget tracking operates continuously with anomaly detection that routes alerts to the teams responsible for the spending. Optimization recommendations appear in context where engineers already work, not in separate dashboards they need to remember to check.
The governance capabilities extend beyond visibility. Harness CCM enables policy-based cost controls that prevent wasteful configurations before they reach production. Teams can set budget guardrails, enforce tagging policies, and establish approval workflows for high-cost resources.
This approach shifts cost accountability left in the development process. Engineers see the financial impact of their decisions during design and implementation, when changes are cheap to make. Platform teams get automated allocation that eliminates manual reconciliation. Finance gets accurate forecasting based on actual resource usage patterns.
Because Harness CCM integrates with broader platform and delivery workflows, cost optimization becomes part of the deployment process rather than separate cleanup work. Rightsizing recommendations flow into the same pipelines teams use for continuous delivery. Cost trends inform capacity planning alongside performance metrics.
For organizations implementing FinOps practices at scale, this integration matters. Cost management cannot operate in isolation from the technical workflows that generate spending. Tools that treat cost as an afterthought create friction that engineering teams route around. Platforms that embed cost visibility into existing processes enable the shared ownership required for sustainable optimization.
The platform documentation provides implementation patterns for teams moving from reactive cost management to proactive governance. The product roadmap shows ongoing investment in capabilities that strengthen cost accountability across the software delivery lifecycle.
Establishing Sustainable Cloud Cost Optimization Best Practices
Sustainable optimization requires treating cost as an operational concern, not a financial reporting problem. Teams that build cost awareness into their development practices avoid the accumulation of waste that reactive approaches never fully eliminate.
This cultural shift begins with transparency. When every team sees their spending in real time, cost becomes a shared responsibility. When budgets connect to technical decisions, engineers understand the financial consequences of architectural choices. When optimization recommendations appear during code review, addressing inefficiency becomes part of normal development work.
Organizations implementing this approach report sustained reductions in cloud spend without sacrificing delivery velocity. Engineering teams make better trade-offs because they understand cost implications alongside technical considerations. Platform teams spend less time on manual reconciliation and more time on automation that prevents waste. Finance gets predictable spending patterns because budgets connect to the workflows that generate costs.
The key is embedding cost accountability where spending decisions happen, then providing the guardrails and visibility required to act on that accountability continuously.
---
Your staging environment is still running. The difference is that now you know about it immediately, the responsible team gets an automatic alert, and your governance policies prevent similar waste from accumulating next time. That is not better reporting. That is a better approach.

You're Not Overspending, You're Under-Saving: A New FinOps Paradigm
Ever wonder why your FinOps savings optimization efforts feel like playing whack-a-mole with service quotas while your CFO still asks why cloud spend keeps climbing? You're not alone. Most teams approach cost management as a quarterly fire drill—identify overruns, kill underutilized resources, negotiate better rates, then repeat the cycle three months later.
In recent years a more accurate framing has emerged—and it’s reshaping how leading enterprises approach cloud economics:
You’re not overspending. You’re under-saving.
That shift isn’t just a catchy line. It’s the difference between reacting to cloud bills and systematically capturing savings before waste ever becomes spend. And once you see cloud cost through this lens, it becomes clear why so many cloud programs plateau: they’re trying to optimize after the fact.
The problem isn't that teams are spending recklessly. It's that they're systematically missing the largest pool of potential savings: the costs they never should have incurred in the first place.
The Real FinOps Paradigm Shift: From Cost Control to Value Creation
The traditional cloud cost savings strategy treats spend as a problem to solve after deployment. Teams spin up infrastructure, run workloads for weeks or months, then scramble when finance flags the variance. By then, architectural decisions are locked in. Instance families are chosen. Data transfer patterns are established.
The opportunity to prevent those costs expired the moment the first commit hit production.
The real FinOps paradigm shift isn’t better dashboards or faster anomaly alerts. It’s moving from cost control (looking backward) to value creation (looking forward). When we focus on overspending, we’re asking: What went wrong? When we focus on under-saving vs overspending, we’re asking: What could have been optimized?
Because here’s the uncomfortable truth:
Every unsaved dollar is a lost opportunity — and those opportunities can compound quickly.
Why Traditional FinOps Cost Optimization Frameworks Miss the Target
Standard FinOps cost optimization frameworks focus on three levers: rightsizing, commitment-based discounts, and resource lifecycle management. These tactics work. They're also insufficient at scale because they treat the symptom, not the cause.
- Rightsizing saves 15-20% on compute that shouldn’t be running at that scale in the first place.
- Reserved instances lock in discounts on workloads that might disappear next quarter.
- Automated shutdowns prevent idle waste but don’t question why the resource exists.
And most importantly: traditional FinOps often assumes you already have attribution solved.
But most organizations don’t.
At the last FinOpsX conference, one stat stood out because it explains why cost programs stall:
Only 37% of enterprise companies can achieve 80% or greater tagging accuracy for showback purposes.
Meaning: most enterprises are “flying blind” on a meaningful chunk of their spend. Not because they lack dashboards—but because they can’t reliably connect costs to owners, services, or outcomes.
The Foundation: You Can’t Optimize What You Can’t Attribute
The path to meaningful cloud optimization starts with a simple truth:
You can’t optimize what you can’t attribute.
Yet most organizations struggle with basic cost attribution, leaving 40–60% of their spend unallocated across:
- Shared resources with no clear ownership split
- Legacy systems with unknown owners
- Cross-functional services used by multiple teams
- Infrastructure components that span business units
This isn’t just a reporting problem. It’s an optimization blocker.
Because if teams can’t see their real costs, they can’t make informed decisions about architecture, service ownership, or operational tradeoffs. They default to safe-but-expensive patterns: overprovisioning, indefinite retention, and “just in case” redundancy.
That’s not overspending. That’s under-saving.
Proactive Cloud Cost Management Starts Before Deployment (Not After the Invoice)
Shifting to proactive cloud cost management requires embedding cost awareness into engineering workflows, not appending it afterward.
That means surfacing estimated spend during:
- Code review
- CI pipelines
- Infrastructure as Code changes
- deployment approvals
This isn’t about blocking deployments or adding bureaucratic gates. It’s about making cost a first-class design constraint, like latency or error rates.
The most innovative FinOps organizations are moving toward what is called a “zero drift” model: embedding cost optimization directly into the development and deployment pipeline so inefficiency never ships.
Instead of discovering optimization opportunities after resources are deployed, zero drift ensures that:
- Infrastructure is provisioned with optimal configurations from day one
- Tagging policies are enforced at deployment time
- Resource selections align with existing commitment purchases
- Guardrails prevent expensive mistakes before they happen
This is where the best cloud savings opportunities actually live: not in post-hoc cleanup, but in pre-production prevention.
Beyond Dashboards: Always-On Systems That Never Sleep
Real savings don’t come from dashboards. They come from systems that never sleep.
Traditional FinOps relies on periodic reviews and manual interventions. But modern cloud environments are too dynamic for that. Workloads shift daily. Teams deploy constantly. Kubernetes autoscaling changes cost behavior in real time. No human review process can keep up.
To maximize cloud cost efficiency, optimization has to be:
- Continuous
- Automated
- Anforced through governance
- Connected to engineering workflows
This is the difference between a FinOps program that “reports” and a FinOps program that actually saves.
Cloud Cost Governance Best Practices That Scale with Teams
Effective cloud cost governance best practices balance autonomy with accountability. Overly restrictive policies slow teams down and create shadow IT. Overly permissive policies lead to unchecked spend and architectural drift.
The solution is policy-driven guardrails that prevent obvious waste without requiring centralized approval for every resource change.
Examples include:
- Enforcing tagging standards for cost allocation
- Setting spend thresholds that trigger reviews
- Flagging resources that violate efficiency baselines
- Requiring approved instance families in production
- Blocking deployments when mandatory tags are missing
Tagging discipline remains the foundation. Without consistent tagging, showback and chargeback models collapse, and optimization becomes guesswork.
Engineering Economics: Making Optimization Everyone’s Job
One of the biggest blockers in traditional FinOps is the disconnect between:
- The teams who identify optimization opportunities (finance)
- And the teams who must implement them (engineering)
This is why cost optimization often feels like cost policing.
To fix it, organizations need to make cloud cost management an engineering discipline—supported by unit economics and workflow integration.
High-performing teams connect technical decisions to business outcomes using metrics like:
- Cost per transaction
- Cost per user
- Cost per deployment
- Cost per environment
- Cost per SKU
When engineers can see how their architectural choices translate to dollars, optimization becomes a natural part of delivery—not an external mandate.
How Harness Cloud Cost Management Enables Proactive FinOps Savings Optimization
Harness Cloud & AI Cost Management provides the visibility and control infrastructure needed to shift from reactive cost cuts to proactive savings.
Unlike platforms built primarily for post-invoice reporting, Harness integrates cost awareness directly into deployment workflows—surfacing spend data at the point where engineering decisions are made.
Harness CCM strengthens FinOps savings optimization through:
1) Intelligent rule-based retro-tagging
Most enterprises don’t reach consistent tagging accuracy manually. Harness CCM solves this with automated retro-tagging that classifies untagged resources using:
- resource groups
- naming conventions
- subscription metadata
- deployment pipeline data
This can help organizations achieve tagging accuracy up to 98%, unlocking reliable showback, chargeback, and accountability.
2) Shared cost allocation for real attribution
Harness CCM supports sophisticated shared cost allocation so organizations can distribute costs (like AWS support contracts) proportionally based on actual usage—not arbitrary splits.
3) Always-on optimization systems
Harness CCM replaces periodic reviews with continuous automation, including:
- AI-powered right-sizing based on real workload requirements
- commitment orchestration that executes optimization actions daily
- anomaly prediction that flags spikes before budgets are impacted
- policy-driven guardrails that prevent drift in new deployments
4) Shift-left “zero drift” enforcement
Harness integrates with CI/CD and IaC workflows so teams can enforce cost policies at deployment time, including mandatory tagging and approved resource patterns.
The Path Forward: From Cost Cutting to Systematic Under-Saving Recovery
The transition from reactive cost cutting to proactive savings optimization requires three shifts:
- Fix attribution first (tagging + shared cost allocation)
- Move optimization from periodic to always-on
- Shift left to prevent waste from being deployed
These aren’t cultural aspirations. They’re engineering problems with technical solutions.
The organizations winning at cloud cost management aren’t the ones cutting budgets or negotiating better discounts. They’re the ones that stopped accepting architectural inefficiency as inevitable and started designing cost efficiency into every deployment.
The opportunity isn’t in finding waste after it accumulates.
It’s in building systems that prevent waste from ever becoming spend in the first place.
What To Go Deeper?
Watch our webinar, You’re Not Overspending, You’re Under-saving to learn more.
For teams looking to implement a cloud cost savings strategy that goes beyond reactive cuts, Harness CCM provides the operational foundation for proactive cost management. Learn more at or explore technical implementation details.

Boost Developer Productivity: 8 Key Questions
Why does developer productivity feel like it's declining even as your team grows? You hire more engineers, yet features ship slower. Sprint velocity looks healthy on paper, but deployment frequency tells a different story. The standups get longer, the Slack channels multiply, and somehow everyone is busy but nothing feels finished.
This disconnect isn't about effort. It's about visibility. Most engineering leaders lack the instrumentation to distinguish between legitimate delivery constraints and workflow friction that scales linearly with headcount. They track story points and commit counts while the actual bottlenecks hide in handoff delays, review queues, and context switching that never shows up in a burndown chart.
The following eight questions cut through vanity metrics to expose what actually moves the needle on software engineering efficiency. They're not comfortable questions. Some will reveal problems you'd rather not acknowledge. But answering them honestly is the difference between scaling a team and scaling chaos.
What Does Developer Productivity Actually Mean for Your Team?
Before you can improve engineering productivity metrics, you need to define what productivity means in your context. A platform team optimizing infrastructure has different success signals than a feature squad shipping user-facing changes. Conflating these creates metrics theater where everyone reports green while delivery quality erodes.
Developer productivity breaks into three layers that often conflict. Individual throughput measures coding speed and task completion. Team velocity captures collaborative output including reviews, deployments, and knowledge transfer. Business impact tracks whether engineering work actually moves strategic objectives forward.
The mistake is optimizing one layer at the expense of others. A developer cranking out pull requests might be fragmenting the codebase. A team hitting sprint commitments might be ignoring technical debt that will crater velocity in six months. High deployment frequency means nothing if you're deploying the wrong features.
Define productivity through the lens of sustainable delivery. Can your team maintain current output six months from now without burning out? Are you building technical leverage or accumulating complexity tax? The answers shape which metrics matter.
Are You Measuring Activity or Outcomes?
Lines of code, commit frequency, and hours logged are activity metrics. They tell you what engineers are doing, not whether it matters. Activity metrics create perverse incentives where developers optimize for measurement rather than impact.
Developer workflow optimization requires outcome-based measurement. How long does it take to ship a customer-facing change from commit to production? What percentage of deployments require rollback? How many production incidents trace back to code merged in the last sprint? These questions connect engineering work to business consequences.
DORA metrics provide a framework grounded in delivery outcomes. Deployment frequency, lead time for changes, change failure rate, and time to restore service capture the feedback loops that separate high-performing teams from the rest. They're leading indicators of engineering health because they measure your ability to deliver value reliably.
The trap is collecting DORA metrics without understanding the workflows they represent. A team with high deployment frequency but terrible lead times might be shipping small cosmetic changes while complex features rot in long-lived branches. Context matters more than the numbers.
Where Are Your Team Productivity Measurement Blind Spots?
Most engineering organizations track what's easy to measure and ignore what actually constrains throughput. Pull request metrics are abundant. Build system performance data is scattered across Jenkins logs. Incident response times live in PagerDuty. Requirements churn never gets quantified at all.
Team productivity measurement fails when it doesn't capture the space between commits. How long do pull requests sit in review queues? What percentage of engineering time goes to unplanned work driven by production issues? How often do spec changes force rework after development starts? These invisible delays compound into delivery drag that conventional metrics miss entirely.
Workflow visibility requires stitching data across systems. Source control shows when code was written, not when it was ready for review. CI pipelines show build duration, not queue time. Issue trackers show ticket status, not the three days spent waiting for product clarification. Without integration, you're optimising local maxima while system-level bottlenecks persist.
The hardest blind spot is cultural. Are engineers afraid to flag blockers because leadership interprets them as excuses? Does your retrospective process surface genuine impediments or just generate action items that never get addressed? Measurement infrastructure means nothing if teams don't trust the data will be used constructively.
What Percentage of Your Engineering Capacity Goes to Unplanned Work?
Unplanned work is the silent killer of developer experience. Every production incident, urgent bug fix, and surprise escalation from sales interrupts flow state and fractures focus. A team that looks 80 percent utilized on sprint planning is actually 50 percent effective after accounting for firefighting.
Engineering velocity collapses under unplanned work load because context switching isn't free. Dropping a feature branch to fix a production issue costs more than the fix itself. You lose the mental model of what you were building, the architectural decisions that informed your approach, and the momentum toward completion. Regaining that context takes time measured in hours, not minutes.
Track interrupt ratio as a first-class metric. What percentage of story points delivered each sprint were unplanned? How many engineer-days per month go to incidents versus roadmap work? How often do critical path features miss deadlines because the team was pulled into emergency mode? These numbers reveal whether you're running an engineering organization or an operational fire brigade.
Reducing unplanned work requires investment in reliability, observability, and proactive incident prevention. It also requires saying no. Not every escalation is truly urgent. Not every bug justifies interrupting a sprint. Protecting engineering focus is a leadership decision, not a technical one.
How Long Does It Take to Get Feedback on Code Quality?
Developer productivity tools only matter if they shorten feedback loops. A test suite that takes four hours to run might catch bugs, but it trains developers to batch changes and avoid frequent commits. A pull request that sits for three days accumulates merge conflicts and bit rot. Delayed feedback is expensive feedback.
Fast feedback enables iterative improvement. Developers adjust their approach based on test results, review comments, and production behaviour. When that feedback arrives within minutes instead of days, quality improvements compound. Code reviews become conversations instead of asynchronous bottlenecks. Bugs get caught before they escape the developer's working memory.
The goal isn't just speed. It's actionability. A CI pipeline that fails instantly but produces cryptic error messages creates frustration, not productivity. A monitoring system that alerts on every minor blip trains teams to ignore signals. Feedback quality matters as much as feedback speed.
Measure feedback latency across the entire delivery pipeline. How long from commit to CI results? From pull request open to first review? From merge to production deploy? From deploy to user impact visibility? Each delay point represents an opportunity for improvement or a constraint that's being accepted as the cost of doing business.
Are Your Engineering Productivity Metrics Driving the Wrong Behavior?
Metrics shape behavior. Measure pull request volume and developers will split changes into trivially small commits. Measure story points completed and teams will game estimation. Measure individual output and collaboration suffers. The question isn't whether metrics influence behaviour but whether they're encouraging the behaviour you actually want.
Engineering productivity metrics should reinforce team health and sustainable delivery. DORA metrics work because they measure system-level outcomes that require collaboration to improve. You can't game deployment frequency without also improving your build and test infrastructure. You can't fake low change failure rates without investing in quality practices.
The danger is treating metrics as performance scorecards instead of diagnostic tools. When management uses productivity data to rank individuals or teams, trust evaporates. Engineers optimize for metrics instead of outcomes. The dashboards stay green while delivery quality degrades. Productivity measurement becomes counterproductive.
Use metrics to surface questions, not assign blame. Why did lead time spike last month? What's causing the increase in change failure rate? Where are the review bottlenecks that slow down this particular team? The goal is to identify improvable constraints, not to shame teams into working faster.
Do You Understand the Relationship Between Developer Experience and Business Outcomes?
Developer experience directly impacts business results through retention, velocity, and quality. Engineers who spend half their day fighting broken tooling deliver less value. Teams that can't deploy without manual approvals ship slower. Organisations that ignore developer frustration lose their best people to competitors with better engineering cultures.
Poor developer experience compounds. A slow build system adds minutes to every code change. A flaky test suite makes deployments risky. An overloaded review process creates merge conflicts. Each friction point individually seems minor. Together, they create an environment where shipping software feels like pushing a boulder uphill.
The business case for improving software engineering efficiency is straightforward. Faster feedback loops mean faster iteration. Lower change failure rates mean less time spent on incident response. Better tooling means engineers spend more time building and less time fighting infrastructure. These improvements show up in reduced time to market and higher team output.
Track developer experience through both quantitative and qualitative signals. Survey results capture sentiment. Turnover rates reveal whether frustration is driving attrition. Deployment frequency and lead time show whether workflow improvements translate to delivery acceleration. The combination paints a complete picture of engineering health.
How Does Harness SEI Answer These Questions?
Most engineering organizations already collect a lot of data. The problem isn’t a lack of metrics — it’s that the signals are scattered across different systems.
Code activity lives in source control. Build performance sits inside CI pipelines. Work tracking happens in ticketing systems. Incident response lives somewhere else entirely. Each tool tells part of the story, but none of them show how work actually flows through the delivery system.
Harness Software Engineering Insights (SEI) connects those signals so engineering leaders can understand what’s really happening across the development lifecycle.
Connecting the delivery data
SEI integrates with the tools engineering teams already use — including source control platforms and issue tracking systems — and consolidates that data into a unified view of engineering delivery.
Instead of looking at isolated reports from individual systems, teams can analyze how work moves from planning to development, through code review, and into deployment. This makes it easier to see where delays accumulate and how workflow patterns change over time.
Measuring delivery performance
SEI provides built-in engineering delivery metrics, including industry-standard indicators such as DORA metrics and pull request lifecycle analytics.
These metrics help answer questions like:
- How long does it take for a change to move from development to deployment?
- Where do pull requests spend the most time waiting?
- Are deployment and delivery patterns improving or slowing down?
Because these metrics track system-level outcomes rather than individual activity, they provide a more reliable view of engineering performance.
Visualizing workflow trends
SEI surfaces these signals through configurable Insights dashboards, where engineering leaders can explore delivery trends and drill into the underlying data.
These dashboards make it easier to identify patterns that aren’t obvious from individual tools — for example, whether review queues are slowing down merges, whether certain teams experience longer lead times, or whether workflow improvements are actually reducing delivery friction.
Instead of reacting to anecdotal feedback, teams can use these insights to investigate where bottlenecks might exist.
Adapting metrics to your organization
Developer productivity doesn’t look the same for every team. Platform teams, infrastructure teams, and product engineering groups often measure success differently.
SEI allows organizations to define custom metrics and measurement frameworks based on how their teams actually work. This flexibility helps engineering leaders evaluate delivery performance, workflow efficiency, or engineering investment without forcing every team into the same definition of productivity.
Understanding how engineering effort is spent
Beyond delivery speed, engineering leaders also need visibility into where engineering time goes.
SEI supports configurable profiles that help organizations analyze both delivery performance and engineering investment. Teams can examine how work is distributed across areas like feature development, maintenance, bugs, or technical debt — helping leaders understand whether engineering effort aligns with business priorities.
Turning visibility into better decisions
The goal of developer productivity measurement isn’t to monitor developers more closely. It’s to understand how the delivery system behaves.
By connecting engineering data, surfacing delivery metrics, and visualizing workflow trends, Harness SEI helps organizations move beyond guesswork and answer the kinds of questions that actually drive engineering improvement.
When teams can see where work slows down, where effort is being spent, and how delivery patterns evolve over time, they’re better equipped to remove friction and support sustainable developer productivity.
The Questions Lead to Better Answers
Developer productivity improvement starts with honest assessment of current state. The eight questions above force engineering leaders to confront uncomfortable truths about workflow inefficiencies, measurement gaps, and cultural barriers that prevent teams from performing at their potential.
The answers vary by organization, but the pattern is consistent. Teams improve when they have visibility into their delivery process, feedback loops that enable rapid iteration, and leadership that treats productivity metrics as diagnostic tools rather than performance scorecards. The technology enables visibility. The culture determines whether that visibility drives meaningful change.
Start by picking one question and answering it with data. Instrument the workflow. Track the metric. Review the trend. Use what you learn to inform the next improvement. Sustainable productivity gains compound through small, validated changes rather than large, disruptive transformations.
The goal isn't perfect measurement. It's sufficient visibility to make better decisions. You don't need to know everything about your engineering process. You need to know enough to identify the next constraint worth addressing. That's how high-performing teams stay high-performing even as they scale.
You can explore Harness SEI and review implementation details or explore the roadmap to learn how the platform continues evolving to address emerging engineering productivity challenges.

Strategic Cloud Cost Management: Evolution Guide
You receive an alert at 3 AM: your AWS bill for last month exceeded projections by 340 percent. Strategic cloud cost management wasn't on anyone's roadmap until finance demanded answers at the board meeting. Now platform engineering owns cloud spend optimization with no baseline, no tagging strategy, and three different teams provisioning infrastructure using five different methods. This scenario repeats across organizations that treated cloud costs as an operational afterthought rather than a strategic capability requiring the same rigor as security or reliability.
The shift from reactive cost monitoring to strategic governance represents a fundamental change in how engineering and finance collaborate on infrastructure decisions. Organizations that master this evolution gain predictable spending patterns, accelerate delivery velocity, and align technical decisions with business outcomes. Those that don't end up trapped in a cycle of emergency cost reviews and manual cleanup exercises that never address root causes.
The Reactive Cost Management Trap
Most platform teams begin their cloud journey with reactive approaches: monthly invoice reviews, spreadsheet-based tracking, and ad hoc optimization sprints triggered by finance escalations. This model breaks down at scale because it treats symptoms rather than causes. Engineering teams provision resources without visibility into cumulative impact. Finance teams flag overruns weeks after the spending occurred. Nobody owns the relationship between architecture decisions and their financial consequences.
The reactive model creates three operational failure modes. First, delayed visibility means optimization efforts target historical patterns that may no longer reflect current workload behavior. Second, the absence of cost accountability at the service or team level eliminates the feedback loop that drives sustainable spending discipline. Third, manual cleanup exercises address waste without preventing its recurrence, turning cost optimization into an endless cycle of fire drills rather than a continuous governance capability.
Organizations operating in reactive mode typically discover problems through monthly invoice shock rather than proactive monitoring. By the time finance raises flags, the spending has already occurred across dozens of services, multiple accounts, and various teams. Reconstruction efforts consume engineering cycles that could have prevented the overrun in the first place. The real cost isn't just the wasted cloud spend but the opportunity cost of diverting senior engineering time toward historical forensics.
Strategic Cloud Cost Management as Operational Discipline
Strategic cloud cost management treats financial accountability as a prerequisite for sustainable scale rather than a constraint on engineering autonomy. This requires real-time visibility into spending patterns, clear ownership boundaries at the service level, and automated guardrails that prevent common waste patterns before they compound. The goal isn't cost reduction for its own sake but alignment between technical architecture, delivery velocity, and business growth.
Organizations that implement strategic approaches shift accountability closer to provisioning decisions. Development teams receive cost feedback during sprint planning rather than months later. Platform teams establish governance policies that auto-scale resources based on actual utilization patterns. Finance teams gain predictive models that reflect engineering roadmaps rather than extrapolating from incomplete historical data. This shared ownership model eliminates the adversarial dynamic where engineering maximizes flexibility and finance minimizes spending without coordination.
The strategic model requires architectural patterns that support cost attribution and optimization at scale. Tagging strategies must extend beyond compliance requirements to enable meaningful cost allocation by service, team, environment, and business unit. Resource provisioning workflows must include budget validation before deployment. Monitoring systems must correlate performance metrics with spending patterns to identify efficiency opportunities. These capabilities don't emerge from one-time initiatives but from treating cost governance as a continuous operational discipline embedded in delivery workflows.
The FinOps Maturity Model and Cloud Cost Governance Framework
The FinOps maturity model provides a structured path from reactive monitoring to strategic optimization. The crawl phase establishes baseline visibility: accurate tagging, centralized reporting, and basic cost allocation. Organizations at this stage focus on understanding where money goes rather than optimizing spending patterns. The walk phase introduces accountability: team-level budgets, anomaly detection, and policy-based controls. The run phase integrates cost optimization into engineering culture: automated right-sizing, predictive modeling, and continuous improvement cycles tied to business metrics.
Most organizations stall between crawl and walk phases because they treat FinOps as a finance initiative rather than a platform capability. The transition requires engineering investment in governance frameworks, automation tooling, and cultural change management. Finance teams must learn enough about cloud architecture to ask meaningful questions about spending patterns. Engineering teams must accept that cost accountability enhances rather than constrains their ability to deliver value. Leadership must recognize that strategic cloud cost management requires dedicated platform engineering capacity, not just policy documents.
Cloud cost governance frameworks establish the boundaries within which teams operate autonomously. Policy-based controls prevent common mistakes: untagged resources, orphaned volumes, oversized instances, and unused reservations. Budget alerts create feedback loops before spending exceeds projections. Recommendation engines surface optimization opportunities based on actual utilization patterns. These guardrails enable decentralized decision-making while maintaining organizational visibility and control.
Enterprise Cloud Cost Optimization Tactics
Effective optimization starts with visibility into where spending occurs and why. Cost allocation by service, team, and environment reveals patterns that aggregate reporting obscures. A single service consuming 40 percent of infrastructure spend might represent legitimate scale or architectural inefficiency, but you can't distinguish between them without granular attribution. Tagging strategies must capture both organizational structure and technical context to enable meaningful analysis.
Right-sizing recommendations fail without workload context. An instance running at 15 percent CPU utilization might be oversized or might be handling bursty traffic that requires headroom. Automated policies that resize based purely on average utilization can create reliability issues during traffic spikes. Strategic optimization correlates utilization patterns with performance requirements to identify safe opportunities without introducing operational risk.
Reserved capacity and savings plans require predictive modeling grounded in engineering roadmaps rather than historical extrapolation. A three-year commitment based on last quarter's spending patterns becomes waste if architecture changes eliminate the underlying workload. Effective reservation strategies align commitment levels with stable baseline capacity while maintaining flexibility for variable workloads through on-demand and spot instances.
Cost anomaly detection provides early warning for spending deviations before they compound into invoice surprises. Automated alerts trigger investigation when daily spending exceeds expected patterns by threshold percentages. The key is tuning sensitivity to catch meaningful anomalies without generating alert fatigue from normal workload variance. Organizations that implement anomaly detection reduce time to detection from weeks to hours.
FinOps Best Practices and Cloud Financial Management Evolution
Sustainable FinOps practices embed cost accountability into delivery workflows rather than treating it as a separate governance exercise. Sprint planning includes budget impact assessment alongside feature requirements. Code review processes validate that infrastructure changes follow cost optimization guidelines. Deployment pipelines block resource provisioning that violates policy constraints. These practices transform cost management from a reactive cleanup exercise into a proactive design consideration.
Cross-functional collaboration between engineering, finance, and platform teams eliminates the information asymmetry that creates adversarial dynamics. Regular FinOps review meetings surface spending trends, discuss optimization opportunities, and align on priority trade-offs. Engineering teams explain architectural decisions that drive cost patterns. Finance teams provide business context that helps prioritize optimization efforts. Platform teams demonstrate how governance capabilities support both engineering velocity and financial discipline.
The evolution from reactive to strategic cloud financial management doesn't happen through big-bang transformations but through incremental capability building. Organizations start with basic visibility, add accountability mechanisms, implement automation guardrails, and gradually shift culture toward cost-conscious architecture. Each phase builds on previous capabilities while addressing the next constraint blocking maturity progression.
Harness Cloud Cost Management: Strategic Optimization at Scale
Harness Cloud & AI Cost Management implements strategic cost governance as an integrated platform capability rather than a standalone tool. The system provides real-time visibility into cloud spending across AWS, Azure, and GCP with cost allocation by service, team, environment, or business unit. This granular attribution enables accountability at the level where provisioning decisions occur rather than aggregating everything into organizational totals that obscure individual team impact.
Automated anomaly detection identifies spending deviations before they compound into monthly surprises. Budget tracking correlates actual spending against projections with alert thresholds tuned to organizational tolerance. Policy-based governance guardrails prevent common waste patterns: untagged resources, orphaned storage, oversized instances, and unutilized reservations. These controls maintain organizational standards while preserving team autonomy for legitimate architecture decisions.
The platform surfaces optimization recommendations grounded in actual utilization patterns rather than generic best practices. Right-sizing suggestions consider workload characteristics and performance requirements to avoid creating reliability issues while reducing waste. Reserved capacity planning integrates with engineering roadmaps to align commitment levels with predicted baseline capacity. The recommendations prioritize opportunities by potential impact to focus engineering effort on changes that drive meaningful savings.
Integration with broader delivery workflows embeds cost accountability into existing processes rather than requiring separate governance exercises. Cost feedback appears in planning tools, code review systems, and deployment pipelines where architecture decisions occur. Platform teams establish policy boundaries that auto-scale resources based on utilization patterns while maintaining budget controls. This integration transforms cost optimization from a monthly cleanup exercise into a continuous operational discipline.
Organizations implementing Harness CCM reduce time to cost visibility from weeks to minutes, shift accountability from centralized finance teams to distributed engineering teams, and replace manual cleanup sprints with automated governance that prevents waste before it occurs. The system supports the full FinOps maturity progression from basic visibility through strategic optimization without requiring teams to stitch together multiple point solutions.
Building Strategic Cost Management Capability
The transition from reactive monitoring to strategic governance requires sustained investment in three areas: technical capability, organizational process, and cultural change. Technical capability includes tagging infrastructure, implementing monitoring systems, and establishing automation guardrails. Process change embeds cost accountability into planning, development, and deployment workflows. Cultural change shifts engineering mindset from viewing cost governance as a constraint toward recognizing it as an enabler of sustainable scale.
Organizations that treat this transition as a finance initiative fail because engineering teams lack context for optimization decisions. Organizations that treat it as purely an engineering initiative fail because financial accountability remains disconnected from provisioning decisions. Success requires genuine collaboration where engineering teams gain visibility into business impact and finance teams develop sufficient technical literacy to ask meaningful questions about architecture trade-offs.
Strategic cloud cost management doesn't eliminate spending growth but aligns it with business value creation. Infrastructure costs should scale with customer growth, feature delivery, and revenue expansion. The goal is predictable, attributable spending where every dollar maps to a specific business outcome rather than accumulated waste from poor governance. Organizations that achieve this alignment accelerate delivery velocity because cost accountability becomes a design consideration rather than a post-deployment surprise.
The maturity progression from reactive to strategic cloud financial management represents a fundamental operational capability that differentiates organizations scaling cloud infrastructure sustainably from those trapped in cycles of emergency cost reviews and manual cleanup. Platform teams that invest in governance frameworks, automation tooling, and cross-functional collaboration eliminate the false choice between engineering velocity and financial discipline. The result is cloud infrastructure that scales efficiently with business growth while maintaining predictable spending patterns aligned with strategic objectives.
Learn more about strategic cloud cost management capabilities at Harness Cloud & AI Cost Management. Explore implementation details and governance patterns in the technical documentation. Review upcoming optimization features on the product roadmap.

Engineer Cloud Cost Awareness: Why It Fails & Fixes
Why does your platform team get blamed when engineer cloud cost awareness doesn't exist, even though they built perfectly functional infrastructure? Because someone deployed a compute-intensive job to production without checking if it would consume $40,000 of spot instances overnight. The engineer who shipped it had no visibility into cloud costs, no incentive to check, and no workflow that surfaced the impact until finance sent an escalation email three weeks later.
This isn't an engineering failure. It's a systems design failure. When cost visibility lives in a separate dashboard that developers never open, cost accountability for developers becomes impossible. Teams optimize for shipping velocity, reliability, and feature completeness because those metrics are visible, measured, and rewarded. Cloud spend remains invisible until it becomes a crisis.
Why Engineering Team Cost Visibility Fails at Scale
The root problem isn't awareness. Engineers care about operational impact when it affects their work directly. They care about latency because it shows up in monitoring. They care about error rates because on-call pages them at 3 AM. Cloud costs don't trigger any of these feedback loops. The bill arrives weeks after deployment, attributed to abstract cost centers that don't map to services or teams.
Most organizations hand engineers access to a FinOps dashboard and expect behavioral change. This approach fails because it treats cost awareness as an individual responsibility rather than a systemic property. Developers should not need to context-switch into a separate cost analysis tool to understand the impact of their architectural decisions. By the time they check, the damage is already done.
Traditional cost reporting tools create a 20 to 30-day delay between action and feedback. Engineers deploy infrastructure changes, move on to the next sprint, and only discover the cost impact during the monthly retrospective. At that point, the deployment is in production, dependencies have been built on top of it, and rolling back feels riskier than absorbing the cost. This delay decouples decision-making from consequences, which is the opposite of how platform engineering should work.
Cloud Cost Governance for Engineers Needs Guardrails, Not Guidelines
Most organizations approach developer cloud cost responsibility through documentation: cost allocation tagging standards, rightsizing recommendations, and quarterly cost reviews. These are necessary but insufficient. Documentation creates awareness but doesn't enforce accountability. Engineers will follow guidelines when they have time, which means they follow them inconsistently.
Effective engineering cloud spend optimization requires guardrails embedded into the deployment workflow. If a service exceeds its cost budget, the pipeline should surface that information before merge, not after deployment. If an environment spins up resources that violate governance policies, the provision request should be blocked, not logged for post-incident analysis.
This doesn't mean slowing down deployments with manual approval gates. It means making cost governance automated, predictive, and contextual. Engineers should know the cost implications of scaling decisions at the same moment they're making them. If a pull request changes autoscaling thresholds, the cost impact should appear in the code review, not in next month's bill.
The Incentive Misalignment Problem
Engineering team cost visibility fails when performance reviews, promotion criteria, and operational metrics ignore cost efficiency. Platform teams are measured on uptime, deployment frequency, and feature delivery. Nobody gets promoted for saving $200,000 in unnecessary compute spend. This creates a rational optimization strategy: prioritize what gets measured, ignore what doesn't.
Finance teams notice this misalignment when cloud budgets grow 40 percent year-over-year while engineering headcount stays flat. They respond by implementing cost controls, which engineers experience as friction. The typical result: shadow IT workarounds, requests for budget exceptions, and a growing adversarial relationship between engineering and finance.
The fix isn't tighter controls. It's making cost a first-class operational metric alongside latency, error rates, and throughput. If cost per transaction appears in the same dashboards engineers check during incidents, it becomes part of the operational model. If cost anomaly alerts route to the same channels as performance alerts, teams respond with the same urgency.
Building Cost-Aware Engineering Practices That Scale
FinOps culture adoption starts by treating cost visibility as infrastructure, not training. Engineers shouldn't need to learn a new cost analysis methodology to understand whether their deployment will double the monthly bill. Cost data should flow into the tools they already use: observability platforms, CI/CD pipelines, and service catalogs.
The shift from cost-oblivious to cost-aware engineering happens through three mechanisms: real-time feedback, team-level accountability, and policy automation. Real-time feedback means engineers see projected cost changes during development, not weeks after deployment. Team-level accountability means costs are allocated to services and owners, not abstract cost centers. Policy automation means governance rules are enforced by the platform, not spreadsheets.
Start with cost allocation. Every cloud resource should be tagged with the service, team, and environment that owns it. This enables accurate attribution, which is the foundation for accountability. Without it, platform teams end up playing cost detective, trying to figure out which $15,000 database instance belongs to which product team.
Next, integrate cost data into existing workflows. If engineers deploy through Terraform, cost estimates should appear in plan output. If they provision resources through an internal developer platform, cost projections should display before submission. If they query logs in Datadog or Splunk, cost per query should be surfaced alongside latency metrics.
Finally, implement budget guardrails that escalate based on severity. Minor overruns trigger notifications. Moderate overruns require acknowledgment. Critical overruns block deployments until reviewed. This creates proportional friction: small costs flow freely, large costs require deliberate decisions.
What Cost Accountability for Developers Actually Looks Like
Real cost accountability doesn't mean every developer needs to become a cloud economist. It means platform teams provide the infrastructure for cost-aware decision-making. Engineers should be able to answer: "Will this change increase our monthly cloud spend?" without leaving their IDE.
This requires cost visibility at multiple layers. At the service level, teams need dashboards showing spend trends, budget burn rate, and cost per transaction. At the environment level, they need to see whether dev and staging environments are consuming production-level resources. At the resource level, they need rightsizing recommendations that map to actual workload patterns.
The goal is to make the economically optimal choice also the path of least resistance. If oversized instances cost more and require justification, engineers will rightsize by default. If unutilized resources trigger automated cleanup workflows, teams won't accumulate zombie infrastructure. If cost-efficient architectures are templated and documented, they become the starting point for new services.
How Harness CCM Embeds Cost Awareness Into Platform Workflows
Harness Cloud & AI Cost Management treats cost visibility as a core platform capability, not a separate FinOps tool. It integrates cost data directly into delivery workflows, making engineering cloud spend optimization a natural part of the development process rather than an afterthought.
The platform provides real-time cost allocation across AWS, Azure, and GCP, breaking down spend by service, team, environment, or business unit. This eliminates the attribution problem that makes traditional cost reporting useless for engineering teams. Instead of seeing a $200,000 monthly bill with no context, teams see exactly which services, deployments, and resource types drive costs.
Budget tracking and anomaly detection run continuously, surfacing cost spikes before they compound into major overruns. When a deployment unexpectedly doubles compute costs, the alert routes to the engineering team that owns the service, not a centralized FinOps group. This creates the tight feedback loop that traditional cloud billing tools cannot provide.
Policy-based cost controls enforce governance at provision time, not during retrospectives. If a team attempts to deploy resources that violate cost policies, the request surfaces recommendations before execution. This prevents the "deploy first, optimize later" pattern that leads to permanent inefficiency.
Harness Cloud & AI Cost Management integrates with broader platform and delivery workflows, meaning cost data flows into CI/CD pipelines, observability dashboards, and service catalogs. Engineers don't need to context-switch into a separate cost tool to understand the financial impact of their decisions. Cost becomes part of the operational model, measured and optimized alongside performance and reliability.
The platform also provides optimization recommendations grounded in actual workload patterns. Rather than generic rightsizing suggestions, it analyzes utilization trends and suggests specific actions: terminate unused resources, convert on-demand instances to reserved capacity, or adjust autoscaling thresholds. These recommendations integrate into existing workflows, reducing the activation energy required to act on them.
For organizations implementing FinOps culture adoption, Harness Cloud & AI Cost Management supports the transition from reactive cost management to proactive governance. It provides the infrastructure for developer cloud cost responsibility without requiring every engineer to become a cost expert.
Learn more about Harness Cloud & AI Cost Management or explore implementation guides.
Making Cost Optimization a Sustainable Engineering Practice
The long-term solution to cloud cost accountability for developers isn't better dashboards or more training. It's making cost a first-class operational concern, measured and optimized with the same rigor as latency and error rates. This requires infrastructure that surfaces cost data in real time, allocates it to responsible teams, and enforces governance through automation rather than manual review.
Organizations that treat cost as an afterthought end up with runaway cloud bills and adversarial relationships between engineering and finance. Organizations that embed cost visibility into platform workflows build sustainable practices where optimization happens continuously, not during quarterly cost reduction sprints.
Start by instrumenting your infrastructure for accurate cost allocation. Then integrate cost data into the tools engineers already use. Finally, implement automated guardrails that enforce governance without blocking velocity. The result is a platform where cost-aware engineering becomes the default, not the exception.
If your platform team spends more time investigating cost anomalies than preventing them, it's time to rethink your approach. Engineer cloud cost awareness doesn't fail because developers don't care. It fails because the infrastructure for accountability doesn't exist yet.
.png)
A Step-by-Step Guide to Feature Flag Implementation in CI/CD Pipelines
- To ensure releases are safe, scalable, and compliant, Feature Flags should be built into CI/CD and GitOps workflows with the same level of governance, policy, and automation as code deployments.
- AI-driven automation and smart pipelines remove manual work by generating, verifying, and managing Feature Flag workflows across many services. This speeds up delivery while keeping enterprise safeguards in place.
- Strong Policy as Code, centralized visibility, and automated lifecycle management turn Feature Flags from possible governance gaps into controlled assets. This helps reduce risk and maintain compliance at an enterprise level.
Engineering teams often deploy code much faster than they can safely release new features to users. This gap can create risks if releases skip testing, approvals, or gradual rollouts. Feature flags help by separating deployment from release, so you can ship code continuously and control which features users see through configuration.
The solution isn't just adding flags to your code. The key is treating your Feature Flag implementation as part of your CI/CD system, not just application code. When flags flow through GitOps workflows with policy governance, automated verification, and rollback capabilities, teams can accelerate delivery across hundreds of services without creating bespoke pipelines. This approach transforms flags from tactical tools into enterprise-grade release orchestration components that maintain compliance while enabling developer velocity.
See how Harness Continuous Delivery & GitOps provides AI-powered automation and centralized governance to implement Feature Flags at scale across your entire deployment ecosystem.
How to Implement Feature Flags in Enterprise CI/CD Pipelines
Managing feature rollouts across more than 200 microservices without standard processes can quickly lead to pipeline sprawl in enterprise CI/CD environments. The answer is to use Feature Flags in enterprise CI/CD pipelines with the same strict governance as production code deployments. This organized approach removes the need for custom pipelines and keeps enterprise-level control.
Establish Governance and Policy as Code Foundation
Set clear categories for flags before teams start making toggles. For example, use release flags for deployment gates, operational flags for circuit breakers, and experiment flags for A/B testing. Make sure each category has defined ownership, lifecycle rules, and review steps.
Set up policies to block unauthorized changes to production flags and to enforce naming rules, including service ownership and expiration dates. This governance helps prevent technical debt from unmanaged flags and makes future operations simpler.
Instrument Services and Integrate with GitOps Workflows
Install Feature Flag SDKs in your services and make sure flag changes go through your GitOps processes, triggering the same reviews as application updates. Set up your deployment pipelines so flag updates are treated like deployment events, starting canary releases and health checks.
This setup makes sure flag changes get the right level of review without slowing down deployments. Link flag states to your observability tools, so metrics include toggle information, making it easier to troubleshoot quickly.
An enterprise platform like Harness Feature Management & Experimentation centralizes these flags and audits across services.
Automate Production Verification and Cleanup Processes
Set up automated rollback systems that watch performance metrics during flag rollouts and revert changes if problems appear. Use time-to-live policies for temporary toggles and automate their cleanup.
Plan regular audits of your flags to create removal tasks and pull requests for outdated configurations. This organized lifecycle management helps prevent configuration drift, which can slow down deployments and make debugging harder.
Security and Governance Best Practices for Feature Flags
Feature flags require robust governance to meet regulatory requirements and maintain compliance across enterprise environments. Implementing best practices for secure Feature Flag implementation in DevOps workflows becomes even more important when managing hundreds of microservices with strict audit requirements.
- Enforce role-based access controls with environment-specific permissions and mandatory approvals for production flags
- Encrypt flag configurations at rest and in transit, treating targeting rules as sensitive production data
- Implement Policy as Code governance using OPA to automatically enforce naming conventions and approval workflows across all services
- Set automatic expiration dates on temporary flags to prevent technical debt and reduce compliance exposure
- Enable complete audit trails with immutable logs that track every flag change and user action
These security steps turn Feature Flags from possible governance risks into controlled assets that make deployments safer at scale. With the right governance, you can automate flag workflows using AI-powered pipelines that keep things secure and speed up delivery across all your services.
Automating Feature Flag Workflows with AI-Driven Continuous Delivery
Context-aware AI changes how teams set up Feature Flag workflows by automatically building pipelines with canary deployments, approval gates, and verification steps. Rather than spending days making custom setups for each service, AI reviews your current templates, connectors, and policies to create ready-to-use pipelines in minutes.
This approach answers how Feature Flag implementation can be automated using AI-driven continuous delivery tools by removing manual scripting while maintaining enterprise governance through flexible templates and OPA policies.
Beyond pipeline generation, intelligent verification closes the loop between flag changes and production health by automatically connecting feature evaluations to observability data from Datadog, CloudWatch, or other monitoring systems.
When flags are switched, AI-powered checks automatically link flag changes to performance data and system logs to spot problems right away. This setup allows for quick, automated rollbacks, making Feature Flags a strong tool for protecting production without manual work.
Automated flag lifecycle management helps avoid technical debt by finding old flags and creating cleanup tasks as releases move to full rollout. AI spots flags that haven't changed for over 30 days, checks them against deployment history, and creates removal pull requests to keep your code clean.
This intelligent approach keeps flag configurations lean and compliant through Harness Continuous Delivery, reducing the operational burden of managing hundreds of feature toggles across enterprise-scale deployments while meeting audit requirements for configuration drift.
Feature Flag Implementation: FAQs for GitOps and ArgoCD
Platform engineers managing Feature Flags across hundreds of microservices and multiple ArgoCD instances face unique challenges around governance, visibility, and coordination at scale. These questions address common concerns about integrating Feature Flag management with GitOps and ArgoCD workflows at enterprise scale.
How do Feature Flag changes flow through GitOps so they're reviewed, promoted, and audited like code?
Store flag configurations as declarative YAML in dedicated config repositories, separate from application code. Changes trigger pull requests that require approval before merging. ArgoCD syncs these configs to target environments, creating an immutable audit trail. This approach follows GitOps best practices for declarative configuration management.
What's the best way to model flags across dozens of ArgoCD instances to avoid sprawl and maintain centralized visibility?
Use ApplicationSets to template flag configurations across environments and services. Create a centralized config repository with environment-specific overlays using Kustomize or Helm. Label applications consistently for filtering and grouping. This pattern, documented in OpenShift GitOps, enables unified dashboards while maintaining per-service autonomy.
How can Canary releases coordinate with flag toggles, health checks, and automated rollback without custom scripts per service?
Integrate flag state changes with deployment hooks in your ArgoCD applications. Configure health checks that monitor both deployment metrics and flag-specific KPIs. Use ArgoCD sync waves to sequence flag activation after successful canary validation. Automated rollback triggers can revert both deployment and flag states simultaneously when anomalies are detected.
Can Feature Flag changes bypass normal GitOps approval processes during incidents?
Emergency flag toggles should still flow through Git for auditability, but can use fast-track approvals for production incidents. Configure separate "hotfix" branches with relaxed approval requirements for production incidents. Emergency changes must include incident tickets and post-incident reviews. This maintains compliance while enabling rapid response during outages.
How do you prevent configuration drift when managing flags across multiple environments?
Use GitOps promotion pipelines that automatically sync flag configurations from lower to higher environments. Implement Policy as Code validation using OPA to catch configuration inconsistencies before deployment. Regular drift detection scans compare live flag states against Git sources, alerting when manual changes occur outside the GitOps workflow.
Ship Faster with Guardrails—Feature Flags + Harness CD & GitOps
Feature flags work well at enterprise scale when you manage them through your CI/CD pipelines with the same governance as code deployments. By integrating flags with GitOps workflows, policies, and automated checks, you avoid building custom pipelines for hundreds of services.
To make this work at scale, set up standard processes that automatically apply flag governance. Use centralized templates and Policy as Code enforcement as best practices. AI-powered checks can spot performance issues and trigger rollbacks without manual effort.
Want to speed up safe releases while keeping enterprise governance? Harness Continuous Delivery & GitOps brings together Feature Flags and AI-driven continuous delivery to cut down on deployment work and lower risk throughout your software delivery process.
_.png)
What Is Web App and API Protection (WAAP)?
- Traditional web application firewalls (WAF) are no longer sufficient for protecting modern, API-first applications. WAAP provides unified, comprehensive runtime security for applications & APIs.
- A WAAP platform should automate policy creation, reduce alert fatigue, and integrate seamlessly into CI/CD pipelines, eliminating ticket-ops bottlenecks and reducing developer and security toil.
- Best practices such as continuous API discovery, API testing, and application-layer threat detection & response enable platform teams to operationalize security at scale without sacrificing delivery speed or developer autonomy.
When APIs now handle the majority of web traffic, protecting only HTML requests creates a blind spot that puts your organization at risk. Traditional WAFs weren't built for this reality and miss API-specific vulnerabilities that define modern attack vectors. Your security platform needs complete visibility into every API endpoint, authentication flow, and data exchange.
A web application and API protection (WAAP) platform should unify API discovery, API testing, API protection, bot & abuse protection, and cloud-scale WAF capabilities into a single platform. Instead of bolting security on after deployment, WAAP should provide standard runtime security control that’s also integrated into your software delivery lifecycle. Harness Web Application & API Protection delivers this unified approach without reintroducing the ticket-ops bottlenecks that slow your teams down.
What Is WAAP?
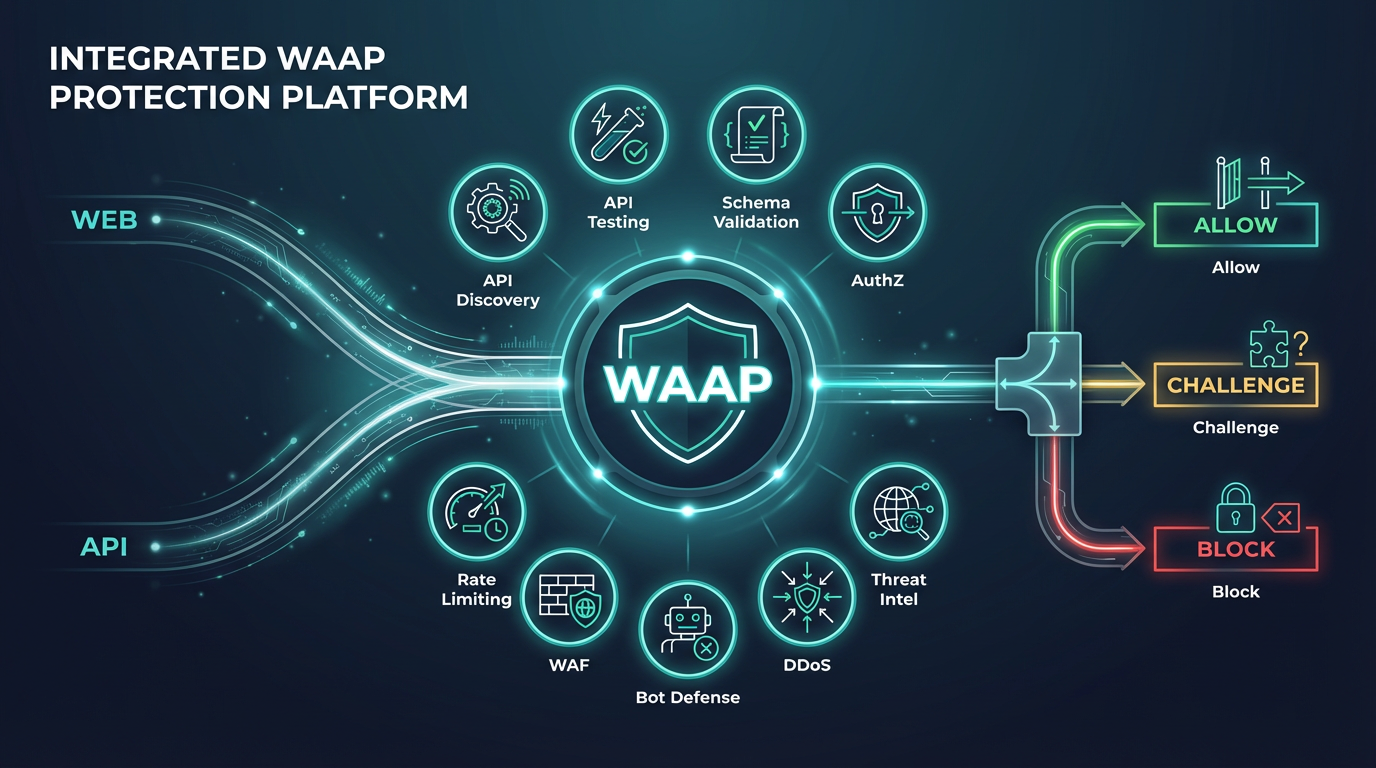
Web Application and API Protection (WAAP) is a modern cybersecurity approach designed to protect web applications and APIs from a wide range of threats.
Instead of relying on a single layer of defense like a network firewall, WAAP combines multiple security technologies into a unified solution to safeguard modern cloud- and AI-native designs.
At its core, WAAP protects against:
- Application-layer attacks (like SQL injection and cross-site scripting)
- API-specific exploitation and data exposures
- Bots, abuse, and automated threats
- Distributed Denial-of-Service (DDoS) attacks
In simple terms:
WAAP ensures that the apps and APIs powering your business stay secure, available, and trustworthy.
Why WAAP Matters More Than Ever
The need for WAAP isn’t just theoretical. It’s driven by real shifts in how applications are built and operated today.
1. The Explosion of APIs
APIs are now the backbone of digital ecosystems. They allow different systems to communicate, power mobile apps, and enable integrations between platforms.
However, APIs are often:
- Poorly documented
- Exposed to the public internet
- Lacking strong authentication
This makes them a prime target for attackers.
2. Cloud and Microservices Architecture
Modern applications are no longer monolithic. They’re built using microservices distributed across cloud environments.
While this improves scalability and flexibility, it also:
- Increases the number of endpoints
- Makes security visibility more difficult
- Expands the attack surface significantly
3. Sophisticated Cyber Threats
Attackers today use automation, AI, and large-scale bot networks to exploit vulnerabilities faster than ever.
They’re not just targeting infrastructure. They’re targeting:
- Login forms
- Payment systems
- Data flows
- User sessions
4. Limitations of Traditional Security
Older security tools, such as network firewalls and basic WAFs, were designed for simpler environments. They often:
- Rely on static rules and attack signatures
- Lack context about user behavior
- Struggle to detect modern attack patterns
WAAP fills this gap by offering adaptive, intelligent, and application-aware protection.
The Core Components of WAAP
WAAP isn’t a single tool. It’s a collection of advanced security capabilities working together. Let’s explore each one in more detail.
1. Web Application Firewall (WAF)
A Web Application Firewall (WAF) is one of the foundational layers of WAAP.
It inspects incoming HTTP and HTTPS traffic and filters out malicious requests before they reach your application. But modern WAAP goes far beyond simple rule matching.
They now incorporate:
- Behavioral analysis
- Machine learning-powered detections
- Context-aware filtering
This allows them to detect not only known threats but also suspicious patterns that may indicate new or evolving attacks.
For example, if a user suddenly submits hundreds of unusual requests in a short time, a modern WAAP can flag and block that behavior, even if it doesn’t match a known attack signature.
2. API Security
APIs are one of the most critical and vulnerable parts of modern systems.
WAAP provides dedicated API security that goes beyond traditional protections by focusing on how APIs operate.
Key capabilities include:
- API Discovery
Identifies all APIs in your environment, including undocumented or “shadow” APIs that developers may have deployed without formal tracking as well as “zombie” APIs” that were abandoned. - API Schema Validation
Ensures that incoming requests follow the expected structure, preventing attackers from sending malformed or malicious data. - Authentication and Authorization Enforcement
Verifies that only authorized users and systems can access specific API endpoints. - API Attack Prevention
Prevents requests that exploit API functionality or extract sensitive data, including risks defined in the OWASP API Security Top 10.
This WAAP layer is crucial to application security because many breaches today occur as a result of poorly secured APIs.
3. Bot & Abuse Protection
Bots and automation account for a significant portion of internet traffic, and not all of them are friendly.
WAAP includes advanced bot & abuse protectionthat can distinguish between:
- Acceptable bot behavior (search engines, monitoring tools)
- Undesirable bot behavior (scrapers, account-targeting, transaction fraud)
Instead of blocking all automated traffic, WAAP uses techniques like:
- Behavioral analysis
- Device fingerprinting
- Interaction patterns
This allows it to:
- Block malicious bot behavior
- Challenge suspicious activity (e.g., insert CAPTCHA dynamically into an application flow)
- Allow legitimate automation
4. DDoS Protection
Distributed Denial-of-Service (DDoS) attacks aim to flood your system with traffic until it crashes or becomes unavailable.
WAAP provides robust DDoS protection by:
- Detecting abnormal traffic spikes
- Filtering malicious requests
- Distributing traffic across infrastructure
- Automatically scaling defenses
This ensures that your application remains accessible, even under heavy attack conditions.
5. Application Threat Intelligence and Analytics
One of WAAP’s most powerful features is its ability to provide deep visibility into application threats.
Instead of simply blocking attacks, WAAP helps you understand:
- Where attacks are coming from
- What methods are being used
- Which API endpoints are being targeted
- How frequently attacks occur
This data enables teams to:
- Improve application runtime security
- Identify complex attack chains
- Respond faster to security incidents
How WAAP Works in Practice
Let’s walk through a simplified example of how WAAP operates behind the scenes.
- A user (or bot) sends a request to your application
- WAAP intercepts the request before it reaches your servers
- The request is analyzed using multiple layers:
- Signature-based detection
- Behavioral analysis
- Machine learning models
- WAAP assigns a risk score to the request
- Based on that score:
- Safe requests are allowed
- Suspicious requests are challenged
- Malicious requests are blocked
All of this happens in real time, often within milliseconds, ensuring both security and performance.
WAAP vs. Traditional Security Tools
Understanding the difference between WAAP and older tools helps clarify its value.
Traditional Security Tools
- Focus on protecting networks rather than applications
- Use static, rule-based detection
- Provide limited visibility into API traffic
- Struggle with modern cloud environments and AI systems
WAAP
- Focuses on application-layer security
- Protects applications, APIs, and AI
- Uses adaptive, intelligent detection methods
- Designed for distributed cloud- and AI-native systems
In essence:
WAAP is built for modern application architectures, while other security tools were built for traditional infrastructure.
Common Threats WAAP Protects Against
WAAP is designed to defend against a wide range of modern threats, including:
- Injection Attacks - Attackers insert malicious code into inputs to manipulate databases or systems.
- Cross-Site Scripting (XSS) - Malicious scripts are injected into web pages to steal user data or hijack sessions.
- API Exploitation - Attackers misuse APIs to extract sensitive data or bypass security controls.
- Credential Stuffing & Account Takeovers (ATO) - Automated bots use stolen credentials or target account logins to compromise identities and gain unauthorized access.
- DDoS Attacks - Flooding systems with traffic to disrupt availability.
- Zero-Day Attacks - Previously unknown vulnerabilities that haven’t yet been patched.
WAAP’s behavioral and AI-driven detection helps identify these even before signatures exist.
Benefits of Implementing WAAP
Adopting WAAP provides several key advantages:
- Comprehensive Protection - A unified solution that covers multiple attack vectors.
- Enhanced Visibility - Clear insights into traffic, usage patterns, and threats.
- Reduced Complexity - Eliminates the need for multiple disconnected tools and point solutions.
- Improved User Experience - Minimizes false positives, ensuring legitimate users aren’t blocked and availability is maintained.
- Scalability - Designed to grow with your applications and handle global traffic.
Who Needs WAAP?
WAAP is essential for any organization that relies on web applications or APIs, especially:
- SaaS companies
- E-commerce platforms
- Financial institutions
- Healthcare providers
- Enterprises with digital services
If your business operates online, WAAP is no longer optional and is a critical defense layer.
Best Practices for Implementing WAAP
Platform teams can't protect what they can't see, and the scale of the problem is often shocking. Most organizations discover they have three times as many APIs as they thought once they enable continuous discovery.
These enterprise API protection best practices turn visibility gaps and manual processes into automated guardrails that scale with your delivery velocity.
- Inventory everything first - Deploy continuous API discovery across all clusters and regions to eliminate shadow endpoints.
- Map sensitive data flows early - Identify which APIs handle PII, authentication, and critical business functionality before attackers do.
- Fail builds on high-severity issues: Integrate API testing into CI pipelines with contextual remediation guidance for developers.
- Enforce policies as code - Embed org-wide security rules in templates and gateway configurations, not manual reviews.
- Start with controlled rollouts - Operationalize protection for 7-10 critical services first to prove low friction before expanding.
Smart platform teams treat API protection like any other infrastructure component. Start small, automate the repetitive work, and let unified WAAP capabilities handle the scale while developers focus on shipping features.
Operationalize WAAP With Harness
Platform teams can't afford to treat API security as an afterthought when most incidents start with compromised endpoints. Harness Web Application & API Protection transforms security from a bottleneck into an automated control that fits your delivery pipelines. AI-powered detection cuts through alert noise while continuous API discovery eliminates shadow endpoints across your entire infrastructure.
The right WAAP solution integrates with your existing CI/CD workflows without creating new ticket-ops friction. Teams get runtime protection that adapts to application changes and shift-left testing that catches vulnerabilities before production.
Ready to gain full API visibility and protect applications at the speed of modern delivery? Try Harness Web Application & API Protection and see how unified API discovery, API testing, API protection, bot & abuse protection, and WAF can eliminate security toil for your application security program.
WAAP In Practice: CI/CD Integration And Governance FAQ
Platform teams need concrete answers about WAAP integration that avoid new approval workflows and maintain engineering’s ability to deliver quickly. These WAAP FAQ responses address deployment scenarios andstrengthening security posture.
How does WAAP integrate with CI/CD without slowing builds?
WAAP runs API testing as part of your existing pipeline stages, not as a separate gate, to detect issues such as those defined in the OWASP API Security Top 10. Tests run against live traffic patterns and API schemas. Builds fail only on high-severity issues like broken authentication or data exposure, following NIST guidance for automated security enforcement without review delays.
What reduces false positives compared to traditional WAF solutions?
WAAP correlates full user journeys and API call chains (the sequence of service-to-service requests) to understand user intent rather than inspecting isolated requests. Machine learning models tune to your actual application configurations and data flows, not generic signature databases. This contextual approach reduces alert noise significantly compared to rule-based WAFs and catches threats that bypass traditional detection methods.
Which deployment options work for hybrid multi-cloud environments?
Any WAAP should support agentless edge routing, in-line integration with API gateways and load balancers, and out-of-band collection via traffic mirroring or eBPF. Teams should be able to combine deployment methods for different services to support their given application architecture. Kubernetes and container environments may also require native ingress controller and sidecar support for east-west microservices traffic protection. Harness WAAP provides 30+ integrations to support modern designs.
How do you enforce governance without creating ticket-ops?
Policy-as-code templates can be used to embed WAAP deployment directly into service deployment pipelines. Teams inherit org-wide protections automatically when using approved templates, providingguardrails that scale without approval bottlenecks.
What operational overhead should platform teams expect?
AI-assisted policy generation eliminates the need for signature writing and weekly change windows. Runtime protection automatically adapts to application changes. Platform teams generally see a 60-70% reduction in security-related tickets compared to traditional WAF management. Most operational tasks shift to self-service developer workflows.
How do you measure WAAP ROI and security improvements?
WAAP provides metrics on API discovery coverage, vulnerability remediation time, and blocked attacks. Platform teams track developer velocity through build time impact and ticket reduction. Security posture improves through measurable reductions in exposed APIs, faster incident response, and more efficient compliance audits.

Staying in Control: Auditing and Reporting with Harness Artifact Registry
At some point, every engineering team gets asked a version of the same uncomfortable question: "Where exactly are we using this package?"
Maybe it comes after a CVE drops. Maybe it's a compliance audit. Maybe it's just a principal engineer trying to clean up years of accumulated technical debt. Whatever the trigger, the answer is almost always the same: a lot of shoulder shrugging, Slack messages to people who might know, and a mad scramble through repos.
This is what happens when artifact management has no well-defined governance. Packages get pulled, images get built, dependencies pile up, and nobody has a real record of any of it.
Harness Artifact Registry is built with this problem front and centre. Alongside storing and distributing your artifacts, it gives your organization genuine visibility into what's happening with them, through audit trails and compliance-ready reporting.
Let's walk through what that actually looks like.
Every Action, Recorded
The foundation of auditing in Harness Artifact Registry is simple: nothing happens silently.
Every push, pull, deletion, policy evaluation, and quarantine action is logged, along with who or what triggered it and when. That applies to human users, automated pipelines, and service accounts alike. If something touched an artifact, there's a record of it.
Because Harness Artifact Registry is natively integrated into the Harness platform, these logs don't exist in isolation. When a pipeline pulls an image during a deployment, the audit trail connects that download to the specific pipeline run, the environment it deployed to, and the user or trigger that kicked it off. You're not just seeing that something was downloaded. You're seeing the full context around why.
Try it yourself: If you have Harness Artifact Registry set up, you can check the audit trail for your account right now. Navigate to Account Settings > Audit Trail, and filter by module:
Module: Artifact Registry
Resource Type: ARTIFACT_REGISTRY
You'll see every registry-level event with the actor, timestamp, and action. For pipeline-linked events, click through to see the full execution context.
You can also query audit events programmatically via the Harness API:
curl -X POST 'https://app.harness.io/v1/audit-events' \
  -H 'x-api-key: YOUR_API_KEY' \
  -H 'Harness-Account: YOUR_ACCOUNT_ID' \
  -H 'Content-Type: application/json' \
  -d '{
    "filterType": "AuditEvent",
    "modules": ["CORE"],
    "resourceTypes": ["ARTIFACT_REGISTRY"],
    "startTime": 1714003200000,
    "endTime": 1714089600000
  }'
This matters enormously during incident response. If a vulnerability surfaces in a package, you don't need to start guessing or digging through repos manually. You pull up the artifact, check its audit history, and you have a clear map of every pipeline and service that has consumed it. What might otherwise take days to piece together becomes a focused, time-bounded task.
Compliance Without the Scramble
For teams operating in regulated environments, audit trails aren't just useful, they're mandatory.
Harness Artifact Registry is built to support compliance with SOC 2, HIPAA, PCI-DSS, and other regulations out of the box. The audit trail covers the full artifact lifecycle, so when an auditor asks for evidence of access controls, artifact provenance, or quarantine procedures, you're not building that record from scratch. It's already there
Access to artifacts is governed through Harness's role-based access control (RBAC). Harness Artifact Registry supports three pre-built roles, Viewer, Contributor, and Admin, allowing you to define who has permission to push, pull, or manage artifacts at the registry level. Every access event is logged against those permissions, giving you a traceable, defensible record of who was allowed to do what and what they actually did.
What the RBAC roles look like in practice:
These roles can be assigned to individual users, user groups, or service accounts. To check your current role assignments via the Harness CLI:
# List all role assignments for a specific registry project
harness role-assignment list \
  --account-id YOUR_ACCOUNT_ID \
  --org-id YOUR_ORG \
  --project-id YOUR_PROJECT
When Security Meets Auditability
One of the more distinctive things about Harness Artifact Registry is how tightly it integrates with the platform's security modules. Artifact Registry doesn't try to be a scanner or a policy engine on its own. Instead, it plugs directly into Harness Security Testing Orchestration (STO) for vulnerability scanning and Harness Supply Chain Security (SCS) for SBOM generation, policy enforcement, and compliance checks. The result is that security findings flow straight into the artifact record rather than living in a separate tool.
Through integration with Harness Security Testing Orchestration (STO) and Harness Supply Chain Security (SCS), every container image that lands in the registry can be automatically evaluated for vulnerabilities and compliance. If an image fails a security or policy check, can be quarantined automatically, before it can be consumed by any downstream pipeline.
Critically, all of that is auditable. Every quarantine action, every policy evaluation outcome, and every SBOM generated through SCS is logged, timestamped, and tied to the artifact in question. So your audit trail doesn't just tell you who accessed what; it tells you what the security posture of every artifact was at the time it was accessed.
Seeing it in action: On any artifact's detail page, you'll find dedicated tabs for security and supply chain data:
- SBOM tab - Full bill of materials including dependency lists, software suppliers, and package managers (requires the SCS module)
- Vulnerabilities tab - Security test results from STO scans (requires the STO module)
- Deployments tab - Which environments this artifact has been deployed to and how many instances are running (requires the CD module)
For example, to check the supply chain posture of a specific artifact version using the Harness API, you can query its chain of custody:
# Step 1: List artifact sources registered in SCS
curl -X GET 'https://app.harness.io/v1/orgs/{org}/projects/{project}/scs/artifact-sources' \
  -H 'x-api-key: YOUR_API_KEY' \
  -H 'Harness-Account: YOUR_ACCOUNT_ID'

# Step 2: Get the chain of custody for a specific artifact
curl -X GET 'https://app.harness.io/v1/orgs/{org}/projects/{project}/scs/artifacts/{artifact_id}/chain-of-custody' \
  -H 'x-api-key: YOUR_API_KEY' \
  -H 'Harness-Account: YOUR_ACCOUNT_ID'
The chain of custody shows every orchestration event (SBOM generation, policy enforcement, signing) that has occurred for that artifact, giving you a full security timeline.
Understanding Usage: What's Available Now
Beyond the transactional audit log, Harness Artifact Registry gives you practical tools to understand and manage how your artifacts are actually being used.
The Deployments tab on any artifact shows which environments it has been deployed to and how many instances are running, so you can answer "where is this version live?" without leaving the registry. Cleanup policies let you automatically remove artifacts based on age, usage, tags, or custom rules, keeping your registry lean without manual housekeeping.
You can also attach custom metadata to artifact versions, such as build IDs, Git commit SHAs, approval status, and environment tags. This makes it possible to query and reason about your artifacts in ways that reflect your actual workflow, rather than just generic registry metadata.
Custom metadata in practice: You can tag artifact versions with whatever context matters to your team. For example, after a build pipeline runs:
# Example: Harness pipeline step to push with metadata
- step:
    type: BuildAndPushDockerRegistry
    name: Build and Push
    spec:
      connectorRef: my_ar_connector
      repo: my-registry/my-app
      tags:
        - <+pipeline.sequenceId>
      labels:
        build-id: <+pipeline.executionId>
        git-commit: <+codebase.commitSha>
        branch: <+codebase.branch>
        approved-by: <+pipeline.triggeredBy.email>
Once metadata is attached, you can filter and search artifacts by these fields in the UI, making questions like "which version was approved for production?" answerable without digging through pipeline logs.
The Bigger Picture
What's worth stepping back to appreciate is that auditing and reporting in Harness Artifact Registry isn't a separate module or a dashboard you check once a quarter. It's woven into how the registry works. Every interaction generates a record, every security evaluation produces an insight, and all of it is accessible within the same Harness platform your pipelines already run on.
For teams that are new to centralised artifact management, this is one of the most immediately valuable things you gain. Not just control over your artifacts, but actual visibility into them.
And when the next CVE drops, that visibility is going to matter.
New to Harness Artifact Registry? Check out the quickstart guide to get up and running.

DevOps Technologies in 2026: What's Changed and What Actually Matters
What are DevOps technologies?
DevOps technologies are the infrastructure that enables teams to ship code frequently, safely, and reliably. They automate repetitive work, provide visibility into system behavior, enforce governance, and give teams the confidence to deploy multiple times per day without breaking production. The best DevOps technologies aren't the fanciest, they're the ones that actually reduce toil and risk.
How has the DevOps tool stack and technology landscape changed?
2015: Point tools dominated. Teams picked a specialised tool for each stage: Jenkins for CI, Ansible for infrastructure, Splunk for logs, PagerDuty for incidents. Each tool had its own interface, permissions model, and failure modes. Teams owned 8 to 12 tools, context-switching was constant, and integration was manual.
2020: Consolidation began. Cloud-native tools emerged (Kubernetes, GitHub Actions, ArgoCD). Teams started asking: can we reduce tools instead of adding more? The problem: consolidation is hard, tools do not integrate cleanly, and switching costs are high.
2026: Platforms emerge. The trend accelerates. Teams adopt unified platforms that handle CI, CD, infrastructure, security, and observability in one place. The shift is economic: fragmentation costs more in toil and governance gaps than a unified platform costs in licensing.
The core shift: DevOps technologies used to be evaluated individually. Now they are evaluated as ecosystems, and the devops tool stack you build is as important as any individual tool in it.
How AI is reshaping DevOps technologies and the delivery lifecycle
AI coding assistants are changing the math. According to Harness research, 63% of organizations use AI tools like Copilot or Claude to write code. Code arrives faster, but it is also different: AI-generated code has different patterns, edge cases, and failure modes than handwritten code.
72% of organizations have experienced at least one production incident from AI-generated code. That is the AI Velocity Paradox. DevOps technologies must evolve to keep up. The testing, security scanning, and deployment gates that worked for handwritten code may not work for machine-generated code at scale.
DevOps technologies in the AI era need to focus on automated governance, fast rollback, and continuous observability. You cannot safely ship AI code without automated testing that catches AI-specific failure modes, security scanning that covers generated code patterns, deployment gates fast enough to match code volume, and rollback strategies that revert instantly.
What are the most important DevOps technologies and devops engineer tools to invest in?
Not all DevOps technologies are equally important. The devops practices and tools that earn a place in your stack cluster around three pillars.
- Continuous Integration and Delivery (CI/CD). This is where code gets tested and deployed. Invest in platforms that can scale with AI-generated code volume.
- Infrastructure as Code Management. Define infrastructure in code so it is version-controlled, auditable, and repeatable.
- Observability and AI SRE. You cannot manage what you cannot see. Real-time visibility into application performance, errors, and user impact is critical as code volume increases.
- Security testing. Embed scanning into the pipeline rather than bolting it on after. DevOps engineer tools that enforce policy-as-code at every stage prevent the governance gaps that incident postmortems trace back to.
DevOps best practices: evaluating devops practices and tools for your stack
Choosing well is itself one of the core DevOps best practices: the strongest stacks are built on a few deliberate decisions, not an ever-growing pile of tools. When evaluating DevOps technologies, ask five questions.
- Does it reduce toil? Can it automate the repetitive work that is consuming engineering time? If not, it is not worth the cost.
- Does it integrate with your existing stack? Can it work alongside the tools you already use, or does it require ripping out and replacing everything?
- Can it scale? Can it handle 10x more deployments, services, or teams without requiring a complete overhaul?
- Does it enforce governance? Can you apply policy-as-code, audit access, and maintain control across teams without manual coordination?
- What is the total cost of ownership? Factor in licensing, integration, training, and the fragmentation cost of choosing point tools.
How Harness approaches the DevOps technology strategy
The challenge
DevOps technology sprawl is real. Teams run 8 to 10 AI tools plus another 20 or more for the delivery pipeline. Each tool has its own logs, permissions, and failure modes. That fragmentation slows everything down: context-switching drains productivity, governance gaps create risk, and incident response is painful because no single tool has the full picture.
The approach
Harness consolidates the delivery platform with unified products: Continuous Integration, Continuous Delivery and GitOps, Infrastructure as Code Management, the Internal Developer Portal, Application Security Testing, AI SRE, and AI-native delivery. The unifying mechanism is the Software Delivery Knowledge Graph: an intelligence layer that connects code, commits, deployments, and outcomes into one source of truth.
The outcome
Teams consolidate their DevOps technology stack, reduce tool sprawl, lower governance risk, and operate at scale. The average team reclaims 10–15 hours per week previously lost to context-switching and integration work.
How have teams modernized their DevOps tool stack?
The shift from fragmented tools to a unified platform shows up in delivery metrics, not just in tooling inventories.
How did Vivun achieve a 300% improvement in DevOps engineer efficiency?
A SaaS company struggled with fragmented DevOps technologies. Each product feature required manual coordination across CI, CD, and infrastructure tools; engineers spent more time integrating than delivering. Consolidating onto Harness transformed the devops practices and tools the team used daily.
“Harness has been the catalyst for faster delivery and more DevOps engineers shipping higher-quality products every day.”
Jon Call, Engineering Manager for SRE, Vivun
Source: Vivun scales DevOps with Harness
How did Citi cut deployment lead time from days to 7 minutes?
A global financial services company with 20,000 or more engineers needed DevOps technologies that could scale and govern delivery across a heavily regulated environment. Their legacy approach was slow and fragile. Moving onto Harness CD reduced deployment lead time from days to minutes.
“Harness CD let us release each change within minutes of a pull request being merged.”
Stefanos Piperoglou, Technical Program Manager, Citi
Source: Citi improves software delivery performance with Harness CD
Different industries, same pattern: when DevOps technologies consolidate onto one governed platform, delivery gets faster and governance gets tighter at the same time.
Invest in the ecosystem, not just the tool
DevOps technologies in 2026 are not evaluated in isolation. The question is whether they reduce toil, integrate cleanly, scale without re-engineering, and enforce governance automatically. That is a different question from whether a tool is powerful. Many powerful tools fail this test because they add integration seams faster than they remove them.
The teams pulling ahead are not using the most tools. They are using the fewest well-integrated ones, built on shared governance, shared data, and shared audit trails. See how Harness brings the full after-code lifecycle onto one AI-native platform.
FAQs about DevOps technologies
Should teams build their own DevOps technology stack or buy a unified platform?
Building offers flexibility but requires ongoing maintenance, integration work, and engineering time. Buying a platform trades some flexibility for speed and governance. Most teams find that buying and customizing is faster and cheaper than building from scratch, particularly for the after-code delivery stages where the integration complexity is highest.
How do you migrate from current DevOps technologies to a new platform?
Migration is a process, not an event. Start with one team or one pipeline. Run it in parallel with existing tools for 2 to 4 weeks to validate. Once confident, gradually move other teams and pipelines over. A big-bang cutover creates risk; incremental migration lets you prove value and build confidence at each step.
What DevOps technologies does every engineering team actually need?
At minimum: CI (to build and test), CD (to deploy), infrastructure automation (to manage environments), and observability (to see what is happening). Everything else is additive. Start with these four and add based on actual pain, not theoretical coverage.
How do DevOps technologies relate to platform engineering?
DevOps technologies are the tools. Platform engineering is the discipline of using those tools to build internal platforms (golden paths, self-service workflows, software catalogs) that make developers more productive. They are complementary: platform engineering determines how the technologies are packaged and delivered to developers.
How often should teams reevaluate their DevOps technology choices?
Annually. Check whether tools are still reducing toil, whether the landscape has shifted, and whether new options would lower risk or cost. You do not need to rip and replace on every review; you need to stay aware of where your integration seams are creating the most friction.
What is the difference between DevOps best practices and DevOps technologies?
DevOps best practices are the principles (automate everything you can, measure what matters, ship small and often). DevOps technologies are the tools that put those principles into practice. Best practices without the right technologies rely on human consistency. Technologies without the right practices create automation of the wrong things.
.jpg)
Feature Flag Security in your CI/CD Pipeline
Ensuring Security in Feature Flagging and Experimentation
With the success of feature flags and experimentation widely touted by influential companies (like AirBnb and Netflix), it would seem that the benefits of nurturing an experimentation culture are a no-brainer. Surely any downsides would be far outweighed by the great insights gained into user behavior, the measurable metrics observed, and the precise monitoring together with exquisite fine tuning and orchestration of feature releases. The whole concept brims with safety.
Why wouldn’t it?
Because, among other principles, software security centers on knowing your technology (what it does and the relevant security requirements) and reducing your attack surface. The Harness platform was built with security by design from the get-go, and there are many interesting articles you can look up like this one about security in the Harness CI/CD pipeline.
For this post, we will hone in on Harness Feature Management and Experimentation (FME), specifically on two vital keys for managing your flags securely:
- FME Thin and standard client-side SDKs: the choice between local and remote feature flag target evaluation
- The Harness FME flag management pipeline steps, including the Feature Flag Cleanup AI agent
These are newly released security features that the Harness FME team is proud to celebrate. This blog explains what these mean for you. Let’s dive in.
Local and Remote Flag Evaluation
Protecting the privacy of your users means knowing where private data resides, and reducing its movement between software components.
Most security models are satisfied when private data stays and stops at the mobile or web client. Any sensitive user attributes (like PII, business context, or session data) never leave the user device. This scenario describes the concept of local feature flag target evaluation, the security premise all client-side standard FME SDKs are built on.
It may be your case, however, that feature flag targeting rules themselves are sensitive. You may rightly not trust the client with them (here’s an elaborative story that illustrates this point and another compelling story about the impossibility of securing the client). If that is your scenario, you can choose remote feature flag target evaluation. User attributes travel over the network to the Remote Evaluator in FME cloud and feature flag treatments are returned. Remote evaluation is invoked by all client-side thin FME SDKs. The flag definitions and targeting rules never leave the FME servers.
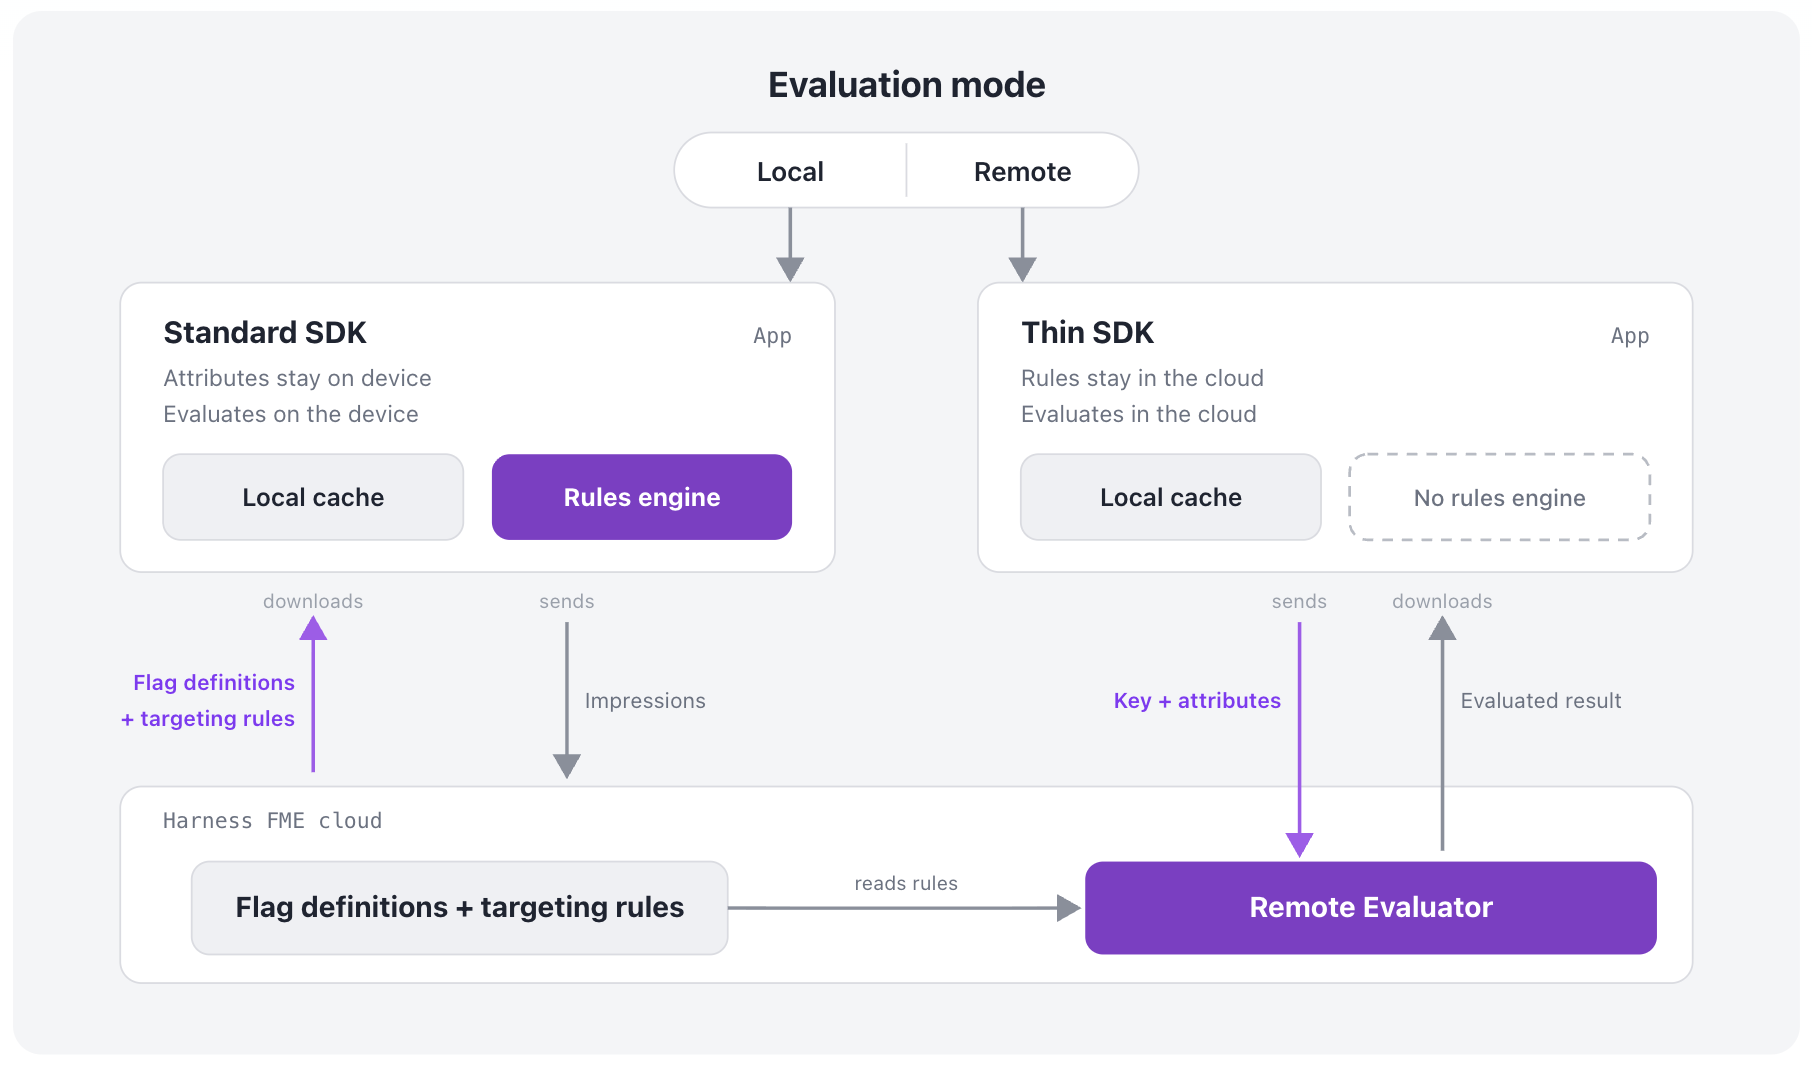
Takeaway: While most client-side surfaces are well served by local evaluation, which protects user attributes, remote evaluation is the right tool when those targeting rules themselves carry information that has to stay private. A common pattern is to keep most of the application on the standard SDK and reserve the thin SDK for the surfaces where rule visibility is sensitive. This detailed technical analysis can help you decide on your own strategy.
Local or remote evaluation—now you have the choice. It’s our pleasure to be giving you the key.
Feature Flag Lifecycle and the Cleanup AI Agent
Flags let you catch disasters before they happen. In the early stages of a canary release, triage for a faulty feature variant is as trivial as opening an alert and flicking a kill switch.
With this perception of safety and visibility, it might seem like a convenience to reuse old flags, but that would be a major malpractice (read: very very Bad, with a capital B).
There are many reasons why informed people strongly discourage flag reuse. Besides confusing flag purpose, undermining intra- and inter-team communication (getting colleagues and management mad), and deliberately ignoring the very common reality of long-delayed application updates/old code still active (especially on mobile devices, but also on a server as in this $460 million mistake); flags not removed in a timely manner, once the golden feature variant has been measured and identified, leave over unnecessary code complexity. When everyone has forgotten the unneeded variant paths (instead of removing them), we are left with encumbering tech debt.
Better to keep code simple, and follow good flag lifecycle practices that Harness FME fully supports by providing:
- OPA policies for feature flags
- Feature flag pipeline steps
- Feature Flag Cleanup AI agent
OPA Policies for Feature Flags
OPA policies allow you to enforce standardized naming practices for your feature flags project-, organization-, or account-wide in Harness. Keep the intent of each flag crystal clear to all engineers and stakeholders.
Feature Flag Pipeline Steps
Pipelines, built from standardized pipeline templates, can manage the entire flag lifecycle by using automated Harness pipeline steps for feature flag management. These take a feature flag through smoke and beta testing, canary release, monitored ramping, full GA, removal from code, archival, and deletion. More on removal from code, the feature flag cleanup step, in the next subsection.
Feature Flag Cleanup AI Agent
Harness worker agents are now available in Harness Marketplace and ready to be configured with an AI model of your choice. The Feature Flag Cleanup AI agent runs in a pipeline step that safely removes references to a stale feature flag, keeps the chosen treatment, and commits the cleanup to a given branch in the code repo.
Add the agent step to your pipeline, and the agent will search through your code for feature flag evaluations and conditional execution paths and create a commit to remove these from your code base, leaving just your chosen variant path. You can see in FME when a flag has not received traffic in the past week or month, signaling that the flag can safely be killed, archived, and deleted in Harness FME.
How to add the Feature Flag Cleanup AI Agent step to your pipeline:
- Create or open a pipeline in Harness.
- Create or click on a supported stage type (or a containerized step group) for Agent steps.
- Add the Feature Flag Cleanup agent step to the step group.
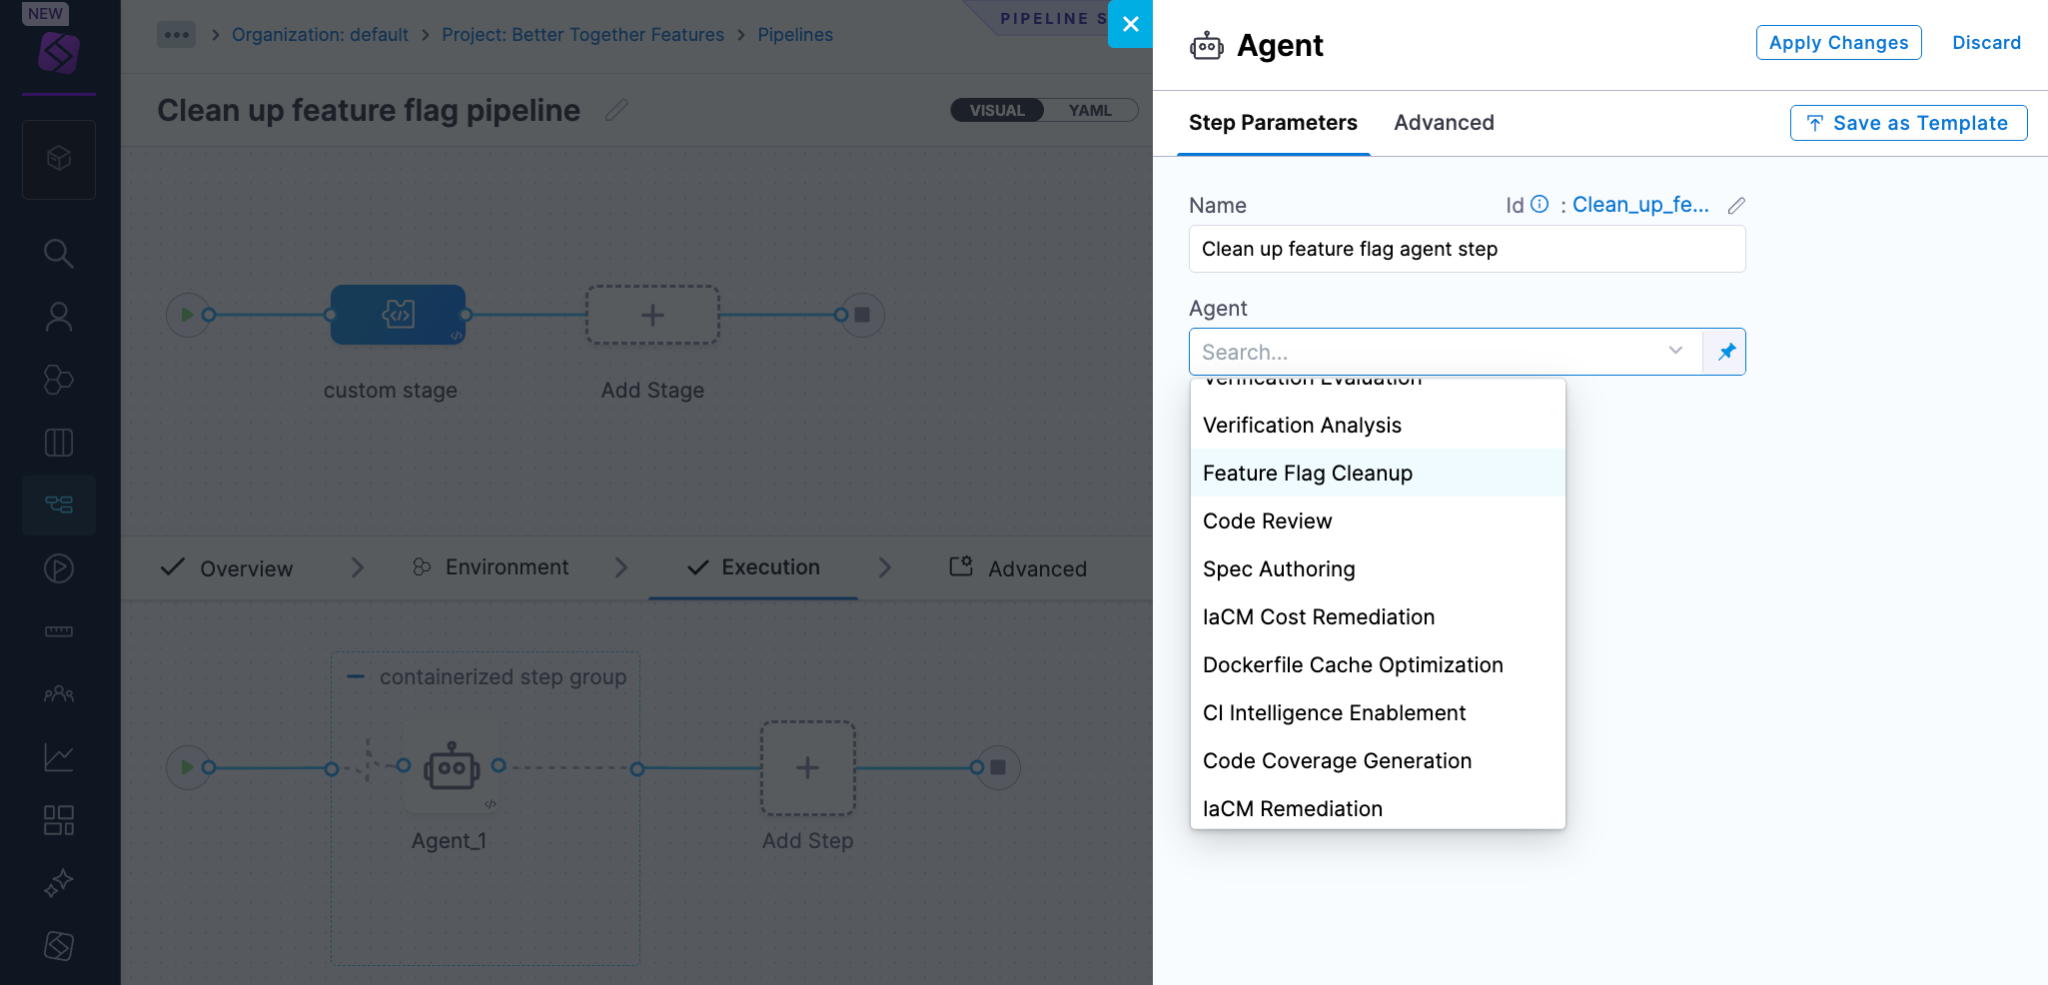
- Configure the LLM Connector, AI model, flag name and code repository parameters.
After the step runs successfully, your team can review the changes and merge the branch. Once the new code is deployed and the flag is no longer receiving traffic, you can safely kick off archival and deletion of the flag in Harness FME.
Feature flag lifecycle management is automated within your governed pipeline.
Takeaway: Harness enforcement of your naming policies and native-to-Harness feature management pipeline steps allow you to ensure your flags are not reused. Ever.
You have the key tooling in hand to successfully govern and cleanly complete your feature flag lifecycles, and you can effectively do this across your organization.
More Security Best Practices - Completing the List
The focus here was on feature flag security. There is much more on Harness pipeline security, including:
- Security testing orchestration (STO) and application security posture management (ASPM)
- Role-based access control (RBAC) for all Harness resources (including feature flags, but going way beyond)
- Web Application & API Protection
- AI Security
We help you to shift security left in your SDLC, secure your CI/CD pipeline, and shield your application in production.
Harness has always put security first by design. Security is our priority. We are proud of that legacy, and we empower you to do the same.
Frequently Asked Questions
Why does security need to be considered when using feature flags?
Feature flag targeting rules or user attributes may contain sensitive information that can be protected by a well-chosen SDK evaluation mode. Flag lifecycle management is best automated and standardized across your teams, including clear flag naming conventions and well-supported cleanup practices.
You may also be interested in learning about setting up a proxy and reverse proxy to harden your network boundaries while allowing FME traffic through.
What tools does Harness provide to strengthen the security posture of my CI/CD pipeline?
Security is a top priority at Harness, and we are rapidly innovating new security tools, integrations, and partnerships. Some of these innovations are listed below:
- Static Application Security Testing (SAST)
- Software Composition Analysis (SCA)
- Supply Chain Security (SCS)
- Security Testing Orchestration (STO)
- Web Application & API Protection
- AI Security
How does Harness support you shift left and shield right in the SDLC?
Shifting left means incorporating security best practices early in the software delivery life cycle (SDLC), most preferably in the development process. This approach helps developers identify and fix vulnerabilities as early as possible and reduce costly mistakes and security patches.
That's what the Harness platform does today. Harness brings Application Security Testing directly into the development workflow, surfacing vulnerabilities where they're faster and cheaper to fix, while Supply Chain Security ensures the integrity of artifacts from build to deploy.
As code ships to production, Web Application & API Protection monitors and defends applications and APIs in real time, detecting and blocking attacks as they happen. And critically, findings in production don't disappear into a security team's backlog—they flow back to devs and engineers to remediate issues before the next release.
The result is a closed loop: find vulnerabilities early in code, protect applications in production, resolve incidents lightning fast. All on a single, unified platform.
How is security changing in the AI era?
AI-assisted attacks are surfacing in the AI era. Apple is responding to the changing technology landscape by stepping up security in an unprecedented policy change, in recognition of the security impacts of AI. Harness recently released AI Security to address the security gap that can exist with AI assisted coding.
Where can I learn more about best practices for securing my Harness CI/CD pipeline?
You can keep your knowledge current by watching the Harness Testing & Compliance blogs; the Harness Application Security Testing, Web Application & API Protection, and AI Security product pages; and organizations like Open Worldwide Application Security Project (OWASP) that regularly publishes authoritative Top 10 lists of critical security risks.

DevOps Toolchain Explained: How to Build One That Actually Scales
What is a DevOps toolchain?
A DevOps toolchain is the connected set of tools your team uses to move software from code to production: source control, CI/CD, security testing, IaC, and observability. DORA 2025 finds that elite teams deploy 182x more frequently than low performers; the difference is not more tools but fewer, better-integrated ones with shared governance.
A new engineer joins a team and asks what is a DevOps toolchain. What comes back is a 22-line inventory: a source host, two CI systems, an IaC engine, a registry, three scanners, a deployment tool, a couple of dashboards, and nobody who can fully explain how they all connect. That inventory is the team's DevOps toolchain, and its length is often mistaken for its strength.
A DevOps toolchain is the set of tools spanning the software delivery lifecycle (source, build, test, security, deployment, and operations) that a team assembles to move software from code to production safely and reliably. A useful DevOps toolchain covers every stage with as few disconnected tools as possible. The goal is not the longest list. It is the smallest unified stack that lets teams ship faster and safer.
Why isn't the longest DevOps toolchain the best one?
Every team needs certain tools: source control, CI, CD, security testing, observability. But the instinct to add a specialised tool for every edge case is what creates sprawl. A team running GitHub, Jenkins, CircleCI, ArgoCD, Terraform, Atlantis, LaunchDarkly, Snyk, Datadog, and PagerDuty is not well-equipped. It is fragmented. Each tool owns its logs, its access model, and its failure modes.
The real cost of a long DevOps toolchain is not the tool licenses. It is the integration toil, the governance gaps, the constant context-switching, and the developer time spent chasing approvals instead of shipping. Harness research (State of AI in Software Engineering 2025) shows 71% of teams say context-switching between tools drains productivity, and 73% of engineering leaders report barely any teams have standardized golden paths.
A DevOps toolchain that scales is not the one with the most tools. It is the one where adding the hundredth team costs about what adding the tenth did, because the path is standardized and governed centrally, not rebuilt each time.
What DevOps automation tools, CI/CD automation, and devops toolchain list do you need?
A functional DevOps toolchain covers these stages. Each stage has multiple options, but the principle is the same: choose DevOps automation tools that integrate well, then consolidate the integration points.
The categories matter less than the integration. A CI tool that shares a policy layer with your CD and GitOps platform and security testing stages is more valuable than three separate tools with no shared context. CI/CD automation is the backbone, but the value compounds when security, cost, and reliability share the same governance layer. The Internal Developer Portal is what surfaces these as golden paths developers self-serve on, rather than ticket queues they wait on.
How does AI change your DevOps toolchain requirements?
AI coding assistants changed the production rate. Developers now produce code significantly faster, and organizations ship faster as a result. But the DevOps toolchain that has to test, secure, and ship that code did not accelerate at the same rate. That mismatch is the AI Velocity Paradox: the build queue grows, the deployment queue grows, the surface area for security scanning expands.
A DevOps toolchain that worked fine for 50 commits a day falls apart at 500. The solution is not to add more tools. It is to consolidate the ones you have so governance, verification, and rollback stay consistent as volume increases.
Teams using AI coding tools most heavily have the highest remediation rates (22%) and longest mean time to recovery (7.6 hours), according to the Harness 2026 State of DevOps Modernization. That is not a tool problem. It is a governance and integration problem.
How Harness simplifies DevOps toolchain consolidation
The challenge
Platform teams are asked to give developers fast, self-service delivery while maintaining governance and reliability. As AI accelerates code output and tools accumulate, the after-code stages (testing, securing, deploying, operating) fragment across products with no shared context or governance. The platform team ends up maintaining integration seams instead of improving delivery.
The approach
Harness is the AI-native Software Delivery Platform that automates and governs everything after code is written. The Software Delivery Knowledge Graph ties each build, deployment, and security event back to the service and commit it came from. On that foundation sit the after-code modules: Continuous Delivery and GitOps, Continuous Integration, the Internal Developer Portal, Infrastructure as Code Management, Application Security Testing, AI SRE, and Cloud and AI Cost Management. Each inherits shared access control, governance, and a single audit trail. Developer-friendly guardrails.
The outcome
Consolidating the after-code stages onto one governed platform reduces governance gaps, accelerates remediation, and cuts the developer toil that sprawl creates. Teams can ship faster and safer as they scale, and adding new teams or services does not require rebuilding the entire DevOps toolchain. See how teams have simplified their toolchains.
How have teams simplified their DevOps toolchains?
Two teams, two different sprawl problems, one pattern: consolidation returns engineering time to the work that requires judgment.
How did Ancestry go from 80 Jenkins instances to governed CI/CD at scale?
Ancestry managed over 80 distinct Jenkins instances: one per team, with no central governance. Consolidating onto Harness let them apply a single pipeline change across all teams instead of editing each instance by hand. The result: an 80-to-1 reduction in pipeline implementation effort, 50% fewer deployment-caused outages, and a 78% reduction in systems-onboarding toil.
“Harness now enables Ancestry to implement new features once and automatically extend those across every pipeline, representing an 80-to-1 reduction in developer effort.”
Ken Angell, Principal Architect, Ancestry
Source: Ancestry adds consistency and governance to cut downtime
How did a UK software company cut manual DevOps tickets by 80 to 90%?
A UK-based software company relied on manual, ticket-based access requests for GitHub, Copilot, and AWS, creating a continuous bottleneck for a small DevOps team. Adopting the Harness Internal Developer Portal turned that manual overhead into self-service workflows with guardrails. Priority projects onboarded in weeks instead of months; the DevOps team refocused on higher-value work.
“We have reduced tickets by 80 to 90%. What took a full-time team to manage manually is now done automatically with appropriate guardrails.”
Principal DevOps Architect, enterprise software company
Source: Enterprise software company reduces DevOps tickets by 80%
Consolidate the DevOps toolchain: CI CD automation and beyond
The best DevOps toolchain is not the longest devops toolchain list. It is the one where fewer, well-integrated DevOps automation tools replace fragmented point solutions, and where adding the hundredth team costs about what adding the tenth did. Start from the governance gaps: find the stages where your audit trails break, where approvals wait on a human, where a deploy needs someone watching a dashboard. Those are the integration seams worth removing.
A unified platform covering the after-code lifecycle with shared governance, golden paths, and AI-native automation is how teams absorb AI-generated code at machine speed without losing control of what ships.
See how Harness brings the full after-code lifecycle onto one platform.
FAQs about the DevOps toolchain
What is a DevOps toolchain?
A DevOps toolchain is the connected set of tools spanning the software delivery lifecycle: source control, CI, artifact management, security testing, deployment, and monitoring. The goal is not the longest list but the smallest unified stack with shared governance that lets teams ship faster and safer.
What is the difference between a DevOps toolchain and a CI/CD pipeline?
A CI/CD pipeline automates build, test, and deployment. A DevOps toolchain is the broader set of tools spanning planning, coding, security, operations, cost, and reliability. Every pipeline lives inside a toolchain, but a toolchain covers stages a pipeline alone does not.
How many tools should a DevOps toolchain include?
Fewer well-integrated tools scale better than many loosely connected ones. The average team runs 8 to 10 AI tools and up to about 30 across the full SDLC. The goal is sufficient coverage with minimal integration seams and one governance layer across all of them.
What is a golden path, and why does it matter for a DevOps toolchain?
A golden path is a pre-approved, standardized pipeline template that lets teams self-serve within guardrails. New teams onboard onto a consistent, governed process instead of rebuilding their own. 73% of engineering leaders report barely any teams have golden paths, which is the clearest signal of toolchain sprawl.
How do you consolidate a DevOps toolchain without losing specialized capabilities?
Unified platforms consolidate the after-code stages (CI, CD, security, cost, reliability) while maintaining specialized capability in each. The goal is removing integration seams, not eliminating tools you actually need. If a tool solves a real problem and integrates cleanly, keep it. If it adds governance gaps, it is a candidate for consolidation.
How does CI/CD automation fit into a DevOps toolchain?
CI/CD automation is the backbone of the DevOps toolchain: it connects the build, test, and deploy stages into a repeatable flow. The value compounds when CI/CD shares a policy engine and audit trail with security, cost, and reliability tools, rather than running as an isolated pipeline.

Software Release Management: A Practical Guide for Engineering Teams
What is software release management?
Software release management is the set of practices, tools, and governance that moves code safely from development into production through defined stages (CI/CD, approval gates, progressive deployment, and rollback). DORA 2025 research finds that elite teams recover from failures 24x faster than low performers; release management discipline is the separator.
A software release is a moment. Software release management is the process that leads to it. It spans planning, testing, approvals, deployment, monitoring, and rollback: every controlled step between code and production.
Software release management is the set of practices, tools, and governance that ensures code moves safely from development into production, with clear stages, approval gates, verification checkpoints, and a rollback strategy. The goal is to reduce risk, accelerate delivery, and give teams confidence that they can ship at any time without breaking production.
In practice, release management means your team has a defined process, code does not go to production without approval, you test before release, you can verify that a release is working, and you can roll back quickly if it does not.
What are the stages of the software release pipeline and management process?
Every release follows a path through your release pipeline. The stages differ by organization and risk tolerance, but the pattern is consistent: prepare, validate, approve, deploy, monitor, and be ready to revert.
What is the difference between deploying and releasing software?
These terms are often used interchangeably, but they mean different things.
Deployment is a technical action: moving code from one environment to another. You can deploy code to staging, to a canary, to 5% of users, or to your data center. Deployment is infrastructure-driven.
Release is a business decision: making a feature or fix available to end users. You can deploy a feature without releasing it (using feature flags), or release a feature that was deployed days ago. Release is decision-driven.
In practice: you can deploy rapidly, but releases should be deliberate. That is why feature flags and experimentation have become essential software release tools in modern release management: they let you decouple deployment from release, verify before exposure, and roll back without redeploying.
Why does the AI Velocity Paradox make software release management harder?
AI coding assistants are accelerating code production. Developers using tools like GitHub Copilot write code 63% faster. That is a win until your release pipeline cannot keep up. According to Harness research, 72% of organizations have experienced at least one production incident from AI-generated code. That is the AI Velocity Paradox: faster code, but the safety gates did not accelerate with it.
The math is simple. If code is produced 2x faster but testing and approval stay the same speed, the queue grows, and either releases slow down or safety checks start to skip. Release management becomes the bottleneck.
Key insight: The solution is not to slow down code production. It's to automate your release gates so they can process more code safely, faster.
The best release management tools, software release tools, and software release platform options
Strong release management looks the same everywhere: automation where possible, human judgment where it matters, and speed without recklessness. The right software release platform enforces that discipline.
- Automate testing and validation gates. Run tests automatically before any release; do not let a human forget. Make approval gates automatic too: if a release meets policy, do not wait for a person to click a button.
- Make rollback easy and fast. If a release breaks production, teams should be able to revert in seconds, not hours. Design your release process so rollback is a one-button action.
- Use feature flags for safer releases. Release code to production but keep features off. This gives you time to verify before users see the change, and lets you roll back instantly without redeploying.
- Monitor actively from day one. Do not wait for users to report problems. Watch error rates, latency, and business metrics immediately after release; catch issues in minutes, not hours. AI SRE tools can automate this correlation and remediation.
- Follow the DORA metrics. DORA (DevOps Research and Assessment) tracks four key metrics: deployment frequency, lead time for changes, change failure rate, and mean time to recovery. Strong release management improves all four.
How Harness approaches software release management
The challenge
As AI accelerates code production, teams face a choice: slow down releases to maintain safety, or ship faster and accept higher incident rates. The real problem is that release management is fragmented. Testing happens in one tool, approvals in another, deployment in a third, and monitoring in a fourth. That fragmentation slows everything down and creates the governance gaps that incident postmortems trace back to.
The approach
Harness offers a unified software release platform that manages the entire release process: from automated testing through approval gates, deployment strategies, and rollback. It integrates with Continuous Integration so testing happens first, then the Internal Developer Portal for governance and golden paths. The Software Delivery Knowledge Graph ties each release back to the code, the tests, and the business outcome. Feature Management and Experimentation decouples deploy from release. AI SRE monitors and remediates automatically.
The outcome
Teams consolidate release management onto one governed platform, which reduces cycle time, lowers change failure rates, and gives teams confidence to ship faster. Automation handles the routine gates; teams focus on the decisions that matter. Hundreds of engineering teams trust Harness to govern their release processes at scale.
How have teams mastered software release management?
The evidence shows up in delivery metrics, not just in tooling decisions.
How did The Warehouse Group cut release lead time from 120 hours to one hour?
The Warehouse Group, a New Zealand retail enterprise, had a manual release process: approvals were slow, testing was inconsistent, and incidents took hours to roll back. Moving onto Harness CD gave developer squads on-demand deployment with governance enforced through the pipeline. Lead time for changes dropped from 120 hours to 1 hour, a 99% reduction.
“We saw lead time for changes decrease from 120 hours to 1 hour by using Harness as a key part of our path to production. This gain in efficiency is key to supporting our business goals.”
Matt Law, DevOps Chapter Lead, The Warehouse Group
Source: The Warehouse Group reduces change lead time by 99%
How did Ancestry govern release management across 80-plus pipelines?
Ancestry managed a decentralized release process: each team owned its own pipeline with different standards and approval processes. Consolidating onto Harness let them apply a single pipeline change across all teams instead of editing each instance by hand. The result: 50% fewer deployment-caused outages and a governed release process across all teams.
“Harness now enables Ancestry to implement new features once and automatically extend those across every pipeline, representing an 80-to-1 reduction in developer effort.”
Ken Angell, Principal Architect, Ancestry
Source: Ancestry adds consistency and governance to cut downtime
Build a release management process that keeps pace with AI
Software release management is not a bureaucratic layer on top of shipping. It is the mechanism that makes fast, confident shipping possible. As AI tools push more code through your pipeline, the teams that pull ahead are the ones that automated their release gates before the volume arrived.
The components are the same everywhere: a clear release pipeline with defined stages, automated approval gates, feature flags that decouple deploy from release, live monitoring tied to rollback, and DORA metrics that tell you whether it is working. The software release platform you choose determines how much of that you can automate, and how fast you can move when something goes wrong.
FAQs about software release management
How often should a team release?
Deployment frequency depends on risk tolerance and product type. Many successful teams release multiple times per day; others release weekly. The key is that you can release confidently at your chosen cadence without increasing incident rates. DORA metrics are the benchmark: elite teams deploy on-demand.
What is the difference between a release manager and a DevOps engineer?
A release manager owns the release process: planning, approval gates, communication, and rollback decisions. A DevOps engineer builds the infrastructure that makes releases automated and safe. Both roles are essential, though in many teams the responsibilities overlap and are handled by the same person.
How do feature flags help with software release management?
Feature flags let you deploy code without releasing it. You can deploy a new feature to production but keep it switched off, then turn it on gradually (to 1% of users, then 10%, then everyone). If something breaks, you switch it off without redeployment needed. This separates deploy risk from release risk.
What happens if a release goes wrong?
That is what rollback is for. If errors spike or users report problems, you should be able to revert to the previous version in seconds. This is why fast rollback is a non-negotiable best practice, and why automated continuous verification (which catches problems before they reach users) is equally important.
How do you balance speed with safety in software release management?
Automate everything you can: testing, approval gates, deployment verification. Reserve human judgment for the decisions that matter. Automation handles the routine; humans focus on strategy. Teams that automate their release gates first are the ones that can safely absorb faster code production from AI coding tools.
What is a release pipeline and how does it differ from a CI/CD pipeline?
A release pipeline is the end-to-end flow from code merge to production, including approval gates, deployment strategies, and rollback. A CI/CD pipeline is the build-and-deploy automation inside that flow. The release pipeline is broader: it includes the governance, verification, and rollback layers that CI/CD alone does not cover.
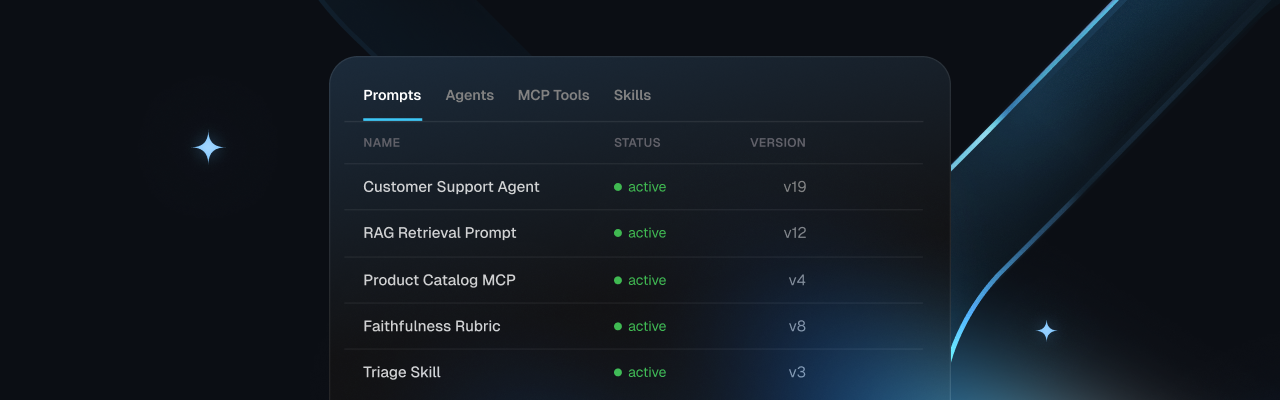
Organizing and governing AI Assets
- AI assets (prompts, skills, agents, plugins, commands) are sprawling unmanaged across repos. Harness IDP's AI Asset Catalog brings them into the same governed catalog as existing software components (APIs, environments, etc.).
- Four core capabilities: Git-driven auto-discovery, semantic/natural-language search, lineage & ownership mapping, and automated scorecards for risk/compliance.
- Benefits differ by role: developers get reusable, verified building blocks; platform teams get a single source of truth; security/governance teams get automated policy enforcement instead of chasing shadow AI.
Here is a story platform engineering teams know by heart: developers find a shiny new tool, start building at a breakneck pace, and before you know it, the organization is drowning in a massive wave of unmanaged components.
Right now, that exact story is playing out with generative AI.
Developers are spinning up prompts, skills, agents, plugins, and custom commands faster than anyone can keep track. They are forking them, tweaking them, and quietly dropping them across dozens of scattered repositories. Sure, some of them work. But many of them carry real operational and compliance risks. And almost none of them can be found by the next engineer who needs the exact same thing. So everyone starts from scratch which leads to redundancy, wasted effort, and unnecessary complexity.
The reality is that we are looking at a classic case of sprawl, just with a fresh coat of AI paint.
That is exactly why we built the AI Asset Catalog in Harness IDP. We have spent the last few months baking these capabilities directly into our internal developer portal catalog, elevating AI Assets to a first-class entity right next to your standard components, APIs, and environments.
Why an AI Catalog belongs in your developer portal
There is an understandable temptation to treat AI components like they are some kind of alien technology that requires a completely bespoke tooling stack. I would argue the exact opposite.
The fundamental reasons a software catalog exists do not change just because a component uses a large language model. You still need to answer three basic questions: What do we have? Who owns it? Is it safe to use? Those core questions apply to an AI skill or an autonomous agent just as cleanly as they do to a traditional microservice.
By placing AI assets inside the same developer portal your teams already use, they automatically inherit your existing software governance model. You do not have to stand up, secure, and maintain a separate control plane. Because the AI Asset Catalog runs natively on the Harness platform, your AI components are instantly scoped by your granular role-based access control, and changes are logged in your immutable audit trails.
This unified control plane becomes incredibly important as autonomous agents start acting on your production systems. Through the Harness MCP Server, external coding assistants can already safely discover ownership and platform standards directly from your catalog. The AI Asset Catalog simply extends that exact same auditable model to the very building blocks those agents are built from.
A closer look at the AI Asset Catalog capabilities
The AI Asset Catalog automatically indexes, maps, and scores your internal AI components to make them instantly discoverable. We focused on four core capabilities to keep things simple and highly scannable:
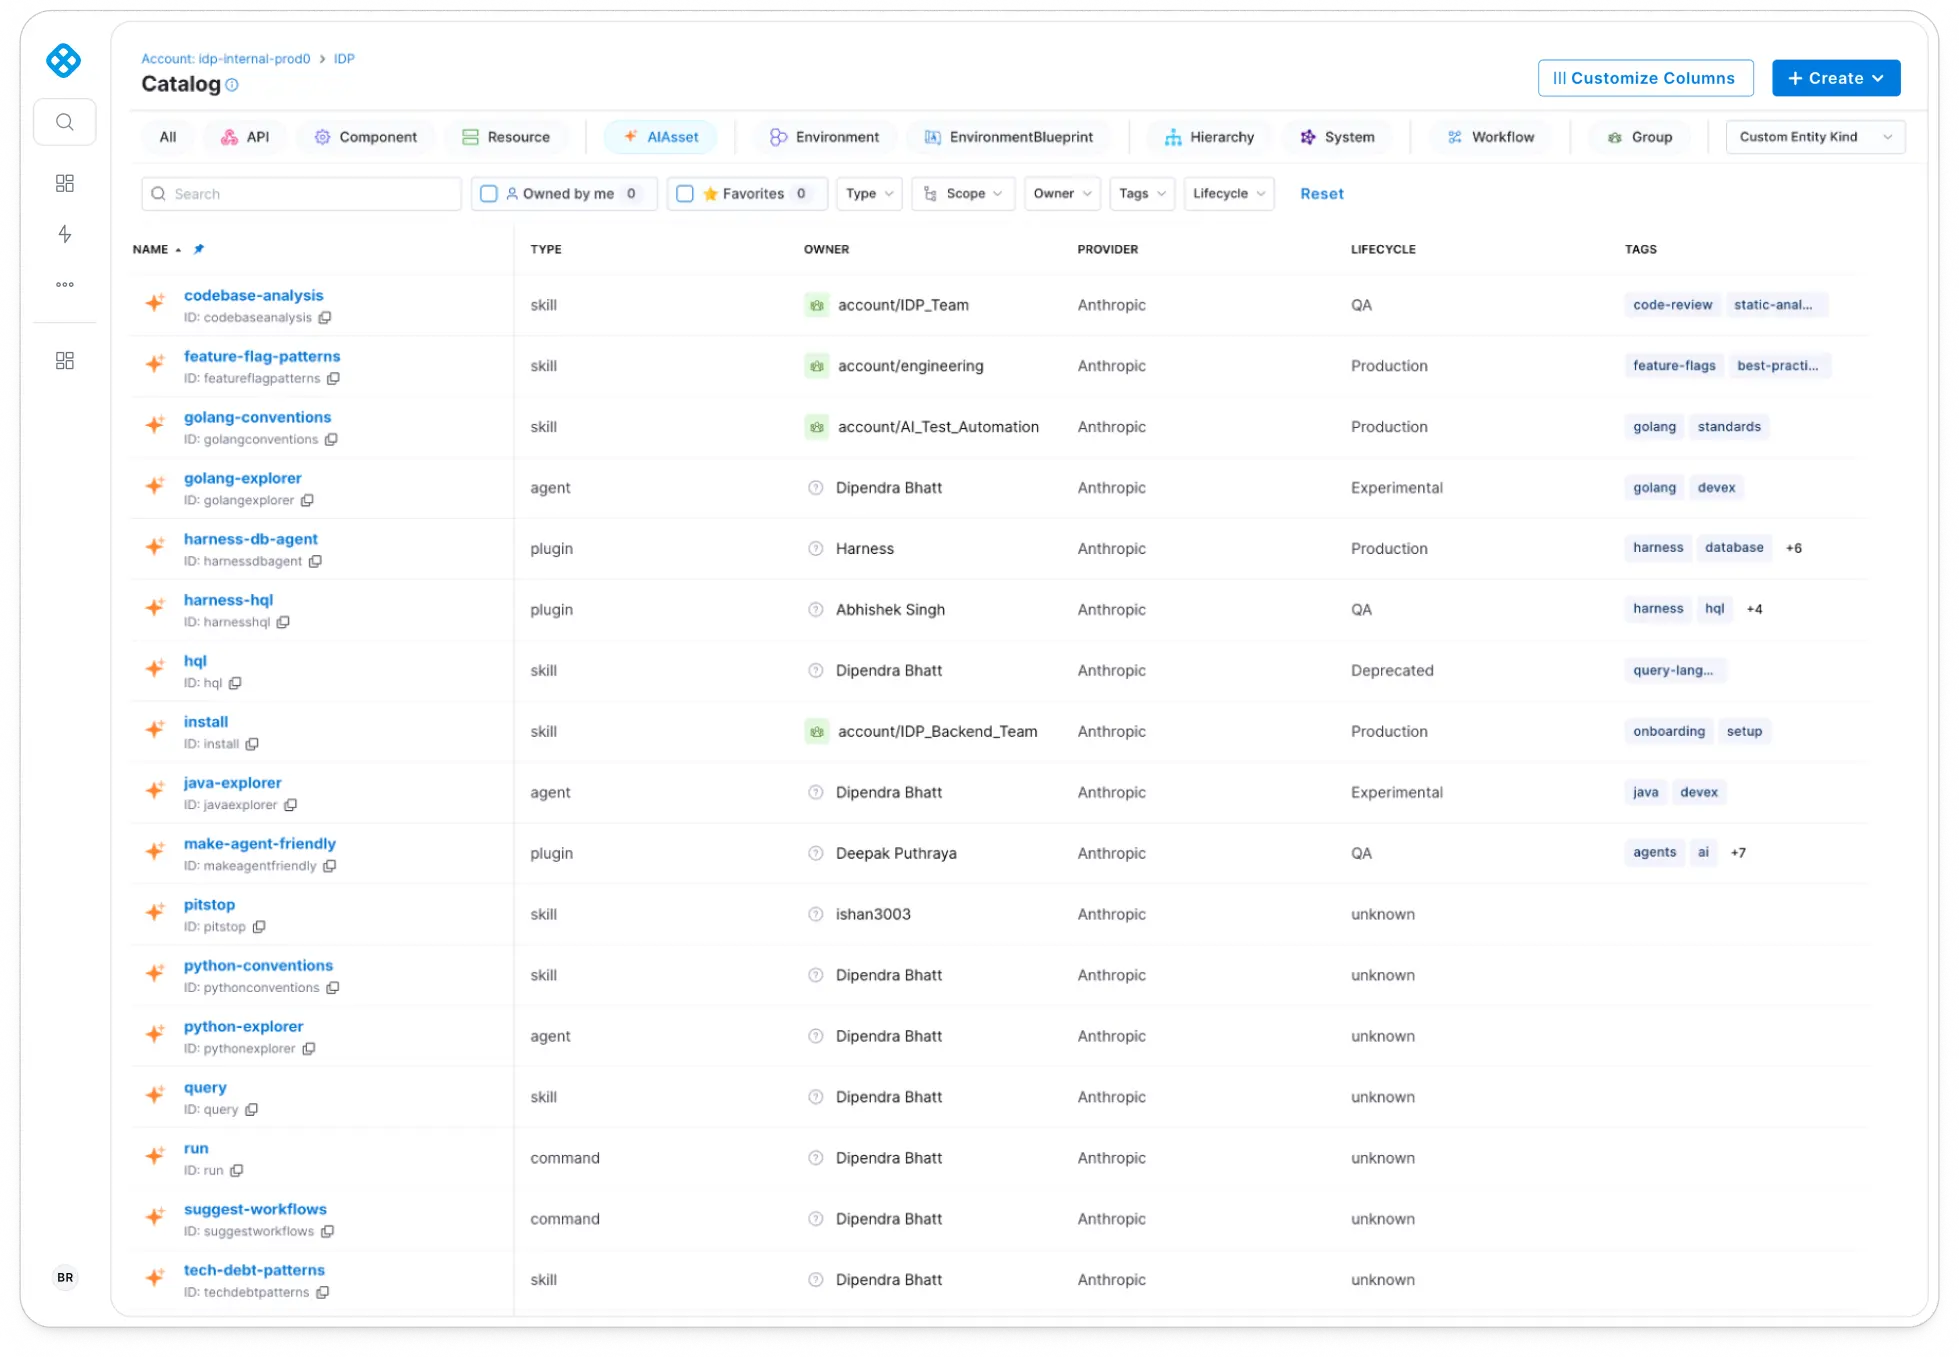
Automated, Git-driven discovery
Manual cataloging is where good ideas go to die because nobody has the spare cycles to keep documentation current. That is why discovery is entirely driven from where your engineers actually live: source control.
With a simple toggle via our GitHub integrations, Harness automatically ingests, de-duplicates, and maps AI assets straight from your repositories. There is no manual upload step and no parallel registry to baby-sit. When an asset changes in Git, the catalog updates in lockstep.
Intelligent content ingestion and semantic search
Simply indexing a text file is not the same as actually understanding its purpose. Harness AI reads and parses the artifacts that describe your assets, including instruction files, agent.md profiles, and READMEs, to interpret exactly what a component does.
This deep parsing powers an intuitive natural language search. Instead of playing keyword guessing games, a developer can type a plain question like, "Is there an approved skill to analyze my codebase?" The portal instantly surfaces verified items along with cleanly formatted execution constraints, meaning teams can understand the intent and health of an asset before they ever decide to consume it.
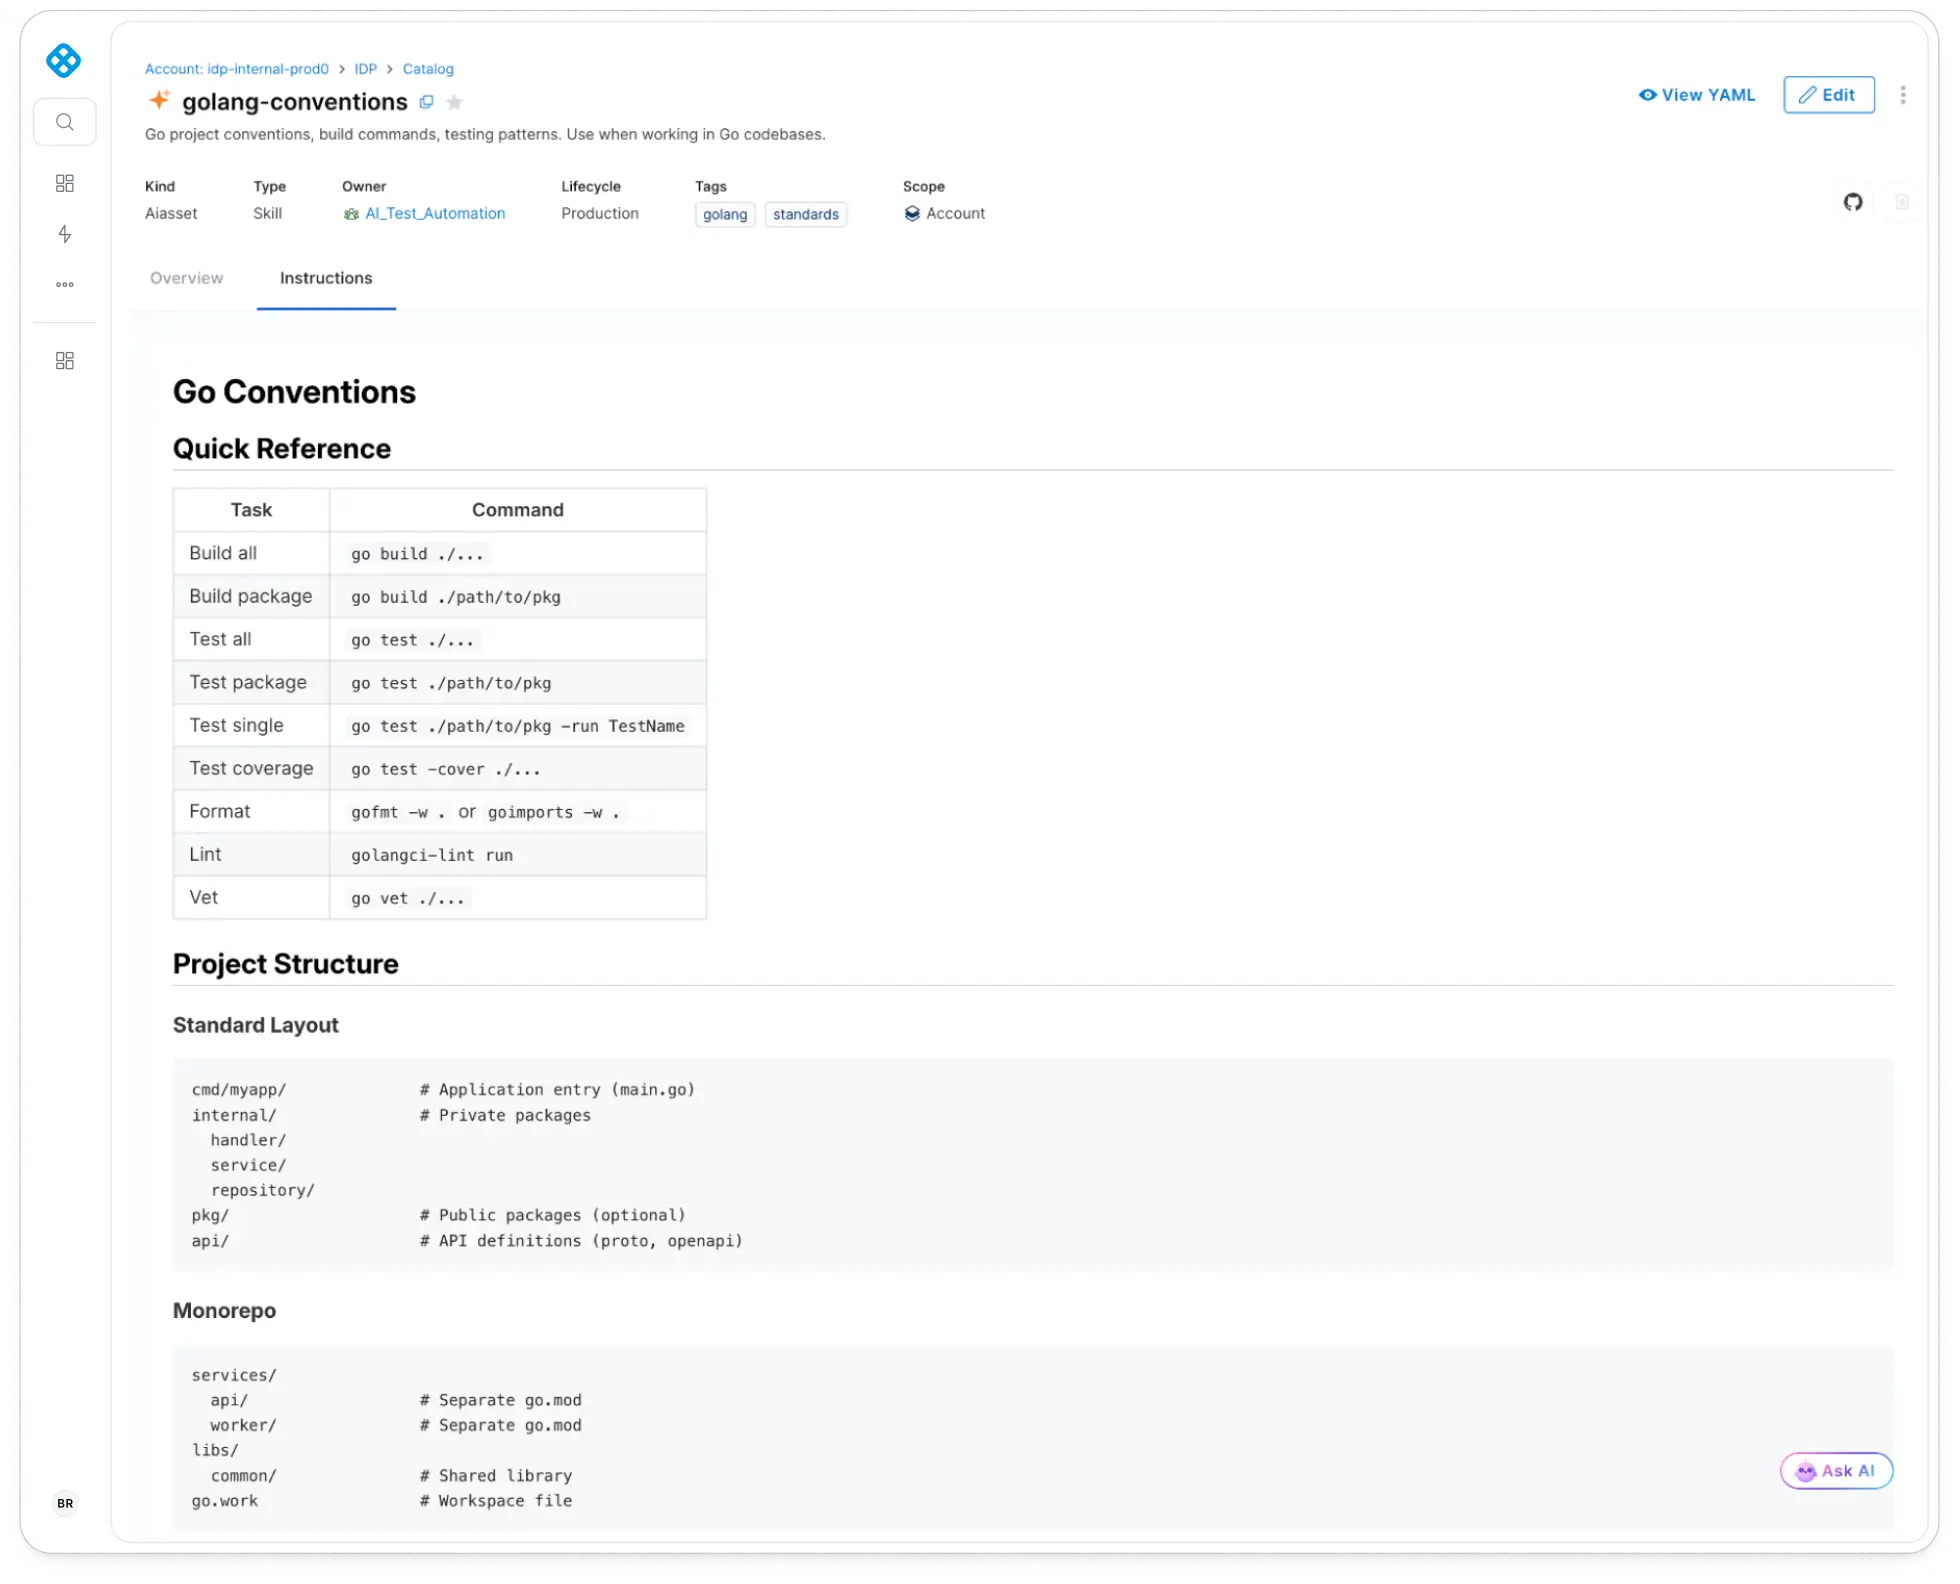
Lineage and team ownership mapping
Modern AI architectures are highly compositional. A single plugin bundles multiple skills, an agent triggers specific commands, and a command relies on a highly tuned prompt. When those invisible links break, debugging turns into an absolute nightmare.
The catalog visually charts these parent-child relationships automatically. It maps precisely how prompts and skills roll up into specific plugins, while enforcing explicit team ownership. When an asset misbehaves, you do not waste hours on a wild goose chase; you immediately know the exact blast radius and the exact team to page, slashing triage and support times.

Automated AI asset scorecards
Enabling developer reuse is fantastic, but it is only safe if you can separate reliable, compliant assets from experimental code. Scorecards bring our established software maturity and governance patterns straight to the AI playground.
Our out-of-the-box checks evaluate every single AI asset against essential dimensions: structural integrity, risk maturity, confidence levels, popularity, and data classification compliance. Out-of-policy components are flagged proactively, stopping compliance violations before they escape into production environments. Because these scorecards hook into our broader platform reporting, engineering leaders get a true company-wide view of AI maturity without a separate reporting headache.
Who feels the difference?
The value of a centralized AI catalog looks a bit different depending on your day-to-day role:
- Application Developers: You can stop wasting hours rewriting a prompt or an execution skill that a peer team down the hall already perfected. Natural language search gives you verified, ready-to-use building blocks with clear operational guidelines, making reuse the path of least resistance.
- Platform and DevOps Engineers: You finally get a single pane of glass to track exactly what agents and plugins exist across the enterprise. You can replace chaotic AI sprawl with a clean, searchable source of truth that defines clear ownership and code dependencies.
- Security and Governance Leaders: You can trade your late-night anxiety about shadow AI components and unverified code leaks for automated guardrails. Scorecards proactively flag out-of-policy items and seamlessly enforce your corporate risk matrices.
The big picture
The AI Asset Catalog is not just a shiny standalone tool. It is a foundational part of our goal to make Harness IDP the definitive control plane for both human developers and autonomous AI agents.
Google's DORA research regularly reminds us that while AI code generation tools are making coding faster, actual software delivery throughput remains stubbornly flat because teams get bogged down in downstream execution, testing, and security bottlenecks. Only about 30% of engineering time is spent actually writing code. We want to fix that chokepoint across the entire lifecycle.
Simply put, the catalog handles the question of what assets you have and whether they are safe to use. Our Knowledge Agent assists engineers by executing complex workflows, and our MCP Server grounds external LLMs in your internal architecture and governance standards. Underneath it all sits the exact same secure, auditable platform you already trust to ship code safely every single day.
If you are already running Harness IDP, getting started is incredibly straightforward. You just plug in your existing GitHub or Bitbucket repositories, turn on automated discovery, and watch the catalog map out your AI ecosystem. From there, you can roll out scorecards, assign clear team ownership, and let your developers innovate with total confidence.
FAQs
How does the catalog discover AI assets — do I need to manually upload anything?
No manual step is required. It ingests directly from source control (GitHub/Bitbucket) and stays in sync automatically as Git repos change.
What kinds of AI components does it track?
Prompts, skills, agents, plugins, and custom commands, including their parent-child relationships (e.g., which skills roll up into which plugins).
How does it decide if an asset is safe or compliant to use?
Through automated scorecards that check structural integrity, risk maturity, confidence, popularity, and data classification, flagging out-of-policy assets before they reach production.
Does this require a separate governance or security tool?
No, it inherits the existing Harness platform's RBAC, Open Policy Agent policy layer, and audit trails, so there's no new control plane to stand up.
How is this different from the Harness MCP Server or Knowledge Agent?
They're complementary: the catalog answers "what assets exist and are they safe," the Knowledge Agent executes workflows, and the MCP Server grounds external LLMs/coding assistants in your internal architecture and standards.
.png)
Introducing AI Agent Deployment in Harness Continuous Delivery
- Agent development today is too risky. Only ~8% of organizations have gotten agentic AI into production. Most of the rest are stuck deploying agents by hand or with one-off CI jobs. This slows teams down and, for those who push forward anyway, leaves no record of who deployed what or how its quality was evaluated.
- Deployment is where that risk actually lives. Building an agent has gotten easy; getting it into production safely hasn't. Fixing that starts with the deployment step itself: predictable, repeatable, and owned by the platform.
- Harness makes agent deployment safe and easy. Agent Deployments in Harness CD brings tested, out-of-the-box pipeline steps for platforms like Google's Agent Runtime and Amazon Bedrock AgentCore, so teams get governed, auditable agent releases without hand-rolled scripts, using the RBAC, policy engine, and audit trail they already trust for the rest of their software delivery.
- Agents don't ship alone. Harness coordinates the agent alongside what it depends on: backend services, database changes, and prompt or model config. There’s one release governed by one tool.
Overview
Teams building agents have converged on something that looks a lot like the software development lifecycle, but reshaped around a system whose output isn't deterministic: prototype an agent against a framework, evaluate it against a dataset of expected behavior, deploy it somewhere real, observe how it behaves against live traffic, and feed what you learn back into the next prototype. Call it the agent development lifecycle (Agent DLC).
Most of that lifecycle borrows tooling that already existed - a framework like LangGraph or Google's ADK for the prototyping stage, an eval platform for the evaluation stage. This post is about one stage of that lifecycle: deployment, and the decisions behind how we help users deploy their agents reliably with Harness Continuous Delivery.

Because deployment is when an agent shifts from being safely under test to being exposed to production, decision-making and safety are critical. Organizations need to ensure that only good versions of agents are actually released, policies are adhered to, and a dependable audit trail is created.
Further complicating agent deployments is the fact that agents rarely stand alone and are often updated alongside changes to data, configuration, front ends, and companion services. Deploying an agent is not enough. We have to orchestrate its changes with everything else in a release.
This article covers how agent deployments are different, how to govern them, and what release orchestration with agents looks like. In short, how to make agent deployments both safe and easy.
Where deployment sits in the agent lifecycle
Something genuinely new shows up in the deployment stage of the Agent DLC. Rather than packaging an agent as a generic container and hosting it the way any other service gets hosted, AWS and Google both shipped purpose-built, managed runtimes for agents specifically - Bedrock AgentCore and GCP Agent Runtime.
Unlike a general compute product with an agent tutorial bolted on, these runtimes are shaped around what an agent actually needs - session and memory primitives, identity scoped to the agent rather than the pod, versioned "runtime revisions" instead of arbitrary deploys.
That's the piece that benefits from dedicated automation support. It's worth spending a minute on what changes when the target is one of these runtimes instead of a Kubernetes cluster, before getting into what we actually decided. The shift to managed runtimes means teams either build this operational muscle themselves or get it from a platform.
Kubernetes vs. Native agent runtime: what actually changes
None of this is an argument that Kubernetes is the wrong place to run an agent - plenty of teams will keep doing exactly that, and it's on our roadmap as a deployment target for this same agent-service model. It's a genuinely different set of trade-offs, not a strictly better or worse one.
This operational surface (session stores, readiness probes, traffic routing) is exactly what a native runtime (and what Harness's deployment step) absorbs for the team. The first two rows are the reason a native runtime exists at all - session and memory management is genuinely hard to get right underneath an agent, and both clouds decided it was worth building once, centrally, rather than leaving every team to rebuild it next to their pod.
The rows below that are the downstream consequence: once the platform owns session, memory, and isolation, it ends up owning versioning and traffic control too, because those all have to agree with each other underneath.
The trade Kubernetes gives up in exchange for that control is exactly the operational surface a native runtime absorbs for you: you're not sizing replica counts, standing up your own state store, or writing readiness probes for something whose "readiness" is closer to a language-model call than a TCP health check. Whether that trade is worth it depends entirely on how much of that control a given team actually wants to keep exercising, which is the real reason we're not treating native runtimes as the only supported target going forward.
A working example: the Academic Research Agent
Let's take an example of an Academic Research Agent - a LangGraph agent that searches academic papers and journals, synthesizes findings across sources, and drafts a literature-review section for a researcher to approve. It's been working in a notebook. Getting it live means three things: register it as a service, define where it runs, and put a pipeline in front of it that can promote it safely.
Deployable Entity - The Agent Service
Does a customer think about their Academic Research Agent as one thing, or as two different things depending on which cloud it happens to run on? We bet on one thing. An agent's name, its config and secrets, its purpose - those don't change depending on where it's deployed. This eliminates the need to maintain multiple deploy scripts for what is functionally one agent.
What changes is the shape of the cloud underneath it: the image reference and agent framework on Google's side, the execution role on AWS's. So the service definition keeps a single outer identity with the cloud-specific pieces contained inside it, rather than asking someone to maintain what is functionally the same agent as two separate service definitions.

We know this model works well. Our existing Kubernetes deployment type has separate infrastructure kinds per cloud (GCP, Azure, direct) underneath a single deployment type. What's different here is applying that same idea one layer higher, at the service itself, because what defines an agent - its name, purpose, and configuration - doesn't change across clouds, even though the infrastructure underneath it does get changed.

We have registered our Academic Research Agent as an Agent Service on Harness. Now, the question is about the target platform configuration, which involves defining your infrastructure.
Infrastructure: What does the agent need on a specific cloud?
The infrastructure definition is where the cloud-specific configuration lives. For the Academic Research Agent on AWS AgentCore, that means:
- A connector Harness uses to call AWS's deploy APIs
- A region, and the VPC subnets and security groups the agent should run inside
- A reference to an AgentCore Gateway - required only if traffic shifting matters

The Gateway is the one worth pausing on. It isn't automatically part of an AgentCore deployment - it's additional infrastructure the team provisions up front, specifically so traffic shifting has something to act on. If the Academic Research Agent's infrastructure skips it, deployments still work; every promotion is just a direct cutover instead of a gradual one, because there's nothing underneath to hold a partial split.
If the target is Google's Agent Runtime, the infrastructure definition asks for less than AWS's, because traffic shifting doesn't need a separate resource to act on; it's native to how GCP serves revisions.
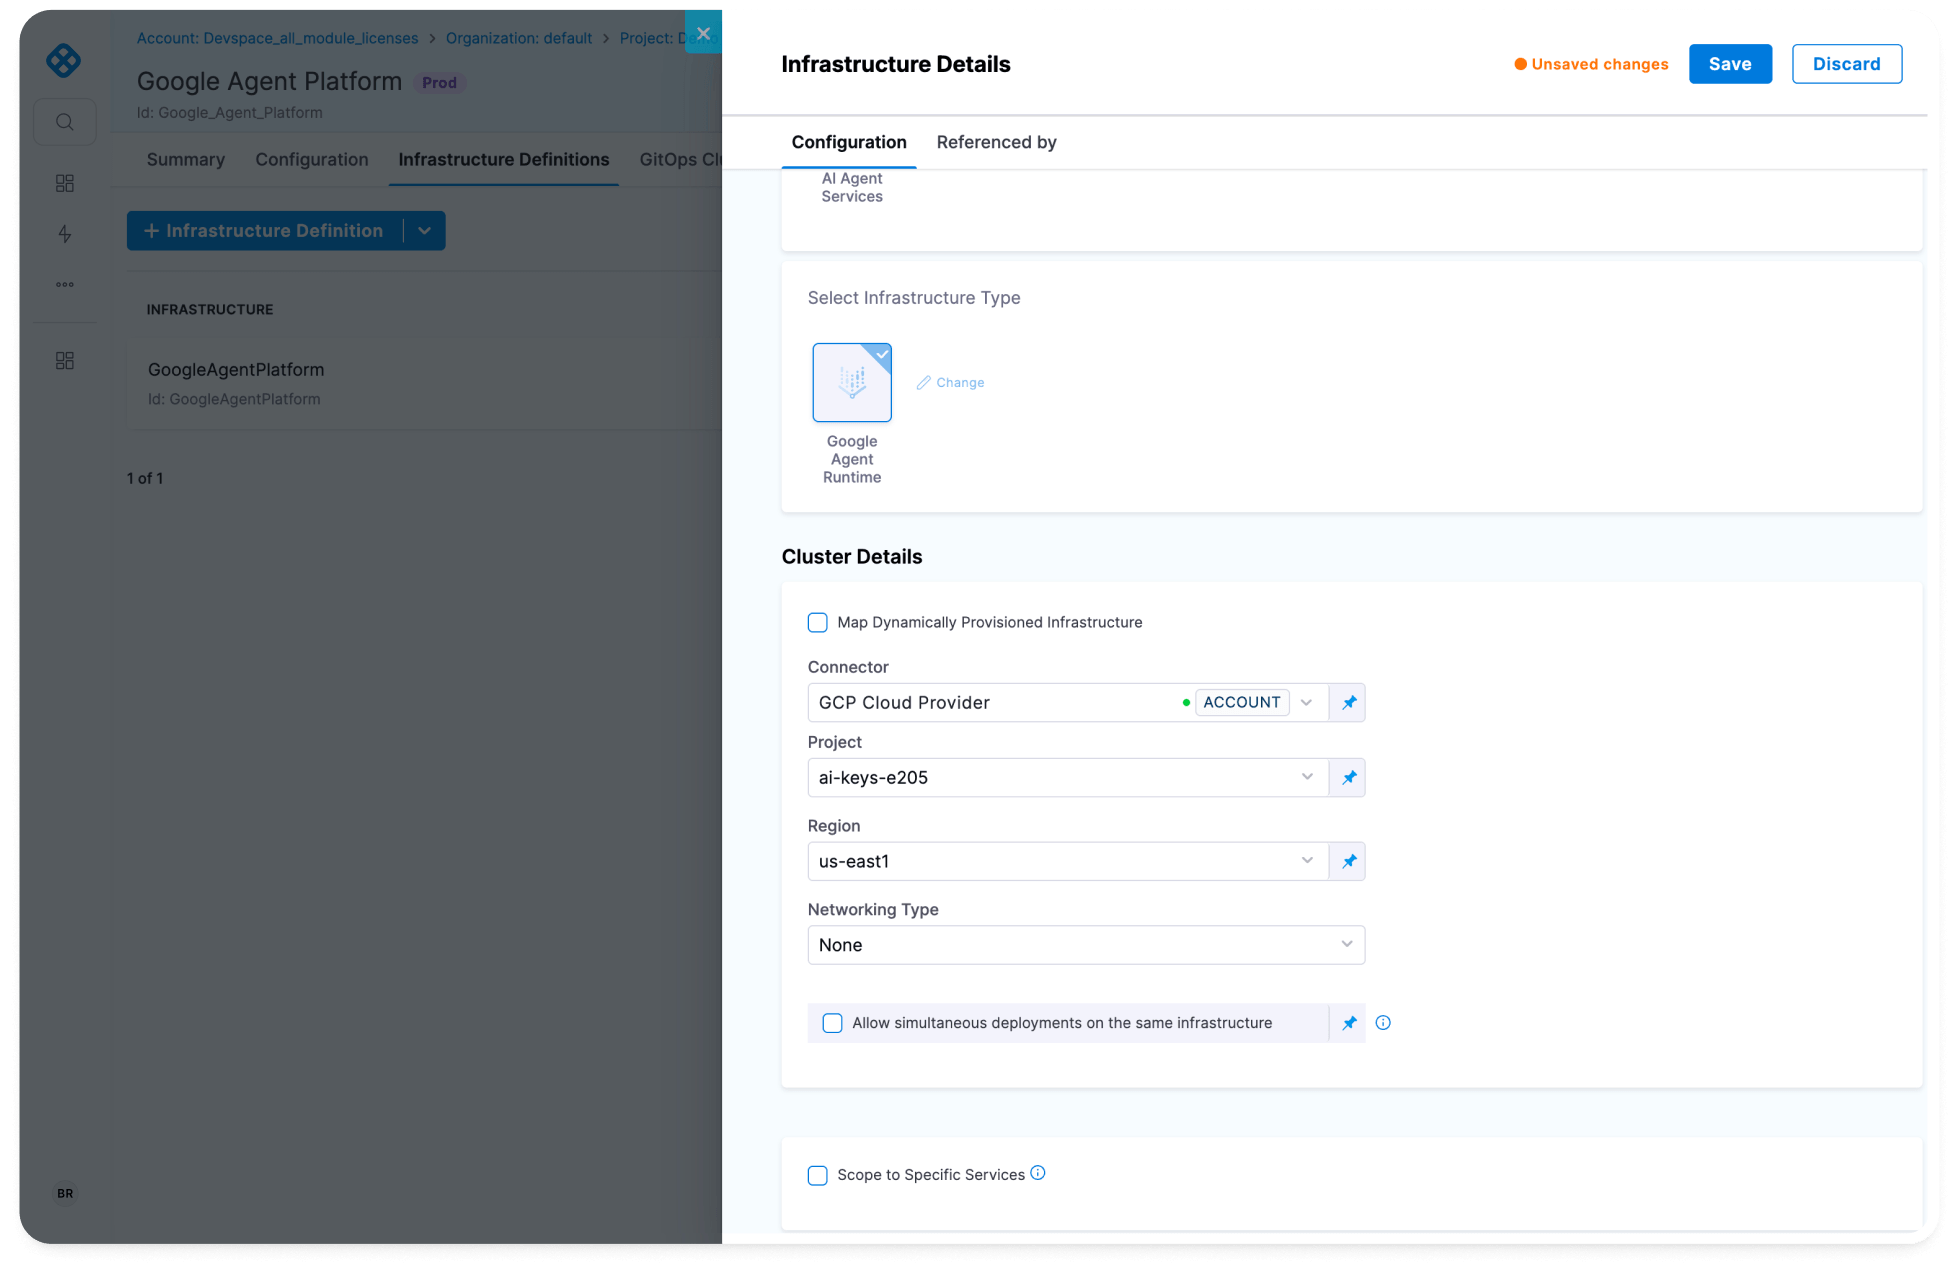
For the Academic Research Agent here, that means:
- A connector Harness uses to call Google Cloud's deploy APIs
- A project and a region
- A networking type - left at None by default, or set to a private connectivity mode if the agent needs to reach resources inside a VPC rather than over the public internet
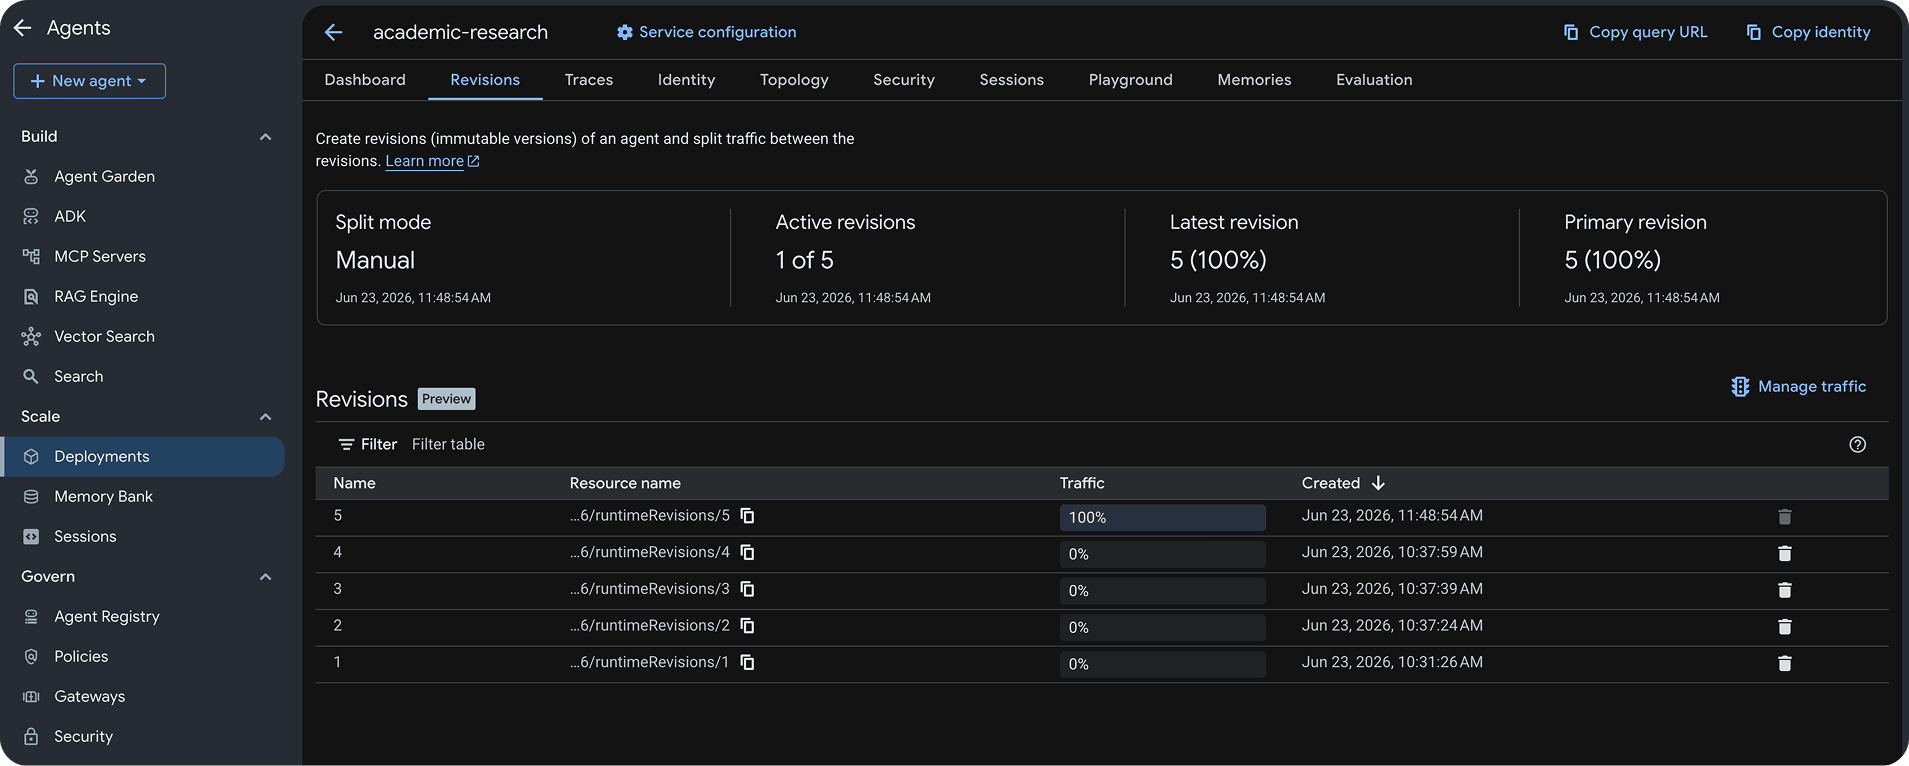
Deployment via pipeline: Simplifying deploy, shift, rollback
Underneath, the two clouds don't agree on how traffic splitting actually works. On Google's runtime, a percentage split is native to how revisions are served - the platform already speaks in those terms. AWS has no equivalent primitive on the runtime itself, which is why the Academic Research Agent's pipeline needs that Gateway from the infrastructure section: our traffic-shift step reads the gateway rule's current routing action and rewrites it, switching between a direct route and a weighted split depending on whether the requested split is a clean cutover or a partial one. Two different cloud mechanics, one authored concept on our side - a target revision and a percentage, so the pipeline for the Academic Research Agent reads the same shape it would if it were deployed to Google instead.

Rolling back the Academic Research Agent never creates anything new. It re-points traffic - or, without a Gateway configured, flips the runtime endpoint directly - back to whatever was live before. That target resolves automatically from what the deploy step actually did; nobody authors it by hand.
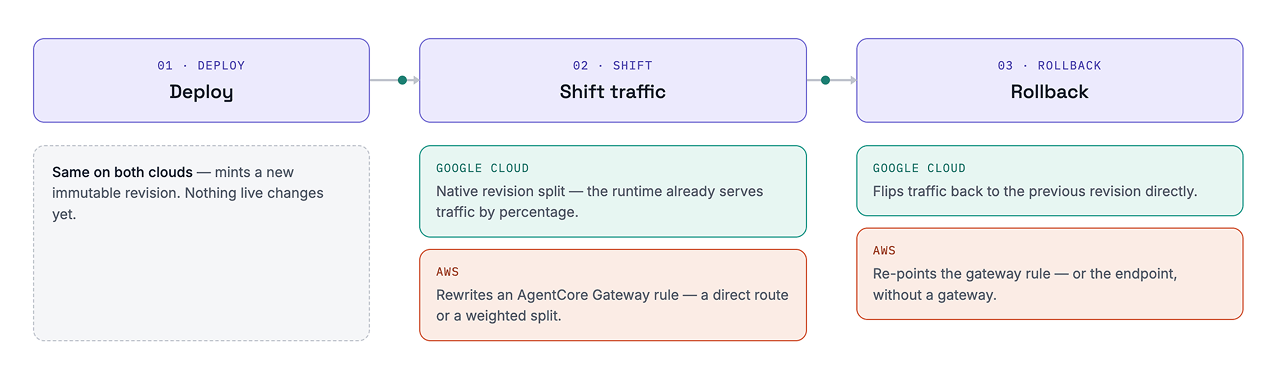
The rollback step automatically resolves its target to what the deploy step produced.
Orchestrating the Release - Multiple Agents and Backend Service
Key thing to note: Multiple agents can now be deployed together, along with other backend services, in a release.
Governance: Delivering Safely
Everything so far has been about one agent. In practice, it's never just one - the Academic Research Agent ships, and a few months later, the same research org builds a Grants Compliance Agent, owned by a different team, and to save on infrastructure, the two agree to share the same AWS AgentCore Gateway for traffic shifting. That's a completely reasonable thing to do, and it's exactly the point where governance stops being optional: a careless traffic-shift call from one agent's pipeline shouldn't be able to touch the other's routing rule, and "who deployed what, to which backend, and when" needs one answer across every agent, not a different answer per team.
We didn't build a separate governance layer for agents. An Agent Service and its infrastructure definition are first-class Harness resources, so the same three mechanisms that already govern every other deployment type apply here without modification:
RBAC: Registering an Agent Service, editing its infrastructure, triggering a deploy or rollback - scoped the same way as any other service and environment in Harness. Two agents can share a Gateway while sitting in different projects with different owners, because RBAC lives at the Harness resource level, not the cloud API level, where a shared Gateway would otherwise blur that line.
Policy as Code: Every AI Agent pipeline execution is a plan that Harness can evaluate against OPA policies before it runs, the same as any other deployment type. That's what actually protects a shared Gateway - a policy can require a traffic-shift step only to touch rules the deploying agent owns, block an overly-permissive execution role, or enforce a minimum instance count before a full cutover. Same policy engine, pointed at a new deployment type.
Approvals and audit trail: Production promotions carry the same approval step regardless of cloud target. Every deploy, shift, and rollback across every agent lands in one execution history - so "what changed on the shared Gateway, and who approved it" has one answer, not one per team.
We reused the existing model instead of deferring it, so a team's first agent and their fiftieth are governed the same way - nothing to retrofit once there's more than one.
What's next
This phase covers deployment. Two extensions are already on the roadmap.
Kubernetes as a third, agent aware deployment target: Alongside Google’s Agent Runtime and Amazon Bedrock AgentCore, we plan to let you deploy the Academic Research Agent directly to your own Kubernetes cluster - define an Agent Service with Kubernetes as the target, create a Kubernetes infrastructure definition, and get the same progressive-delivery shape through deployment strategies like canary and blue-green, rather than a separate set of primitives built just for agents.
Evaluation gates and observability, wired into the same pipeline: The outcome this phase already produces - a revision, an endpoint, a traffic state - is exactly what the next phase needs as input: a quality gate before promoting the Academic Research Agent, a validation check after, and visibility into how it's actually behaving in production. That's next on the roadmap, using eval provider connectors - Harness AI Evals, Braintrust, LangSmith, Arize, Langfuse, and others as the ecosystem grows.
FAQs
Q: What is Harness Agent Deployment?
A: Agent Deployments is a capability in Harness Continuous Delivery that brings tested, out-of-the-box pipeline steps to deploying AI agents. Instead of scripting a deploy by hand, teams register their agent as a first-class Harness service and get governed, repeatable releases.
Q: How do I deploy an AI agent to Amazon Bedrock AgentCore?
A: Register the agent as an Agent Service in Harness, define an AWS AgentCore infrastructure target (region, VPC/security groups, and optionally an AgentCore Gateway if you need traffic shifting), then run it through a Harness CD pipeline, which handles packaging, deployment, and — if a Gateway is configured — progressive traffic rollout.
Q: How do I deploy an AI agent to Google Agent Runtime?
A: Same model as Bedrock, with a lighter infrastructure definition — a connector, project, and region, plus an optional private networking mode. Traffic shifting doesn't need a separate resource the way AgentCore does, because Google Agent Runtime natively supports revision-based traffic splitting.
Q: Can I deploy AI agents to Kubernetes with Harness?
A: Yes. However, as of the writing of this blog, agent-specific support has not been added for Kubernetes, and the deployment is treated as a standard K8s artifact. We intend to add agent-aware Kubernetes support in the near future.
Q: What's the difference between deploying an agent to a managed runtime vs. Kubernetes?
A: Managed runtimes (Bedrock AgentCore, Google Agent Runtime) handle session/memory management and per-session execution isolation natively — something you'd otherwise have to stand up yourself on Kubernetes (a Redis store, custom readiness probes, etc.). It's a genuine tradeoff, not a strictly better option: Kubernetes gives you more control over that operational surface; the managed runtimes take that control away from you in exchange for not having to build it.
Q: Does Harness support canary or blue/green deployments for AI agents?
A: Harness supports progressive traffic shifting for agents — a target revision plus a percentage split, authored the same way regardless of which cloud you're deploying to, even though the two clouds implement traffic splitting differently under the hood (native revision-split on Google's side, a Gateway routing rule on AWS's).
Q: How does rollback work for AI agent deployments?
A: Rollback re-points traffic to whichever revision was live before, rather than creating a new one — the rollback target resolves automatically from what the deploy step produced, so nobody has to author it by hand.
Q: Can I govern and audit AI agent deployments the same way I govern application deployments?
A: Yes. An Agent Service and its infrastructure are ordinary Harness resources, so RBAC, OPA policy-as-code, and audit trails apply without any separate configuration for agents. This is also what lets two teams safely share underlying infrastructure (like an AgentCore Gateway) without one team's deploy affecting the other's.
Q: What frameworks does Harness support for AI agent deployment?
A: All major agent development frameworks eg. CrewAI, LangGraph, Agents SDK, ADK and custom frameworks as well.
The Modern Software Delivery Platform®
Need more info? Contact Sales