
Track build duration, queue time, success rate, and cost per build to directly improve developer productivity, control costs, and enhance delivery reliability. Standardize pipeline metadata and automate metric collection to turn raw CI data into actionable insights across teams, services, and cost centers. Pair metrics with intelligent caching, optimized testing, and build acceleration to reduce build times and operational costs while maintaining security standards.

Your developers complain about 20-minute builds while your cloud bill spirals out of control. Pipeline sprawl across teams creates security gaps you can't even see. These aren't separate problems. They're symptoms of a lack of actionable data on what actually drives velocity and cost.
The right CI metrics transform reactive firefighting into proactive optimization. With analytics data from Harness CI, platform engineering leaders can cut build times, control spend, and maintain governance without slowing teams down.
Why Do CI Metrics Matter for Platform Engineering Leaders?
Platform teams who track the right CI metrics can quantify exactly how much developer time they're saving, control cloud spending, and maintain security standards while preserving development velocity. The importance of tracking CI/CD metrics lies in connecting pipeline performance directly to measurable business outcomes.
Reclaim Hours Through Speed Metrics
Build time, queue time, and failure rates directly translate to developer hours saved or lost. Research shows that 78% of developers feel more productive with CI, and most want builds under 10 minutes. Tracking median build duration and 95th percentile outliers can reveal your productivity bottlenecks.
Harness CI delivers builds up to 8X faster than traditional tools, turning this insight into action.
Turn Compute Minutes Into Budget Predictability
Cost per build and compute minutes by pipeline eliminate the guesswork from cloud spending. AWS CodePipeline charges $0.002 per action-execution-minute, making monthly costs straightforward to calculate from your pipeline metrics.
Measuring across teams helps you spot expensive pipelines, optimize resource usage, and justify infrastructure investments with concrete ROI.
Measure Artifact Integrity at Scale
SBOM completeness, artifact integrity, and policy pass rates ensure your software supply chain meets security standards without creating development bottlenecks. NIST and related EO 14028 guidance emphasize on machine-readable SBOMs and automated hash verification for all artifacts.
However, measurement consistency remains challenging. A recent systematic review found that SBOM tooling variance creates significant detection gaps, with tools reporting between 43,553 and 309,022 vulnerabilities across the same 1,151 SBOMs.
Standardized metrics help you monitor SBOM generation rates and policy enforcement without manual oversight.
10 CI/CD Metrics That Move the Needle
Not all metrics deserve your attention. Platform engineering leaders managing 200+ developers need measurements that reveal where time, money, and reliability break down, and where to fix them first.
- Performance metrics show where developers wait instead of code. High-performing organizations achieve up to 440 times faster lead times and deploy 46 times more frequently by tracking the right speed indicators.
- Cost and resource indicators expose hidden optimization opportunities. Organizations using intelligent caching can reduce infrastructure costs by up to 76% while maintaining speed, turning pipeline data into budget predictability.
- Quality and governance metrics scale security without slowing delivery. With developers increasingly handling DevOps responsibilities, compliance and reliability measurements keep distributed teams moving fast without sacrificing standards.
So what does this look like in practice? Let's examine the specific metrics.
- Build Duration (p50/p95): Pinpointing Bottlenecks and Outliers
Build duration becomes most valuable when you track both median (p50) and 95th percentile (p95) times rather than simple averages. Research shows that timeout builds have a median duration of 19.7 minutes compared to 3.4 minutes for normal builds. That’s over five times longer.
While p50 reveals your typical developer experience, p95 exposes the worst-case delays that reduce productivity and impact developer flow. These outliers often signal deeper issues like resource constraints, flaky tests, or inefficient build steps that averages would mask. Tracking trends in both percentiles over time helps you catch regressions before they become widespread problems. Build analytics platforms can surface when your p50 increases gradually or when p95 spikes indicate new bottlenecks.
Keep builds under seven minutes to maintain developer engagement. Anything over 15 minutes triggers costly context switching. By monitoring both typical and tail performance, you optimize for consistent, fast feedback loops that keep developers in flow. Intelligent test selection reduces overall build durations by up to 80% by selecting and running only tests affected by the code changes, rather than running all tests.
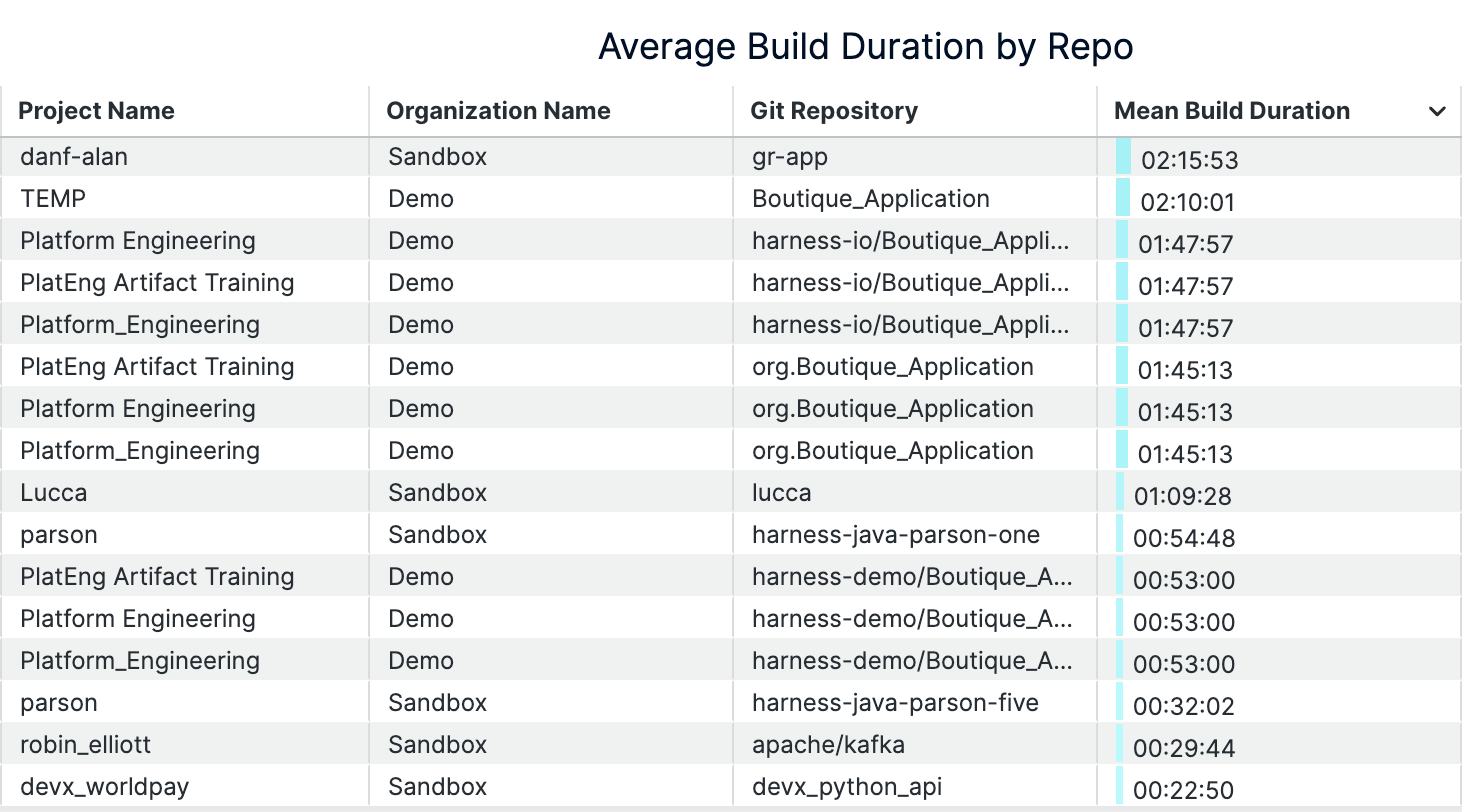
An example of build durations dashboard (on Harness)
- Queue Time: Measuring Infrastructure Constraints
Queue time measures how long builds wait before execution begins. This is a direct indicator of insufficient build capacity. When developers push code, builds shouldn't sit idle while runners or compute resources are tied up. Research shows that heterogeneous infrastructure with mixed processing speeds creates excessive queue times, especially when job routing doesn't account for worker capabilities. Queue time reveals when your infrastructure can't handle developer demand.
Rising queue times signal it's time to scale infrastructure or optimize resource allocation. Per-job waiting time thresholds directly impact throughput and quality outcomes. Platform teams can reduce queue time by moving to Harness Cloud's isolated build machines, implementing intelligent caching, or adding parallel execution capacity. Analytics dashboards track queue time trends across repositories and teams, enabling data-driven infrastructure decisions that keep developers productive.
- Build Success Rate: Ensuring Pipeline Reliability
Build success rate measures the percentage of builds that complete successfully over time, revealing pipeline health and developer confidence levels. When teams consistently see success rates above 90% on their default branches, they trust their CI system to provide reliable feedback. Frequent failures signal deeper issues — flaky tests that pass and fail randomly, unstable build environments, or misconfigured pipeline steps that break under specific conditions.
Tracking success rate trends by branch, team, or service reveals where to focus improvement efforts. Slicing metrics by repository and pipeline helps you identify whether failures cluster around specific teams using legacy test frameworks or services with complex dependencies. This granular view separates legitimate experimental failures on feature branches from stability problems that undermine developer productivity and delivery confidence.
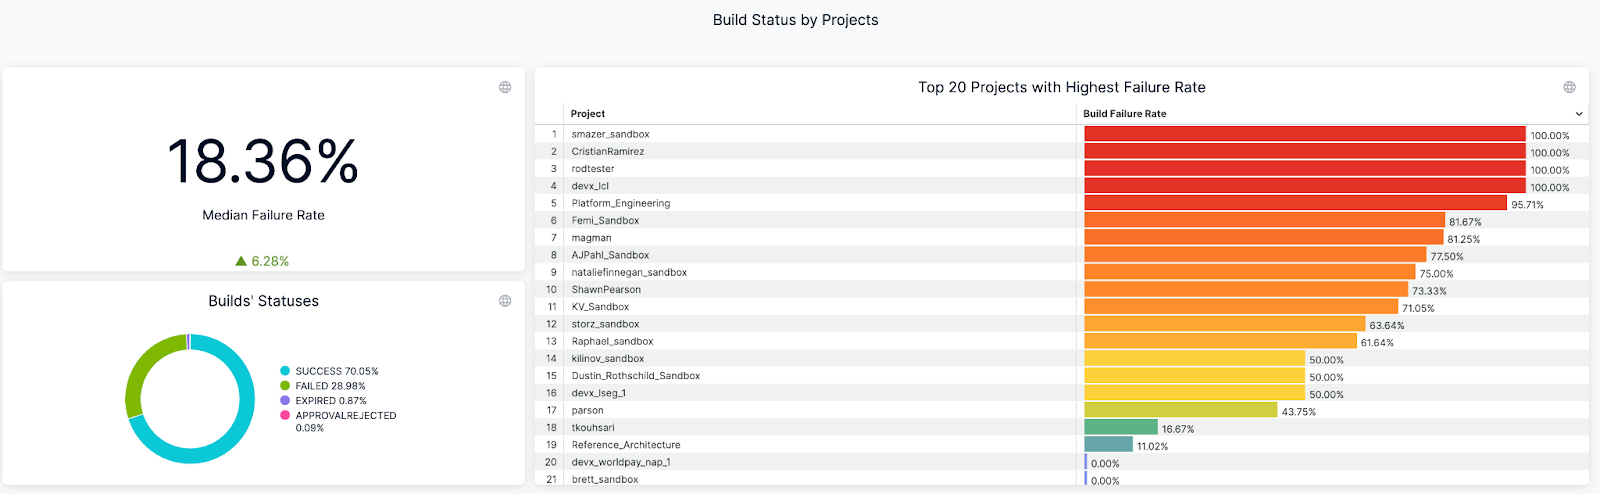
An example of Build Success/Failure Rate Dashboard (on Harness)
- Mean Time to Recovery (MTTR): Speeding Up Incident Response
Mean time to recovery measures how fast your team recovers from failed builds and broken pipelines, directly impacting developer productivity. Research shows organizations with mature CI/CD implementations see MTTR improvements of over 50% through automated detection and rollback mechanisms. When builds fail, developers experience context switching costs, feature delivery slows, and team velocity drops. The best-performing teams recover from incidents in under one hour, while others struggle with multi-hour outages that cascade across multiple teams.
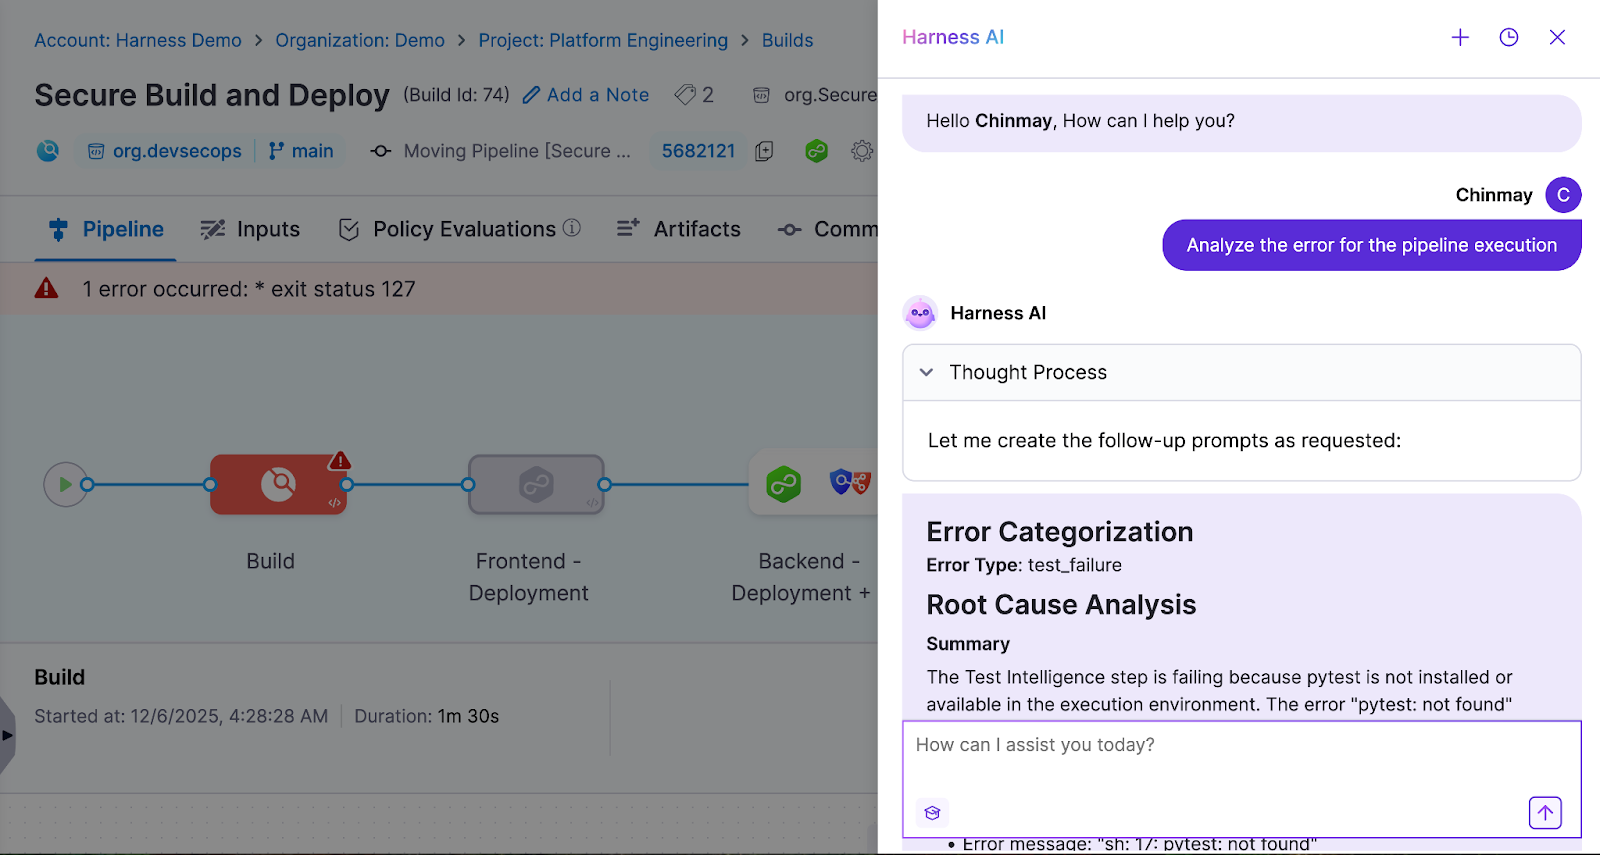
Automated alerts and root cause analysis tools slash recovery time by eliminating manual troubleshooting, reducing MTTR from 20 minutes to under 3 minutes for common failures. Harness CI's AI-powered troubleshooting surfaces failure patterns and provides instant remediation suggestions when builds break.
- Flaky Test Rate: Eliminating Developer Frustration
Flaky tests pass or fail non-deterministically on the same code, creating false signals that undermine developer trust in CI results. Research shows 59% of developers experience flaky tests monthly, weekly, or daily, while 47% of restarted failing builds eventually passed. This creates a cycle where developers waste time investigating false failures, rerunning builds, and questioning legitimate test results.
Tracking flaky test rate helps teams identify which tests exhibit unstable pass/fail behavior, enabling targeted stabilization efforts. Harness CI automatically detects problematic tests through failure rate analysis, quarantines flaky tests to prevent false alarms, and provides visibility into which tests exhibit the highest failure rates. This reduces developer context switching and restores confidence in CI feedback loops.
- Cost Per Build: Controlling CI Infrastructure Spend
Cost per build divides your monthly CI infrastructure spend by the number of successful builds, revealing the true economic impact of your development velocity. CI/CD pipelines consume 15-40% of overall cloud infrastructure budgets, with per-run compute costs ranging from $0.40 to $4.20 depending on application complexity, instance type, region, and duration. This normalized metric helps platform teams compare costs across different services, identify expensive outliers, and justify infrastructure investments with concrete dollar amounts rather than abstract performance gains.
Automated caching and ephemeral infrastructure deliver the biggest cost reductions per build. Intelligent caching automatically stores dependencies and Docker layers. This cuts repeated download and compilation time that drives up compute costs.
Ephemeral build machines eliminate idle resource waste. They spin up fresh instances only when the queue builds, then terminate immediately after completion. Combine these approaches with right-sized compute types to reduce infrastructure costs by 32-43% compared to oversized instances.
- Cache Hit Rate: Accelerating Builds With Smart Caching
Cache hit rate measures what percentage of build tasks can reuse previously cached results instead of rebuilding from scratch. When teams achieve high cache hit rates, they see dramatic build time reductions. Docker builds can drop from five to seven minutes to under 90 seconds with effective layer caching. Smart caching of dependencies like node_modules, Docker layers, and build artifacts creates these improvements by avoiding expensive regeneration of unchanged components.
Harness Build and Cache Intelligence eliminates the manual configuration overhead that traditionally plagues cache management. It handles dependency caching and Docker layer reuse automatically. No complex cache keys or storage management required.
Measure cache effectiveness by comparing clean builds against fully cached runs. Track hit rates over time to justify infrastructure investments and detect performance regressions.
- Test Cycle Time: Optimizing Feedback Loops
Test cycle time measures how long it takes to run your complete test suite from start to finish. This directly impacts developer productivity because longer test cycles mean developers wait longer for feedback on their code changes. When test cycles stretch beyond 10-15 minutes, developers often switch context to other tasks, losing focus and momentum. Recent research shows that optimized test selection can accelerate pipelines by 5.6x while maintaining high failure detection rates.
Smart test selection optimizes these feedback loops by running only tests relevant to code changes. Harness CI Test Intelligence can slash test cycle time by up to 80% using AI to identify which tests actually need to run. This eliminates the waste of running thousands of irrelevant tests while preserving confidence in your CI deployments.
- Pipeline Failure Cause Distribution: Prioritizing Remediation
Categorizing pipeline issues into domains like code problems, infrastructure incidents, and dependency conflicts transforms chaotic build logs into actionable insights. Harness CI's AI-powered troubleshooting provides root cause analysis and remediation suggestions for build failures. This helps platform engineers focus remediation efforts on root causes that impact the most builds rather than chasing one-off incidents.
Visualizing issue distribution reveals whether problems are systemic or isolated events. Organizations using aggregated monitoring can distinguish between infrastructure spikes and persistent issues like flaky tests. Harness CI's analytics surface which pipelines and repositories have the highest failure rates. Platform teams can reduce overall pipeline issues by 20-30%.
- Artifact Integrity Coverage: Securing the Software Supply Chain
Artifact integrity coverage measures the percentage of builds that produce signed, traceable artifacts with complete provenance documentation. This tracks whether each build generates Software Bills of Materials (SBOMs), digital signatures, and documentation proving where artifacts came from. While most organizations sign final software products, fewer than 20% deliver provenance data and only 3% consume SBOMs for dependency management. This makes the metric a leading indicator of supply chain security maturity.
Harness CI automatically generates SBOMs and attestations for every build, ensuring 100% coverage without developer intervention. The platform's SLSA L3 compliance capabilities generate verifiable provenance and sign artifacts using industry-standard frameworks. This eliminates the manual processes and key management challenges that prevent consistent artifact signing across CI pipelines.
Steps to Track CI/CD Metrics and Turn Insights Into Action
Tracking CI metrics effectively requires moving from raw data to measurable improvements. The most successful platform engineering teams build a systematic approach that transforms metrics into velocity gains, cost reductions, and reliable pipelines.
Step 1: Standardize Pipeline Metadata Across Teams
Tag every pipeline with service name, team identifier, repository, and cost center. This standardization creates the foundation for reliable aggregation across your entire CI infrastructure. Without consistent tags, you can't identify which teams drive the highest costs or longest build times.
Implement naming conventions that support automated analysis. Use structured formats like team-service-environment for pipeline names and standardize branch naming patterns. Centralize this metadata using automated tag enforcement to ensure organization-wide visibility.
Step 2: Automate Metric Collection and Visualization
Modern CI platforms eliminate manual metric tracking overhead. Harness CI provides dashboards that automatically surface build success rates, duration trends, and failure patterns in real-time. Teams can also integrate with monitoring stacks like Prometheus and Grafana for live visualization across multiple tools.
Configure threshold-based alerts for build duration spikes or failure rate increases. This shifts you from fixing issues after they happen to preventing them entirely.
Step 3: Analyze Metrics and Identify Optimization Opportunities
Focus on p95 and p99 percentiles rather than averages to identify critical performance outliers. Drill into failure causes and flaky tests to prioritize fixes with maximum developer impact. Categorize pipeline failures by root cause — environment issues, dependency problems, or test instability — then target the most frequent culprits first.
Benchmark cost per build and cache hit rates to uncover infrastructure savings. Optimized caching and build intelligence can reduce build times by 30-40% while cutting cloud expenses.
Step 4: Operationalize Improvements With Governance and Automation
Standardize CI pipelines using centralized templates and policy enforcement to eliminate pipeline sprawl. Store reusable templates in a central repository and require teams to extend from approved templates. This reduces maintenance overhead while ensuring consistent security scanning and artifact signing.
Establish Service Level Objectives (SLOs) for your most impactful metrics: build duration, queue time, and success rate. Set measurable targets like "95% of builds complete within 10 minutes" to drive accountability. Automate remediation wherever possible — auto-retry for transient failures, automated cache invalidation, and intelligent test selection to skip irrelevant tests.
Make Your CI Metrics Work
The difference between successful platform teams and those drowning in dashboards comes down to focus. Elite performers track build duration, queue time, flaky test rates, and cost per build because these metrics directly impact developer productivity and infrastructure spend.
Start with the measurements covered in this guide, establish baselines, and implement governance that prevents pipeline sprawl. Focus on the metrics that reveal bottlenecks, control costs, and maintain reliability — then use that data to optimize continuously.
Ready to transform your CI metrics from vanity to velocity? Experience how Harness CI accelerates builds while cutting infrastructure costs.
Continuous Integration Metrics FAQ
Platform engineering leaders often struggle with knowing which metrics actually move the needle versus creating metric overload. These answers focus on metrics that drive measurable improvements in developer velocity, cost control, and pipeline reliability.
What separates actionable CI metrics from vanity metrics?
Actionable metrics directly connect to developer experience and business outcomes. Build duration affects daily workflow, while deployment frequency impacts feature delivery speed. Vanity metrics look impressive, but don't guide decisions. Focus on measurements that help teams optimize specific bottlenecks rather than general health scores.
Which CI metrics have the biggest impact on developer productivity?
Build duration, queue time, and flaky test rate directly affect how fast developers get feedback. While coverage monitoring dominates current practices, build health and time-to-fix-broken-builds offer the highest productivity gains. Focus on metrics that reduce context switching and waiting.
How do CI metrics help reduce infrastructure costs without sacrificing quality?
Cost per build and cache hit rate reveal optimization opportunities that maintain quality while cutting spend. Intelligent caching and optimized test selection can significantly reduce both build times and infrastructure costs. Running only relevant tests instead of entire suites cuts waste without compromising coverage.
What's the most effective way to start tracking CI metrics across different tools?
Begin with pipeline metadata standardization using consistent tags for service, team, and cost center. Most CI platforms provide basic metrics through built-in dashboards. Start with DORA metrics, then add build-specific measurements as your monitoring matures.
How often should teams review CI metrics and take action?
Daily monitoring of build success rates and queue times enables immediate issue response. Weekly reviews of build duration trends and monthly cost analysis drive strategic improvements. Automated alerts for threshold breaches prevent small problems from becoming productivity killers.

All this author’s posts
Chinmay Gaikwad is an expert on making complex technologies - such as cloud-native solutions, Kubernetes, application security, and CI/CD pipelines - accessible and engaging for both developers and business decision-makers.