AI is writing more of the code. Software delivery, the work between writing code and running it in production, is where most of the day still goes. Building, testing, scanning, deploying, remediating, and operating still require the same, if not more, effort as before AI.
Today, we're introducing Autonomous Worker Agents for software delivery: the platform for enterprises to build and safely run AI agents that handle the work between writing code and shipping it to production.
Autonomous Worker Agents execute as pipeline steps and produce auditable outputs. Their memory is the organization: services, pipelines, deployments, incidents, policies, all connected through the Harness Knowledge Graph, and their capability is powered by the Harness MCP. They operate in production and support the deployment, security, remediation, and validation of your code.
They join Harness Expert Agents, which have been available to customers for some time, to form a complete AI layer across the platform.
Each agent runs as a step inside a Harness pipeline, on customer-controlled infrastructure, with full governance: scoped credentials, OPA policy enforcement, approval gates, and complete audit trails.
Autonomous Worker Agents are invoked as pipeline steps or independently. They inherit the governance Harness pipelines already provide. Instead of trying to teach an AI agent a massive list of corporate rules, the agent operates entirely within the constraints of your existing software delivery pipelines.
Safety is architected in as well. Workloads execute on Harness Delegates, lightweight runtimes installed inside the customer's own Kubernetes cluster or VPC. An agent that "shouldn't be able to merge to main" cannot merge to main, even if its prompt asks it to. The architecture enforces it.
We built RiskSentinel, a Harness Autonomous Worker Agent, to demonstrate that governed AI can move beyond identifying security issues to safely remediate them while maintaining enterprise controls, auditability, and compliance. When building with Harness, what stood out most was how intuitive the experience was — it enabled our team to move from an initial idea to a production-ready agent in just four days, allowing us to focus on solving a real enterprise challenge rather than the underlying platform. That combination of developer experience and enterprise-ready capabilities is what will enable organizations to confidently scale AI across software delivery.
- Ratna Devarapalli, Director IT, United Airlines
Six additional controls make Autonomous Worker Agents production-safe.
Agents are run containerized, with non-root execution (UID 65534, "nobody"). Their filesystem is read-only except for the workspace. Network access is configurable per agent: unrestricted, restricted to allowed MCP servers, or fully disabled.
An agent that produces a malicious bash command has nowhere to send the data.
When a pipeline triggers, Harness mints an ephemeral scoped token. Its scope is the intersection of the agent's permissions and the triggering user's RBAC.
Token deletes on completion. TTL as a failsafe. MongoDB TTL index as final backstop.
OPA policies, the same framework Harness customers use to govern deployments, apply to agents. Policies govern the agent at runtime and during configuration.
Every execution is captured in the Harness Audit Trail. This includes a full provenance chain: who or what triggered the agent, template version, every action taken, and final outcome.
Prompts and reasoning chains are sanitized before persistence: secrets stripped, and PII is stripped.
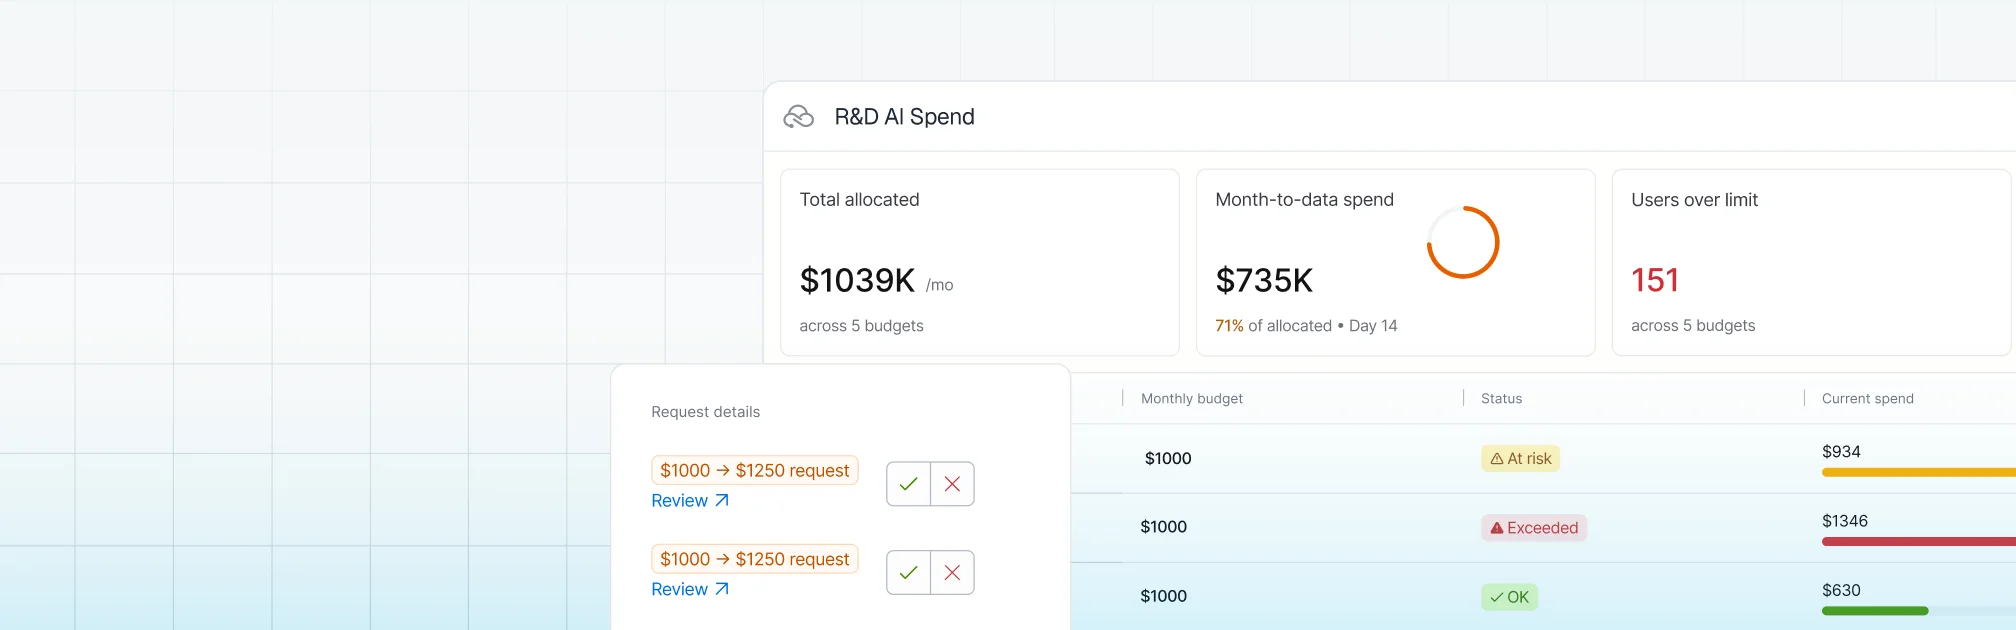
Token consumption and costs are surfaced per execution, per agent, and per pipeline. Running totals are shown live in the step header.
Agents are architected to run within pipelines and can be naturally composed into multi-step workflows.
Output handoff happens via pipeline expressions and shared workspace files.
A Worker Agent is defined in a single file. Here's a complete agent that reviews every pull request for security issues:
agent:
group:
steps:
- name: Run Code Coverage Agent
id: runCodeCoverageAgent
if: <+Always>
run:
container:
image: pkg.harness.io/vrvdt5ius7uwygso8s0bia/harness-agents/harness-ai-agent:latest
env:yam
ANTHROPIC_MODEL: ${{inputs.model_name}}
PLUGIN_HARNESS_CONNECTOR: ${{inputs.llm_connector.id}}
PLUGIN_MAX_TURNS: "150"
PLUGIN_MCP_FORMAT: harness
PLUGIN_MCP_SERVERS: <+connectorInputs.resolveList(<+inputs.mcp_connectors>)>
PLUGIN_TASK: |
Autonomous Harness Code Coverage Agent; no prompts. Resolve branch/repo/clone_url/account/org/project/execution strictly: input -> env -> MCP, never guess; branch must exist via SCM MCP or fail.
Use /harness first, else $HARNESS_WORKSPACE; if repo missing, clone (SCM MCP preferred, git fallback) and checkout resolved branch.
Detect language/test/coverage stack, run baseline coverage (overall + per-file), and target >=90% overall and >=80% per-file.
Add meaningful tests for critical uncovered paths (happy/edge/error/boundary); allow only minimal production testability tweaks.
Re-run full tests + coverage + lint + build; all must pass before continuing.
Review full diff (SCM MCP preferred, git diff fallback); allow only tests + minimal testability tweaks (+ COVERAGE.md only if it already exists; never create it).
Build report with overall before->after, per-file before/after for touched files, and key improvements.
Stage files one-by-one only; never use git add -A or git add .; verify staged diff is clean and in-scope.
Create exactly one commit: "Code coverage: automated test additions by Harness AI"; push plain to origin <branch> (no pull/rebase/merge/force).
If push fails, print rejection, git reset --hard HEAD~1, exit non-zero; never commit unrelated changes, never weaken existing tests, never log secrets.YAML frontmatter on top. Natural language below ---. The same convention Jekyll, Hugo, and AI agent definitions across the industry use.
Save the file, commit it to the repo, and the agent is live, governed, and in the catalog. Every PR triggers it. Every run is audited. Every action is scoped by RBAC. From a blank file to a live governed agent in minutes.
The Harness pipeline engine handles container runtime, scoped credentials, MCP server integration, audit logging, and cost tracking.
The Harness Agent Builder is a simple form for configuring your Agents. Define your prompts in plain English, referencing Harness constructs through common expressions. This experience makes it easy to see what you need to provide and set up your agent in minutes.

All agent definitions are stored in Harness. Their reference in pipelines can be managed in Git. Approval gates apply. Pipeline Branch-based versions let teams test new agent behavior in feature branches before merging to main.
"We built an agent that handles log analysis directly inside Harness. No tool switching, no context loss. The ability to stay on one platform and have the agent surface what's happening and review it for us was the biggest immediate win. We're planning to use it in production."
- Mandy Pearce, Senior Engineer, Cloud Automation, Verint
Using your favorite coding agent, you can connect to Harness over the MCP. The MCP bridges the AI Coding agents’ inner-loop context and the outer-loop context and the constructs in Harness.
Most software delivery workflows have more than one step. Autonomous Worker Agents compose with shell scripts, plugins, approval gates, and other agents to make full pipelines.
pipeline:
stages:
- steps:
- name: Feature Agent
template:
uses: ca_feature_triage_agent@1.0.2
- name: Plan Agent
template:
uses: ca_work_planning_agent@1.0.2
- name: Build Feature Agent
template:
uses: ca_builder_agent@1.0.2uses: references a Worker Agent template by name and version. The agent runs as one step alongside everything else a Harness pipeline can run.
Agent B consumes Agent A's output. The pipeline expression ${{ steps.<agent_id>.output }} carries the result forward.
pipeline:
stages:
- steps:
- name: spec design
parallel:
steps:
- name: Feature Agent
template:
uses: ca_feature_triage_agent@1.0.2
- name: PR Body
template:
uses: pr_body_writer
with:
artifactPath: ${{featureagent.output.artifact}}
issueKey: cds-1234Multiple agents run simultaneously:
parallel:
steps:
- name: Feature Agent
template:
uses: ca_feature_triage_agent@1.0.2
- name: PR Body
template:
uses: pr_body_writer
with:
artifactPath: ${{featureagent.output.artifact}}
issueKey: cds-1234
A Step Group bundles agents and deterministic steps into a single reusable unit:
group:
steps:
- name: feature anaylzer
template:
uses: feature_ingester_agent@1.0.2
- name: work planner
template:
uses: ca_work_planning_agent@1.0.4Save the group as a template. Reference it from any pipeline. The PR Autofix workflow ships as a Step Group template.
An agent runs only when a condition is met:
- steps:
group:
steps:
- name: feature ingest
template:
uses: feature_ingester_agent
- name: work planner
template:
uses: ca_work_planning_agent
name: Spec Driven Development
if: <+OnPipelineSuccess>The same agent runs across multiple targets:
- name: work planner
template:
uses: ca_work_planning_agent
strategy:
fail-fast: true
for:
iterations: 3Approval gates, failure strategies, retry policies, and rollback work the same way they do for any other pipeline step.
The Harness Agent Marketplace is where teams discover, install, fork, customize, and publish Autonomous Worker Agents.
Three publisher tiers anchor it:

With today’s launch, Harness has pre-built agents for the most requested use cases. Here are some examples of what’s currently available:
Reads build logs from a failed PR build, identifies the root cause, commits a fix to the PR branch, re-triggers the build, and repeats until the build passes or the configured max-turns limit is reached.

Analyzes failed Kubernetes deployments. Identifies whether the issue is the manifest, the cluster, or the workload. Fixes manifest issues. Used by teams managing dozens of services across multiple clusters.
Reviews PR diffs across security, quality, and test coverage. Outputs structured findings with severity ratings and concrete remediation. Grounded in the Harness Knowledge Graph, the agent knows which services are production-critical, which have had recent incidents, and which historical anti-patterns have caused outages.

Reads code, config, and flag-system state to identify feature flags that are fully rolled out or fully off. Once it validates removal is safe, the agent generates a cleanup PR. With this agent, the status of your experiments automatically informs you when flags are cleaned up, reducing flag debt and the drudgery of cleaning up old flags.
Reads coverage reports, identifies untested lines, branches, and functions, and generates tests to close gaps. Used when a team has inherited a codebase with weak coverage and needs to lift it before a release.

Fixes configuration drift, security findings, and cloud cost issues by editing infrastructure configurations.
Autonomous Worker Agents are model-agnostic. Connect LLM providers through Harness connectors:
The model can be specified at three levels: in the agent template, at the pipeline step level (overriding the template), or at the account level via environment variable defaults. Switch models per agent, per environment, or per pipeline without changing agent logic.
Three reasons this matters:
Autonomous Worker Agents are available today for all Harness customers. Learn more about Harness Autonomous Worker Agents or request a demo to see them in production.
Visit the in-app Harness Marketplace in app to try out any of the Worker Agents. Add it to your pipeline and watch it run.

Harness has been recognized as a Leader in the 2026 Gartner® Magic Quadrant™ for DevSecOps Platforms for the third consecutive year. Harness was also positioned furthest on the Completeness of Vision axis in the report.
Our Key takeaways:
Harness is the AI platform for engineering, security, and operations teams to build, secure, deploy, govern, and optimize software delivery across the SDLC.
We believe our recognition in the Gartner Magic Quadrant for DevSecOps Platforms reflects the continued evolution of the Harness platform and our commitment to helping teams deliver software faster, safer, and with greater governance across the software delivery lifecycle.
We’re thrilled to share this recognition, which we believe reflects the strength of our product strategy, the breadth of our platform, and our continued investment in helping enterprises modernize software delivery with security, reliability, cost management, and AI built into the development lifecycle.
Today, organizations across industries like United Airlines, Ancestry, and Citi rely on Harness to reduce delivery complexity, improve developer productivity, strengthen governance, and accelerate innovation across increasingly complex software environments.
Software delivery has entered a new era. AI coding assistants are helping teams create software faster than ever, but faster code generation also means more changes, more tests, more vulnerabilities, more deployments, and more incidents for organizations to manage. The next era of DevSecOps will not be defined by who can generate code faster. It will be defined by who can safely convert that speed into reliable business outcomes.
Our view is that the future of DevSecOps is autonomous AI agents, governed and directed by expert engineers. As humans and AI agents both contribute to software change, enterprises will need one connected platform to understand, validate, secure, deploy, observe, optimize, roll back, and prove every change across the software delivery lifecycle.
As a pioneer in modern software delivery, Harness offers over 15 platform products and has built one of the industry’s most comprehensive platforms to support the full spectrum of application development, deployment, security, reliability, feature management, cost management, and operations.
Harness has evolved through a combination of product innovation, internal entrepreneurship, open source investment, and strategic acquisitions. We believe our recognition as furthest on the Completeness of Vision axis in the 2026 Gartner® Magic Quadrant™ for DevSecOps Platforms is proof that Harness is solving problems for our customers in a measurable way.
Over the past year, Harness has continued to expand platform capabilities and AI agents across:
This matters because software delivery is no longer just about building and deploying code. Teams must now manage security risk, release complexity, infrastructure cost, compliance requirements, production reliability, and the growing impact of AI-generated software. The Harness platform allows teams to adopt what they need, when they need it, in one place.
With operations across North America, Europe, APAC, Latin America, and India, Harness serves organizations of all sizes across industries. Customers choose Harness not only for the breadth of the platform but also for the flexibility to adopt individual modules or the full platform based on their needs, maturity, and business priorities.
This recognition in our opinion is a milestone, and we’re proud, but we’re even more excited by the road ahead.
We build security in the software delivery lifecycle natively, not as a separate stage or disconnected toolchain. As AI increases the volume of code, changes, and security findings, enterprises will need platforms that connect detection, prioritization, policy, remediation, deployment, and runtime defense into a single, governed workflow.
Harness is focused on helping enterprises meet that moment. We will continue investing in AI software delivery to help teams move faster without losing control. Our goal is to help every organization deliver software that is faster to build, safer to release, easier to govern, and more resilient in production.
Thank you to our customers, partners, employees, and community for your continued trust. We’re excited about the journey ahead and can’t wait to show you what’s next.
Get a complimentary copy of the 2026 Gartner® Magic Quadrant™ for DevSecOps Platforms.
Or, to talk to someone about Harness, please contact us.
Gartner, Magic Quadrant for DevSecOps Platforms, 2026, Keith Mann, Thomas Murphy, Bill Holz, 15 June 2026
Gartner does not endorse any vendor, product, or service depicted in its research publications and does not advise technology users to select only those vendors with the highest ratings or other designation. Gartner research publications consist of the opinions of Gartner’s research organization and should not be construed as statements of fact. Gartner disclaims all warranties, expressed or implied, with respect to this research, including any warranties of merchantability or fitness for a particular purpose.
GARTNER is a registered trademark and service mark of Gartner, and Magic Quadrant is a registered trademark of Gartner, Inc. and/or its affiliates in the U.S. and internationally, and is used herein with permission. All rights reserved.

TLDR: Today, Harness is introducing the Harness Cursor Plugin, bringing the power of the Harness AI-native software delivery platform directly into Cursor. This integration, along with the Harness Secure AI Coding hook for Cursor, allows developers and AI agents to move from code changes to vulnerability detection, CI/CD execution, security validation, approvals, deployments, and operational insight without leaving the editor.
AI has completely changed how we write code. You can spin up functions, refactor entire files, and generate tests in seconds. The inner loop, writing and iterating on code, has never been faster. But the moment you try to ship that code, everything slows down. This is what we call the AI Velocity Paradox.
You are suddenly back to juggling pipelines, waiting on approvals, checking security scans, debugging failed runs, and bouncing between tools just to get a change into production.
That gap, between fast code and slow delivery, is what we kept running into. So we built something to fix it.
Today, we are introducing the Harness Plugin for Cursor, a way to go from PR to production without leaving your editor.
If you are using agentic coding tools, such as Cursor, you have probably felt this.
You can:
But shipping still depends on everything outside your editor:
And none of that got simpler just because AI showed up. In fact, AI makes the problem more obvious.
Now you can create changes faster than your delivery process can safely handle. And if those controls are not tight, you are introducing a whole new category of risk. Fast-moving code with fragmented governance.
AI did not break software delivery. It exposed how disconnected it already was.
Instead of jumping between tools, what if you could just tell your editor what you want to happen?
Something like:
“Deploy PR #4821 to staging once the security scan passes, and Slack me if anything fails.”
That is the idea behind the Harness Cursor Plugin.
It connects Cursor directly to Harness, so you can trigger and manage your entire delivery workflow using natural language, right inside Cursor.

No tab switching. No manual orchestration. No guessing what is happening in the pipeline.
Once connected, you can use Cursor to interact with your delivery system just as you do with your code.
For example, you can:

This builds on what we introduced last month, Secure AI Coding, which integrates directly with Cursor and scans code at the moment of generation rather than waiting for a PR review. Developers see inline vulnerability warnings with the option to send flagged code back to the agent for remediation, without leaving their workflow. Under the hood, it leverages Harness's Code Property Graph (CPG) to trace data flows across the entire codebase, surfacing complex vulnerabilities that simpler linting tools would miss.
The key thing is that you are no longer just interacting with code. You are interacting with the entire delivery system from the same place.
One of the biggest concerns with AI in delivery is obvious:
“Are we about to let agents push code to production without guardrails?”
No.
With Harness, everything runs through the controls that you can rely on:

Instead of being manual checkpoints spread across tools, they are enforced automatically as part of the workflow while you stay in flow.
So AI can help move things faster, but it cannot bypass the governance that matters.
Most integrations today expose APIs or bolt AI onto existing systems. That is not what we wanted to do.
We designed the Harness Cursor Plugin specifically for how AI agents actually work:
Because shipping software is not a single action. It is a chain of decisions across CI, CD, security, approvals, and operations. If AI is going to help here, it needs access to that full picture. That’s where the Harness Software Delivery Knowledge Graph comes into play. It provides the necessary context for AI to take actions for you.
The knowledge graph models the relationships between services, pipelines, environments, policies, and operational signals in real time. Instead of treating each step in delivery as an isolated task, it creates a connected system of record that AI can reason over. This allows agents to understand not just what to do, but when and why to do it, based on dependencies, risk signals, and historical behavior.

In practice, this means smarter automation: deployments that adapt to context, approvals that are triggered based on policy and impact, and faster root cause analysis because the system already understands how everything is connected.
This is not just about convenience. It is a shift in how software actually moves from idea to production.
Instead of:
You get a single, connected workflow:
All accessible from your editor. Cursor accelerates the building. Harness governs the shipping. And the handoff between the two disappears.
Watch the demo:
If you want to try it:
For example:
“Run the CI pipeline for this branch, check if the security scan passed, and promote to staging if it did.”
That is it.
AI is not just changing how we write code. It is changing expectations for how fast we should be able to ship it. But speed without control does not work in real environments. What we are building toward is something simpler:
A world where every step, from PR to production, is:
Without forcing developers to leave their flow. This plugin is one step in that direction.


What is software release management?
Software release management is the set of practices, tools, and governance that moves code safely from development into production through defined stages (CI/CD, approval gates, progressive deployment, and rollback). DORA 2025 research finds that elite teams recover from failures 24x faster than low performers; release management discipline is the separator.
A software release is a moment. Software release management is the process that leads to it. It spans planning, testing, approvals, deployment, monitoring, and rollback: every controlled step between code and production.
Software release management is the set of practices, tools, and governance that ensures code moves safely from development into production, with clear stages, approval gates, verification checkpoints, and a rollback strategy. The goal is to reduce risk, accelerate delivery, and give teams confidence that they can ship at any time without breaking production.
In practice, release management means your team has a defined process, code does not go to production without approval, you test before release, you can verify that a release is working, and you can roll back quickly if it does not.
Every release follows a path through your release pipeline. The stages differ by organization and risk tolerance, but the pattern is consistent: prepare, validate, approve, deploy, monitor, and be ready to revert.
These terms are often used interchangeably, but they mean different things.
Deployment is a technical action: moving code from one environment to another. You can deploy code to staging, to a canary, to 5% of users, or to your data center. Deployment is infrastructure-driven.
Release is a business decision: making a feature or fix available to end users. You can deploy a feature without releasing it (using feature flags), or release a feature that was deployed days ago. Release is decision-driven.
In practice: you can deploy rapidly, but releases should be deliberate. That is why feature flags and experimentation have become essential software release tools in modern release management: they let you decouple deployment from release, verify before exposure, and roll back without redeploying.
AI coding assistants are accelerating code production. Developers using tools like GitHub Copilot write code 63% faster. That is a win until your release pipeline cannot keep up. According to Harness research, 72% of organizations have experienced at least one production incident from AI-generated code. That is the AI Velocity Paradox: faster code, but the safety gates did not accelerate with it.
The math is simple. If code is produced 2x faster but testing and approval stay the same speed, the queue grows, and either releases slow down or safety checks start to skip. Release management becomes the bottleneck.
Key insight: The solution is not to slow down code production. It's to automate your release gates so they can process more code safely, faster.
Strong release management looks the same everywhere: automation where possible, human judgment where it matters, and speed without recklessness. The right software release platform enforces that discipline.
As AI accelerates code production, teams face a choice: slow down releases to maintain safety, or ship faster and accept higher incident rates. The real problem is that release management is fragmented. Testing happens in one tool, approvals in another, deployment in a third, and monitoring in a fourth. That fragmentation slows everything down and creates the governance gaps that incident postmortems trace back to.
Harness offers a unified software release platform that manages the entire release process: from automated testing through approval gates, deployment strategies, and rollback. It integrates with Continuous Integration so testing happens first, then the Internal Developer Portal for governance and golden paths. The Software Delivery Knowledge Graph ties each release back to the code, the tests, and the business outcome. Feature Management and Experimentation decouples deploy from release. AI SRE monitors and remediates automatically.
Teams consolidate release management onto one governed platform, which reduces cycle time, lowers change failure rates, and gives teams confidence to ship faster. Automation handles the routine gates; teams focus on the decisions that matter. Hundreds of engineering teams trust Harness to govern their release processes at scale.
The evidence shows up in delivery metrics, not just in tooling decisions.
The Warehouse Group, a New Zealand retail enterprise, had a manual release process: approvals were slow, testing was inconsistent, and incidents took hours to roll back. Moving onto Harness CD gave developer squads on-demand deployment with governance enforced through the pipeline. Lead time for changes dropped from 120 hours to 1 hour, a 99% reduction.
“We saw lead time for changes decrease from 120 hours to 1 hour by using Harness as a key part of our path to production. This gain in efficiency is key to supporting our business goals.”
Matt Law, DevOps Chapter Lead, The Warehouse Group
Source: The Warehouse Group reduces change lead time by 99%
Ancestry managed a decentralized release process: each team owned its own pipeline with different standards and approval processes. Consolidating onto Harness let them apply a single pipeline change across all teams instead of editing each instance by hand. The result: 50% fewer deployment-caused outages and a governed release process across all teams.
“Harness now enables Ancestry to implement new features once and automatically extend those across every pipeline, representing an 80-to-1 reduction in developer effort.”
Ken Angell, Principal Architect, Ancestry
Source: Ancestry adds consistency and governance to cut downtime
Software release management is not a bureaucratic layer on top of shipping. It is the mechanism that makes fast, confident shipping possible. As AI tools push more code through your pipeline, the teams that pull ahead are the ones that automated their release gates before the volume arrived.
The components are the same everywhere: a clear release pipeline with defined stages, automated approval gates, feature flags that decouple deploy from release, live monitoring tied to rollback, and DORA metrics that tell you whether it is working. The software release platform you choose determines how much of that you can automate, and how fast you can move when something goes wrong.
Deployment frequency depends on risk tolerance and product type. Many successful teams release multiple times per day; others release weekly. The key is that you can release confidently at your chosen cadence without increasing incident rates. DORA metrics are the benchmark: elite teams deploy on-demand.
A release manager owns the release process: planning, approval gates, communication, and rollback decisions. A DevOps engineer builds the infrastructure that makes releases automated and safe. Both roles are essential, though in many teams the responsibilities overlap and are handled by the same person.
Feature flags let you deploy code without releasing it. You can deploy a new feature to production but keep it switched off, then turn it on gradually (to 1% of users, then 10%, then everyone). If something breaks, you switch it off without redeployment needed. This separates deploy risk from release risk.
That is what rollback is for. If errors spike or users report problems, you should be able to revert to the previous version in seconds. This is why fast rollback is a non-negotiable best practice, and why automated continuous verification (which catches problems before they reach users) is equally important.
Automate everything you can: testing, approval gates, deployment verification. Reserve human judgment for the decisions that matter. Automation handles the routine; humans focus on strategy. Teams that automate their release gates first are the ones that can safely absorb faster code production from AI coding tools.
A release pipeline is the end-to-end flow from code merge to production, including approval gates, deployment strategies, and rollback. A CI/CD pipeline is the build-and-deploy automation inside that flow. The release pipeline is broader: it includes the governance, verification, and rollback layers that CI/CD alone does not cover.


Here is a story platform engineering teams know by heart: developers find a shiny new tool, start building at a breakneck pace, and before you know it, the organization is drowning in a massive wave of unmanaged components.
Right now, that exact story is playing out with generative AI.
Developers are spinning up prompts, skills, agents, plugins, and custom commands faster than anyone can keep track. They are forking them, tweaking them, and quietly dropping them across dozens of scattered repositories. Sure, some of them work. But many of them carry real operational and compliance risks. And almost none of them can be found by the next engineer who needs the exact same thing. So everyone starts from scratch which leads to redundancy, wasted effort, and unnecessary complexity.
The reality is that we are looking at a classic case of sprawl, just with a fresh coat of AI paint.
That is exactly why we built the AI Asset Catalog in Harness IDP. We have spent the last few months baking these capabilities directly into our internal developer portal catalog, elevating AI Assets to a first-class entity right next to your standard components, APIs, and environments.
There is an understandable temptation to treat AI components like they are some kind of alien technology that requires a completely bespoke tooling stack. I would argue the exact opposite.
The fundamental reasons a software catalog exists do not change just because a component uses a large language model. You still need to answer three basic questions: What do we have? Who owns it? Is it safe to use? Those core questions apply to an AI skill or an autonomous agent just as cleanly as they do to a traditional microservice.
By placing AI assets inside the same developer portal your teams already use, they automatically inherit your existing software governance model. You do not have to stand up, secure, and maintain a separate control plane. Because the AI Asset Catalog runs natively on the Harness platform, your AI components are instantly scoped by your granular role-based access control, and changes are logged in your immutable audit trails.
This unified control plane becomes incredibly important as autonomous agents start acting on your production systems. Through the Harness MCP Server, external coding assistants can already safely discover ownership and platform standards directly from your catalog. The AI Asset Catalog simply extends that exact same auditable model to the very building blocks those agents are built from.
The AI Asset Catalog automatically indexes, maps, and scores your internal AI components to make them instantly discoverable. We focused on four core capabilities to keep things simple and highly scannable:

Manual cataloging is where good ideas go to die because nobody has the spare cycles to keep documentation current. That is why discovery is entirely driven from where your engineers actually live: source control.
With a simple toggle via our GitHub integrations, Harness automatically ingests, de-duplicates, and maps AI assets straight from your repositories. There is no manual upload step and no parallel registry to baby-sit. When an asset changes in Git, the catalog updates in lockstep.
Simply indexing a text file is not the same as actually understanding its purpose. Harness AI reads and parses the artifacts that describe your assets, including instruction files, agent.md profiles, and READMEs, to interpret exactly what a component does.
This deep parsing powers an intuitive natural language search. Instead of playing keyword guessing games, a developer can type a plain question like, "Is there an approved skill to analyze my codebase?" The portal instantly surfaces verified items along with cleanly formatted execution constraints, meaning teams can understand the intent and health of an asset before they ever decide to consume it.

Modern AI architectures are highly compositional. A single plugin bundles multiple skills, an agent triggers specific commands, and a command relies on a highly tuned prompt. When those invisible links break, debugging turns into an absolute nightmare.
The catalog visually charts these parent-child relationships automatically. It maps precisely how prompts and skills roll up into specific plugins, while enforcing explicit team ownership. When an asset misbehaves, you do not waste hours on a wild goose chase; you immediately know the exact blast radius and the exact team to page, slashing triage and support times.

Enabling developer reuse is fantastic, but it is only safe if you can separate reliable, compliant assets from experimental code. Scorecards bring our established software maturity and governance patterns straight to the AI playground.
Our out-of-the-box checks evaluate every single AI asset against essential dimensions: structural integrity, risk maturity, confidence levels, popularity, and data classification compliance. Out-of-policy components are flagged proactively, stopping compliance violations before they escape into production environments. Because these scorecards hook into our broader platform reporting, engineering leaders get a true company-wide view of AI maturity without a separate reporting headache.
The value of a centralized AI catalog looks a bit different depending on your day-to-day role:
The AI Asset Catalog is not just a shiny standalone tool. It is a foundational part of our goal to make Harness IDP the definitive control plane for both human developers and autonomous AI agents.
Google's DORA research regularly reminds us that while AI code generation tools are making coding faster, actual software delivery throughput remains stubbornly flat because teams get bogged down in downstream execution, testing, and security bottlenecks. Only about 30% of engineering time is spent actually writing code. We want to fix that chokepoint across the entire lifecycle.
Simply put, the catalog handles the question of what assets you have and whether they are safe to use. Our Knowledge Agent assists engineers by executing complex workflows, and our MCP Server grounds external LLMs in your internal architecture and governance standards. Underneath it all sits the exact same secure, auditable platform you already trust to ship code safely every single day.
If you are already running Harness IDP, getting started is incredibly straightforward. You just plug in your existing GitHub or Bitbucket repositories, turn on automated discovery, and watch the catalog map out your AI ecosystem. From there, you can roll out scorecards, assign clear team ownership, and let your developers innovate with total confidence.
No manual step is required. It ingests directly from source control (GitHub/Bitbucket) and stays in sync automatically as Git repos change.
Prompts, skills, agents, plugins, and custom commands, including their parent-child relationships (e.g., which skills roll up into which plugins).
Through automated scorecards that check structural integrity, risk maturity, confidence, popularity, and data classification, flagging out-of-policy assets before they reach production.
No, it inherits the existing Harness platform's RBAC, Open Policy Agent policy layer, and audit trails, so there's no new control plane to stand up.
They're complementary: the catalog answers "what assets exist and are they safe," the Knowledge Agent executes workflows, and the MCP Server grounds external LLMs/coding assistants in your internal architecture and standards.
.png)
.png)
Teams building agents have converged on something that looks a lot like the software development lifecycle, but reshaped around a system whose output isn't deterministic: prototype an agent against a framework, evaluate it against a dataset of expected behavior, deploy it somewhere real, observe how it behaves against live traffic, and feed what you learn back into the next prototype. Call it the agent development lifecycle (Agent DLC).
Most of that lifecycle borrows tooling that already existed - a framework like LangGraph or Google's ADK for the prototyping stage, an eval platform for the evaluation stage. This post is about one stage of that lifecycle: deployment, and the decisions behind how we help users deploy their agents reliably with Harness Continuous Delivery.

Because deployment is when an agent shifts from being safely under test to being exposed to production, decision-making and safety are critical. Organizations need to ensure that only good versions of agents are actually released, policies are adhered to, and a dependable audit trail is created.
Further complicating agent deployments is the fact that agents rarely stand alone and are often updated alongside changes to data, configuration, front ends, and companion services. Deploying an agent is not enough. We have to orchestrate its changes with everything else in a release.
This article covers how agent deployments are different, how to govern them, and what release orchestration with agents looks like. In short, how to make agent deployments both safe and easy.
Something genuinely new shows up in the deployment stage of the Agent DLC. Rather than packaging an agent as a generic container and hosting it the way any other service gets hosted, AWS and Google both shipped purpose-built, managed runtimes for agents specifically - Bedrock AgentCore and GCP Agent Runtime.
Unlike a general compute product with an agent tutorial bolted on, these runtimes are shaped around what an agent actually needs - session and memory primitives, identity scoped to the agent rather than the pod, versioned "runtime revisions" instead of arbitrary deploys.
That's the piece that benefits from dedicated automation support. It's worth spending a minute on what changes when the target is one of these runtimes instead of a Kubernetes cluster, before getting into what we actually decided. The shift to managed runtimes means teams either build this operational muscle themselves or get it from a platform.
None of this is an argument that Kubernetes is the wrong place to run an agent - plenty of teams will keep doing exactly that, and it's on our roadmap as a deployment target for this same agent-service model. It's a genuinely different set of trade-offs, not a strictly better or worse one.
This operational surface (session stores, readiness probes, traffic routing) is exactly what a native runtime (and what Harness's deployment step) absorbs for the team. The first two rows are the reason a native runtime exists at all - session and memory management is genuinely hard to get right underneath an agent, and both clouds decided it was worth building once, centrally, rather than leaving every team to rebuild it next to their pod.
The rows below that are the downstream consequence: once the platform owns session, memory, and isolation, it ends up owning versioning and traffic control too, because those all have to agree with each other underneath.
The trade Kubernetes gives up in exchange for that control is exactly the operational surface a native runtime absorbs for you: you're not sizing replica counts, standing up your own state store, or writing readiness probes for something whose "readiness" is closer to a language-model call than a TCP health check. Whether that trade is worth it depends entirely on how much of that control a given team actually wants to keep exercising, which is the real reason we're not treating native runtimes as the only supported target going forward.
Let's take an example of an Academic Research Agent - a LangGraph agent that searches academic papers and journals, synthesizes findings across sources, and drafts a literature-review section for a researcher to approve. It's been working in a notebook. Getting it live means three things: register it as a service, define where it runs, and put a pipeline in front of it that can promote it safely.
Does a customer think about their Academic Research Agent as one thing, or as two different things depending on which cloud it happens to run on? We bet on one thing. An agent's name, its config and secrets, its purpose - those don't change depending on where it's deployed. This eliminates the need to maintain multiple deploy scripts for what is functionally one agent.
What changes is the shape of the cloud underneath it: the image reference and agent framework on Google's side, the execution role on AWS's. So the service definition keeps a single outer identity with the cloud-specific pieces contained inside it, rather than asking someone to maintain what is functionally the same agent as two separate service definitions.

We know this model works well. Our existing Kubernetes deployment type has separate infrastructure kinds per cloud (GCP, Azure, direct) underneath a single deployment type. What's different here is applying that same idea one layer higher, at the service itself, because what defines an agent - its name, purpose, and configuration - doesn't change across clouds, even though the infrastructure underneath it does get changed.

We have registered our Academic Research Agent as an Agent Service on Harness. Now, the question is about the target platform configuration, which involves defining your infrastructure.
The infrastructure definition is where the cloud-specific configuration lives. For the Academic Research Agent on AWS AgentCore, that means:

The Gateway is the one worth pausing on. It isn't automatically part of an AgentCore deployment - it's additional infrastructure the team provisions up front, specifically so traffic shifting has something to act on. If the Academic Research Agent's infrastructure skips it, deployments still work; every promotion is just a direct cutover instead of a gradual one, because there's nothing underneath to hold a partial split.
If the target is Google's Agent Runtime, the infrastructure definition asks for less than AWS's, because traffic shifting doesn't need a separate resource to act on; it's native to how GCP serves revisions.

For the Academic Research Agent here, that means:

Underneath, the two clouds don't agree on how traffic splitting actually works. On Google's runtime, a percentage split is native to how revisions are served - the platform already speaks in those terms. AWS has no equivalent primitive on the runtime itself, which is why the Academic Research Agent's pipeline needs that Gateway from the infrastructure section: our traffic-shift step reads the gateway rule's current routing action and rewrites it, switching between a direct route and a weighted split depending on whether the requested split is a clean cutover or a partial one. Two different cloud mechanics, one authored concept on our side - a target revision and a percentage, so the pipeline for the Academic Research Agent reads the same shape it would if it were deployed to Google instead.

Rolling back the Academic Research Agent never creates anything new. It re-points traffic - or, without a Gateway configured, flips the runtime endpoint directly - back to whatever was live before. That target resolves automatically from what the deploy step actually did; nobody authors it by hand.

The rollback step automatically resolves its target to what the deploy step produced.
Key thing to note: Multiple agents can now be deployed together, along with other backend services, in a release.
Everything so far has been about one agent. In practice, it's never just one - the Academic Research Agent ships, and a few months later, the same research org builds a Grants Compliance Agent, owned by a different team, and to save on infrastructure, the two agree to share the same AWS AgentCore Gateway for traffic shifting. That's a completely reasonable thing to do, and it's exactly the point where governance stops being optional: a careless traffic-shift call from one agent's pipeline shouldn't be able to touch the other's routing rule, and "who deployed what, to which backend, and when" needs one answer across every agent, not a different answer per team.
We didn't build a separate governance layer for agents. An Agent Service and its infrastructure definition are first-class Harness resources, so the same three mechanisms that already govern every other deployment type apply here without modification:
RBAC: Registering an Agent Service, editing its infrastructure, triggering a deploy or rollback - scoped the same way as any other service and environment in Harness. Two agents can share a Gateway while sitting in different projects with different owners, because RBAC lives at the Harness resource level, not the cloud API level, where a shared Gateway would otherwise blur that line.
Policy as Code: Every AI Agent pipeline execution is a plan that Harness can evaluate against OPA policies before it runs, the same as any other deployment type. That's what actually protects a shared Gateway - a policy can require a traffic-shift step only to touch rules the deploying agent owns, block an overly-permissive execution role, or enforce a minimum instance count before a full cutover. Same policy engine, pointed at a new deployment type.
Approvals and audit trail: Production promotions carry the same approval step regardless of cloud target. Every deploy, shift, and rollback across every agent lands in one execution history - so "what changed on the shared Gateway, and who approved it" has one answer, not one per team.
We reused the existing model instead of deferring it, so a team's first agent and their fiftieth are governed the same way - nothing to retrofit once there's more than one.
This phase covers deployment. Two extensions are already on the roadmap.
Kubernetes as a third, agent aware deployment target: Alongside Google’s Agent Runtime and Amazon Bedrock AgentCore, we plan to let you deploy the Academic Research Agent directly to your own Kubernetes cluster - define an Agent Service with Kubernetes as the target, create a Kubernetes infrastructure definition, and get the same progressive-delivery shape through deployment strategies like canary and blue-green, rather than a separate set of primitives built just for agents.
Evaluation gates and observability, wired into the same pipeline: The outcome this phase already produces - a revision, an endpoint, a traffic state - is exactly what the next phase needs as input: a quality gate before promoting the Academic Research Agent, a validation check after, and visibility into how it's actually behaving in production. That's next on the roadmap, using eval provider connectors - Harness AI Evals, Braintrust, LangSmith, Arize, Langfuse, and others as the ecosystem grows.
A: Agent Deployments is a capability in Harness Continuous Delivery that brings tested, out-of-the-box pipeline steps to deploying AI agents. Instead of scripting a deploy by hand, teams register their agent as a first-class Harness service and get governed, repeatable releases.
A: Register the agent as an Agent Service in Harness, define an AWS AgentCore infrastructure target (region, VPC/security groups, and optionally an AgentCore Gateway if you need traffic shifting), then run it through a Harness CD pipeline, which handles packaging, deployment, and — if a Gateway is configured — progressive traffic rollout.
A: Same model as Bedrock, with a lighter infrastructure definition — a connector, project, and region, plus an optional private networking mode. Traffic shifting doesn't need a separate resource the way AgentCore does, because Google Agent Runtime natively supports revision-based traffic splitting.
A: Yes. However, as of the writing of this blog, agent-specific support has not been added for Kubernetes, and the deployment is treated as a standard K8s artifact. We intend to add agent-aware Kubernetes support in the near future.
A: Managed runtimes (Bedrock AgentCore, Google Agent Runtime) handle session/memory management and per-session execution isolation natively — something you'd otherwise have to stand up yourself on Kubernetes (a Redis store, custom readiness probes, etc.). It's a genuine tradeoff, not a strictly better option: Kubernetes gives you more control over that operational surface; the managed runtimes take that control away from you in exchange for not having to build it.
A: Harness supports progressive traffic shifting for agents — a target revision plus a percentage split, authored the same way regardless of which cloud you're deploying to, even though the two clouds implement traffic splitting differently under the hood (native revision-split on Google's side, a Gateway routing rule on AWS's).
A: Rollback re-points traffic to whichever revision was live before, rather than creating a new one — the rollback target resolves automatically from what the deploy step produced, so nobody has to author it by hand.
A: Yes. An Agent Service and its infrastructure are ordinary Harness resources, so RBAC, OPA policy-as-code, and audit trails apply without any separate configuration for agents. This is also what lets two teams safely share underlying infrastructure (like an AgentCore Gateway) without one team's deploy affecting the other's.
A: All major agent development frameworks eg. CrewAI, LangGraph, Agents SDK, ADK and custom frameworks as well.


AI agents fail differently from the software we spent the last two decades learning to monitor. We hear some version of the same story from teams shipping agents to production: an agent starts producing wrong answers. Not obviously broken: confident, well-formatted, plausible wrong. The logs are clean, latency looks healthy, and error rates sit at zero. Nothing flags a problem. A user eventually does.
None of the standard tooling was built to catch this. Our observability stack assumes misbehaving software leaves evidence: an exception, a timeout, a bad status code. Agents break that assumption: a hallucination returns HTTP 200, and a run that took fourteen needless tool calls looks identical to a clean one. A wave of LLM-observability tools has grown up to help, but almost all of it stops at observing, it shows you what the agent did, not whether it was any good, and they can't step in while a run is going wrong.
Closing that gap is the idea behind AgentTrace. It isn't a product you adopt; it's the framework Harness uses internally to observe, evaluate, and govern the AI agents across our own platform. It runs as a single pipeline: collect, filter, evaluate, act, so the system doesn't just record what an agent did; it can score whether the work was any good and intervene when it isn't. Today, we're describing how the framework works, and open-sourcing the two layers any team can run on their own stack — harness-sdk and harness-evals, under Apache 2.0.
Harness AgentTrace is a framework used by Harness to observe, evaluate, and govern AI agents by connecting production monitoring with evaluation metrics. It functions by allowing production failures to be converted into regression test cases, effectively closing the loop between identifying agent errors and preventing them in future releases.
The three gaps make plain tracing insufficient for agents.
1. It doesn't score quality. A distributed trace tells you an LLM call took 340ms and returned 200. It can't tell you whether the response was grounded in the context provided, whether the agent chose the right tools in the right order, or whether a correct answer came through a fragile path that breaks on the next input. Quality is invisible to timing and status codes.
2. The unit of work isn't a request. A microservice trace ends when the request returns. An agent only makes sense across two levels: a run — every model call, tool call, and state transition in a single execution — and a session — every run in one user interaction, so you can see behavior evolve or degrade across turns. Traditional tracing gives you neither.
3. Observing is passive. Even when tracing surfaces a bad run, it can only tell you after the fact. It has no way to intervene — to block a runaway tool call, cap a request about to blow a budget, or redirect a prompt headed somewhere it shouldn't. Watching and acting are different jobs, and agents in production need both.
So the requirement isn't “better tracing.” It's a framework that observes, judges, and acts — and connects them, so what you learn from one run shapes the next. That's what AgentTrace is.
AgentTrace is one pipeline of four stages, deployed across three tiers, connected by two planes. Start with the whole picture:

AgentTrace can run as a standalone Gateway or as a worker inside your existing gateway. Telemetry flows up as OTLP; config and policy are pulled back down — no redeploy.
The pipeline is the same everywhere it runs:

One principle holds throughout: evals detect, actions enforce. Neither does both — an eval emits a decision, an action responds to it. That separation is what keeps the framework composable.
Because Filter, Eval, and Act can run in-process, the framework does what passive tracing can't: redact PII before a span ever leaves the process, warn when a trajectory starts looping, or block a tool call that breaches policy — while the run is still happening. Much of AgentTrace's value at the client tier is exactly this: guardrails that act on the live run, not dashboards you read afterward.
A note on the word “eval,” because it does double duty. In the runtime pipeline above, an eval is an in-flight guardrail that watches a live run. In harness-evals (below), an eval is an offline quality score you run in CI or against stored traces. Same idea — judge the agent — at two speeds: one guards the run in progress, the other grades runs after the fact and gates releases.
The same pipeline runs at three tiers, each with a different data window and latency budget: client-side, in the agent runtime, for guardrails that can't afford a network hop; on a platform agent, an inline intermediary that handles cross-agent concerns like budgets and rate limits (more on this below); and server-side, in the Harness platform, for aggregate patterns no single client can see — cross-session anomalies, account cost trends, fleet-wide degradation.
Two planes connect the tiers, and keeping them separate is deliberate. The data path is pure OpenTelemetry: telemetry flows up via OTLP, which means a customer running only stock OTel SDKs — no Harness client code — still gets server-side collection, storage, and evals. The control path flows down: dynamic configuration and server-side eval decisions, with no client redeployment. Data flows up, decisions flow down, and the two never share a transport.

One capability the framework unlocks is worth calling out on its own, because it's what most teams are trying to build by hand.

A run lands in analytics within seconds. When a user reports a problem, an engineer pulls the exact run and sees, span by span, where it went wrong — the real execution record, not a sampled approximation. The natural next move is to flag it and move on. On the Harness platform, a different move is one click away: Export to Dataset. A production run that revealed a failure — a hallucination, a wrong tool selection, an inefficient path — is promoted into a golden evaluation case, with its input/output pair extracted and retrieved context preserved.
That one action closes a loop most teams close by hand: a production failure becomes an evaluation case, the case joins your eval suite, the suite gates the next release in CI, the next release is observed in production, and the next failure feeds the suite again. If your CI suite only contains failures you thought to write in advance, it will always lag production. Export to Dataset means every failure you investigate becomes a permanent regression gate — over time the suite reflects what actually breaks, not what someone imagined might.
None of this is a novel idea — it's what good teams already do with error reporting and regression tests. The gap was that nothing connected the agent observability layer to the eval layer with a shared data model. AgentTrace makes them one system with one run identity running through both.
Two layers of the framework are available today under Apache 2.0 — the two you need to run this yourself, on any stack, against any backend.
harness-sdk (harness/otel-python-sdk) is the collection runtime. The Python SDK auto-instruments OpenAI, Anthropic, and LiteLLM with no code changes — wrap your process with a CLI command (harness-instrument python app.py) and set an environment variable. Output is standard OTLP, so it works with any OTel-compatible backend. Every instrumented run produces a tree of typed spans — LLM calls, tool invocations, retrieval, orchestration — with token counts, latency, cost, and model attribution. It's more than collection: a plugin model adds filter hooks (SpanProcessors) and control hooks that can block, so Collect, Filter, and Act all live here. Node.js, Go, and Java packages are in active development; those teams can export via Langtrace or any OTel SDK today.
harness-evals (harness/harness-evals) is the evaluation layer — our opinion, in code, on how agent quality should be scored: correctness, groundedness, safety, trajectory, and performance, each a transparent 0.0–1.0 metric with an explicit threshold and pass/fail. It gates CI through exit codes, absolute score floors, and baseline regression checks; plugs into pytest; reads production traces back in via OTEL and Langfuse importers; and complements DeepEval and RAGAS by adding trajectory, MCP tool-evaluation, and reliability metrics. The opinionated design choices — why trajectory is a first-class dimension, why safety never averages into a composite score — are documented in the repo.
Together they are the loop in two packages: harness-sdk captures the run, harness-evals scores it, and a shared run identity ties a production failure to the test case it becomes and the CI result that gates the next deploy.
The client SDK sees one agent process. Some guardrails are inherently cross-agent — budget caps that span teams, rate limits across sessions, model routing, spend that must survive a restart — and none can live in-process. They belong on the platform-agent tier: the same Collect → Filter → Eval → Act pipeline, but inline on the network path between your agents and their LLM providers. This is the part we're actively building; the design is settled enough to describe.
It splits into two roles — a platform agent that intercepts and enforces, and the AgentTrace Gateway, a decision service that evaluates — because the component that decides shouldn't be the one that acts. On each outbound LLM call, the platform agent intercepts the request (synchronous or streaming), hands its context to the Gateway synchronously on a tight budget (a <10 ms target, to keep first-token latency negligible), and the Gateway returns one decision: allow, block, route to a different model, or warn. The platform agent enforces it and records a span up the same OTLP data path.

Two properties make this worth the complexity. It covers agents that never adopted the SDK: because enforcement is on the network path, any agent whose calls route through the platform agent gets observability and cost/rate enforcement with zero code changes — add the SDK later for in-process guardrails on top. And it fails open: if the Gateway is unreachable, traffic passes straight through with an annotated span rather than blocking. It starts narrow — routing, cost, and rate limiting first — with content-aware guardrails like PII and prompt-injection detection layered on as it matures.
We're not the first team to build LLM observability, and we won't be the last — LangSmith, Langfuse, Helicone, and others have been at parts of this longer than we have. What's different is that AgentTrace doesn't stop at observing. It scores quality and it acts: in-process guardrails on a live run, enforcement at the edge, and a loop where a production failure becomes the test that gates the next release — observability, evaluation, and guardrails on one data model instead of three tools you wire together yourself.
We're open-sourcing the runtime and the evaluation layer because a way of measuring agent quality only becomes a shared standard if anyone can run it — you can't build a common vocabulary for agent quality when the only people who can use your metrics are your customers. The foundational layers are open. Any team, any stack, any backend.
harness-sdk and harness-evals are on PyPI under Apache 2.0:
pip install harness-sdk
pip install harness-evals
With extras for LLM auto-instrumentation and OTLP export:
pip install "harness-sdk[anthropic,openai,litellm]"
pip install "harness-evals[llm,otlp]"
If you're shipping agents and don't have a good answer to “how do we know this is working in production,” start there: harness-evals in your CI pipeline and harness-sdk sending traces to any OTel backend gives you eval gating and production visibility without touching the Harness platform. If you're already on Harness, the platform wires the two together and adds the Trace Viewer, run and session views, human annotation, Export to Dataset, analytics, and CI pipeline gating on top, the full loop, managed.
The docs cover the parts we got right. We'll be honest about the parts we got wrong and we expect to find some.
Most tools stop at observing — showing what an agent did. AgentTrace also scores whether the work was good (via evals) and can intervene in real time (via guardrails/actions), unifying observability, evaluation, and enforcement on one data model instead of three separate tools.
harness-sdk (collection/instrumentation) and harness-evals (offline quality scoring) are open-sourced under Apache 2.0 and work standalone. The Harness platform adds the Trace Viewer, run/session views, human annotation, Export to Dataset, analytics, and CI gating on top — the "full loop, managed."
For harness-sdk, no, it auto-instruments OpenAI, Anthropic, and LiteLLM by wrapping your process with a CLI command and setting an environment variable. For agents that never adopt the SDK, the upcoming platform-agent tier can still enforce guardrails at the network level with zero code changes.
A run is every model/tool call in a single execution; a session is every run in one user interaction. "Eval" means two things at two speeds: an in-flight guardrail watching a live run (runtime pipeline) versus an offline quality score run in CI or against stored traces (harness-evals).
No, it fails to open. If the Gateway is unreachable, traffic passes straight through with an annotated span rather than blocking, so enforcement issues don't create an availability outage.


At Harness, we're building software delivery agents across our platform. Getting to a working prototype was fast, in many cases, in a weekend. But building an agent that performs at production-grade, enterprise-scale was a different problem entirely. And getting to a point where we could actually trust that agents would work for our customers the way we expected every time was harder than anything else.
We shipped them to production. And we learned something that every team that builds agents eventually learns.
As we dug into why this is so much harder than traditional software, we kept hitting the same five walls.
Failures are silent. When traditional software fails, it crashes. You get an error code, a stack trace, and a log entry. When an agent fails, nothing crashes. It returns a confident, plausible, completely wrong answer. No alert fires.
Output is non-deterministic. Traditional software gives you the same output for the same input. Agents don't. Run the same prompt twice, get different results. You can't write assertEqual for a summarization agent.
There's no debug mode. Stack traces tell you exactly why traditional code broke. With agents, you can't trace why it chose one answer over another. The reasoning is opaque. The decision path is invisible.
Quality is a spectrum, not a binary. Traditional tests either pass or fail. Agent quality is: Did it complete the task? Is the tone professional? Is it faithful to the source? Is it relevant? Is it safe? There is no single "pass."
Maintenance is a moving target. Traditional software: fix the code, ship the patch. Agents: the model drifts, the prompts change, the context window shifts, and the LLM version upgrades silently. A fix today can break tomorrow without anyone touching the code.
Your DORA metrics don't measure agent faithfulness. Your test suites pass while quality silently degrades. And your team has no way to A/B test prompts or swap models without shipping blind.
Harness AI Evals makes core agent quality measurable, enabling agent-aware quality gates in your CI/CD pipelines. With AI Evals, changes to your agent (or underlying model) are evaluated first against your standard data sets and model outputs. The output is evaluated across many dimensions, including correctness, performance, and safety. Teams can then use the scores as quality gates in their CD pipelines to simplify release decisions. Then, production data can be fed back in, improving your testing based on real inputs.

Run your agents against golden datasets before they ship. A golden dataset is a curated set of test cases - inputs your agent will receive, paired with the expected outputs or context it should use to respond. Think of it as your ground truth: the known-good answers your agent should produce or stay faithful to.
Score every response using 50+ built-in metrics. For example:
Is the response grounded in the retrieved context (faithfulness)?
Did the agent call the right tools with the right arguments (tool correctness)?
Is the output safe from prompt injection? Did it complete the task?
Is the tone appropriate?

You can also define custom rubrics in natural language or write your own scoring logic in Python.
Compare prompt variants and model versions side by side. Gate your release pipeline: if scores drop below the threshold, the deploy is blocked. Not a script. A native Harness pipeline step.
Offline evaluation is just the beginning. It helps you test the agent before you ship, preferably as part of a CI/CD pipeline.

Online evaluation takes it further. It scores the output of your agent against real scenarios coming from your customers, using the same metrics. Instead of getting scores for synthetic data you generated in a dataset, you're scoring how the agent actually behaved against real user inputs. That's how you learn how your agent operates in real life.
And then you can add those real scenarios back into your datasets, so you can use them in subsequent offline evaluations. You're continuously enriching the datasets, ensuring that as you progress with development, the output improves and definitely doesn't regress.
Here's a walkthrough of how it works:
Our first round of manual testing took one to two weeks every release cycle. Now I've put AI Evals in as a release gate. Whenever there's a deployment, it evaluates whether anything broke. What took days takes minutes. The sign-off isn't someone opening a sheet of 500 cases anymore. It's based on the pass rate. Score above threshold? Ship it. Below? It doesn't go out.
- Chetan Sinha, Software Engineer, Harness QPE Team
AI Evals inherits the full Harness platform:
Getting started is designed to be fast. A guided onboarding flow walks you through setup. In-built templates for common patterns (prompt injection detection, correctness checks, RAG quality) let you plug and play without writing scoring logic from scratch. And you can synthesize entire datasets from a single description using AI, so you're not hand-writing hundreds of test cases to get started.
Harness AI Evals is the first native quality gate for AI in CI/CD. Score your agents before deploy, monitor them after, and ship with confidence every release.
Request to start the beta!(/demo/ai-evals)
Those tools connect your evals to observability, you export traces, run evaluations separately, and interpret the results outside your pipeline. AI Evals runs as a native step in your Harness pipeline, right alongside Build, Test, and Deploy. A quality regression fails the build the same way a failed unit test does. No scripts to wire in, no glue code to maintain.
No. Offline evaluation (pre-deploy) and online evaluation (post-deploy) share the same metrics and the same datasets. The scoring logic you use to test an agent before it ships is the exact same logic that scores it in production. That means no gap between what you validated and what you're actually measuring once real users are involved.
Things like hallucinations, unsafe or off-policy responses, incomplete task execution, wrong tone, and incorrect tool usage — scored across 50+ built-in metrics, or your own custom rubrics if you need something specific to your use case. It also evaluates multi-step agent behavior, not just the final answer: did the agent reason through the task correctly and call the right tools along the way?


AI agents don't stop evolving when they ship to production. Teams continuously optimize for better accuracy, lower cost, faster response times, stronger safety, and higher customer satisfaction. That means updating prompts, changing models, and introducing new guardrails far more frequently than traditional code releases. Yet most teams are still managing those changes through deployments, environment variables, or manual processes.
That is the gap Harness AI Config Management is designed to close. It is a governed runtime configuration system that lets teams change prompts, models, routing, and behavior without redeploying code.
Harness Feature Management & Experimentation already helps teams control features in production, gating who sees a capability, governing the release strategy, and measuring impact. Harness AI Config Management extends that same discipline to agent behavior. Teams can manage prompts, model selection, and the inference parameters that control how the model behaves, all as runtime configurations that are targeted, measurable, and governed.
Feature flags answer: who should see this AI capability?
AI Configs answer: how should that capability behave?
Experiments answer: which behavior delivered the best outcome?
The industry is transitioning from deterministic software to probabilistic/AI-driven software. This evolution is transforming a number of dimensions and dramatically changing what runtime management must address.
Together, these differences mean that the operational surface area for AI agents is significantly wider and less forgiving than traditional software. Costs can spike without warning, failures are harder to detect, and the number of stakeholders making changes continues to grow.
The Ungoverned AI Problem
In most organizations today, AI changes happen without governance:
The result is a standoff. Platform teams can't give product teams the freedom to iterate because the risks of ungoverned changes are too high. Product teams can't move at the pace AI requires because every change bottlenecks through engineering and deployment. Harness AI Config Management is designed to break that standoff.
Imagine a team shipping a new AI Support Agent.
The team deploys the agent behind a feature flag, limiting access to internal users and a small beta cohort. To control agent behavior at runtime, the team uses AI configs to manage the prompt, temperature, token limits, retrieval threshold, and fallback message without touching code.
Before promoting anything to production, the team tunes parameters in pre-production environments using environment-level definitions and targeting. Changes are reviewed and governed through Harness before they go live.
With the agent running in production, the team creates two AI config variations: one optimized for concise answers and one for detailed troubleshooting. Those variations are targeted to different user cohorts, and impression data feeds directly into an experiment. The team now has real evidence of which behavior drives better outcomes before deciding whether to roll out further, iterate, or roll back.

Harness AI Config Management is built on Harness Configs, a first-class runtime configuration layer in Harness FME. It uses the same config model, the same delivery path, and the same governance patterns teams already rely on for production software.

Harness AI Configs use a two-level model. Teams define schema, default values, and variations once, then manage targeting rules and live values per environment. Developers and AI teams can iterate freely in development and staging while keeping production stable. When a configuration is ready, it can be promoted across environments without a redeployment.
Harness AI Config Management supports multiple variations per config. A team might compare two prompts, route different customer cohorts to different model choices, or test parameter changes against a controlled audience. Targeting rules determine which users, accounts, or environments receive each variation, using the same rule builder as Harness feature flags.
This is what turns AI tuning from a guessing exercise into a structured release and learning loop. Teams can shift AI behavior for a limited group, watch quality and business metrics, then decide whether to expand, iterate, or roll back.
Developers call getConfig() to resolve the right configuration for a given target and get back type-safe accessors for string, number, and boolean values. For AI use cases, that means resolving a prompt, model, temperature, or parameter at runtime without redeploying. There is no separate AI SDK. AI configs build on the same delivery layer as every other config, giving teams one consistent way to manage runtime behavior.
The most important part of Harness AI Config Management is not that teams can change AI behavior faster. It is that they can do it with governance.
Harness FME applies RBAC, granular permissions, approvals, OPA policy evaluation, version history, and audit logs to every config change. Sensitive production changes can require policy checks before they propagate. That matters because AI behavior changes carry real customer impact. A model swap can affect cost and latency. A prompt update can shift output quality in ways that are hard to detect without the right tooling.
Changes to AI configs require the same release discipline as code.
Harness AI Config Management helps teams manage the behavior behind AI features with the same discipline they apply to modern software releases: targeted rollout, experimentation, approvals, policy, auditability, and rollback.
Ready to see how Harness helps teams govern AI behavior without slowing iteration? Sign up today and get started with a free account!
AI Configs are governed runtime configurations for AI-powered product experiences. They can include the prompt, the model, inference parameters such as temperature and token limits, and other AI behavior parameters.
Feature flags control access. They decide who sees a feature and when. AI Configs control behavior. They decide which prompt, model, parameter, threshold, or fallback a user receives once the AI capability is available.
Hardcoding prompts and model parameters makes every behavior change depend on a deployment, slowing iteration and hiding important production decisions inside application logic. AI Configs externalize those decisions into a governed runtime layer.
Harness FME can apply RBAC, approvals, OPA policy checks, version history, and audit logging to AI config changes.
Yes. AI Configs support variations and targeting, which creates the foundation for testing different prompts, models, or parameters with controlled audiences. Teams can compare outcomes such as quality, latency, cost, satisfaction, reliability, and business impact.
No. AI Configs build on the same Configs SDK delivery model. Developers can resolve the right config for a target at runtime and use type-safe accessors for the values their application needs.
AI engineers, ML engineers, prompt engineers, product managers, SREs, platform teams, data scientists, and experimentation teams can all benefit. The common need is controlled, measurable, governed iteration on AI behavior at runtime.


More teams are building AI agents today. Engineers deploy them into customer-facing production environments, product teams integrate them into customer workflows, platform teams build them for internal use, and even sales, marketing, and support teams are creating agents for their own operations.
Shipping a software update usually follows a known process: build it, test it, deploy it with a script. That process works. It's how the modern software delivery industry was built, and it works because application code is deterministic — test it once and you’ll get the same result next time.
Agents break this model. An agent’s underlying language model decides how to complete a task. But that flexibility comes at a cost. Building an agent is easy. Delivering one safely to production is not.
Today, Harness is extending its platform to cover the full agent development lifecycle. With Harness Agent DLC, you can now build, test, deploy, operate, and govern agents through the same platform you already use for your applications — with the same controls, pipelines, and governance you apply to everything else you ship.
AI agents behave differently. They dynamically select tools, invoke models, coordinate with other agents, and adapt their execution paths based on context. Each time an agent runs, it can make different choices even with the same input. That makes their behavior inherently unpredictable and can lead to significant differences in cost, latency, reliability, or risk. Traditional testing and governance playbooks no longer apply.
According to Gartner®, “only 8% of organizations have agentic AI in production”. Agents aren’t making it to production because organizations can't apply the same security, governance and quality guardrails they rely on for traditional software. The risk is too high to ignore. A rogue agent in production can expose customer data, violate a compliance policy, or make unauthorized decisions. In financial services, healthcare, and travel, that's not a bad week. It's a regulatory event or a headline. Incidents are no longer reproducible on demand. Teams building agents need a way to ship them with the same confidence they ship everything else.
You build agents with the same coding tools you already use. Harness Continuous Integration (CI) builds them into deployable artifacts, just as it builds any other service. No new build system to learn. The agent is just another standard microservice that goes through CI.
Testing an AI agent requires different tools versus traditional software. With software, an input generates a predictable output. AI agents are inherently non-deterministic. A single prompt can yield multiple correct, yet entirely different, outputs. A response might be factually correct but delivered in the wrong tone or return a plausible wrong answer.
Traditional testing falls short in this new reality where a test is no longer a pass fail but a scored spectrum. Teams need testing capabilities built for agents that can be integrated cleanly into their governed delivery pipelines.
Harness AI Evals (NEW) makes the core agent quality measurable, allowing for agent-aware quality gates in your CI/CD pipelines. With AI Evals, changes to your agent (or underlying model) are evaluated first against your standard data sets and model outputs. The output is evaluated across many dimensions, including correctness, performance, and safety. Teams can then use the scores as quality gates in their CD pipelines to simplify release decisions. Then, production data can be fed back in, improving your testing based on real inputs. Learn more.

Harness AI Test Automation (AIT) validates that the agent works within an application’s chat interface using AI assertions. Instead of writing brittle code, testers use plain English assertions to describe a good response. AIT emulates a real user via the browser, requiring no API hooks or direct model access.
You cannot isolate agent validation from how you deliver the rest of your system. Natively binding backend logic evaluation with user-centric UI testing inside your delivery lifecycle ensures your agents are actually improving, not just running and returning answers.
Unlike traditional software, AI agents are composed of many independently evolving artifacts, including agent definitions, prompts, skills, MCP servers, models, and policies. These artifacts are developed, evaluated, and updated independently, yet together determine how an agent behaves in production. As they're built, evaluated, and reused across teams, the Agent DLC needs more than a repository. It needs a trusted system of record that manages the complete release definition of an AI agent.
Harness Artifact Registry provides a centralized registry for AI and software artifacts, preserving their versions, provenance, dependencies, and promotion history. By governing the complete set of artifacts behind every agent release, teams can confidently compose trusted AI agents, reuse approved components, and promote reproducible agent deployments.
Most AI agents in production run either as containers on Kubernetes or on managed runtimes like Amazon Bedrock AgentCore. Harness Continuous Delivery (CD) already covers the Kubernetes path with canary releases, progressive rollout, automated rollback, approval gates, and policy guardrails. Until today, deploying to a managed runtime typically meant a separate cloud-specific workflow, outside your pipelines and governance.
Agent Deployments (NEW) extend that same governance to managed agent runtimes, starting with Amazon Bedrock AgentCore and Google’s Agent Runtime. Agent Deployments now run as a stage in the same Harness CD pipeline as your services, with no new scripts or tooling required. Because the agent deploy is a stage in that pipeline rather than a separate workflow, release orchestration can sequence backend, frontend, and agent code into a single release, instead of running the agent deploy on its own, separate from the other two.
In addition, the same OPA policy-as-code framework that governs your backend and frontend now governs your agent deployments. You can now cap CPU or memory consumption, restrict which models agents can call, or block anything outside an approved list. Agent Deployments also integrate directly with Harness AI Evals and other LLM evaluation frameworks, such as Deepeval. This closes the gap between an agent that deploys successfully and one that runs reliably in production. Learn more.

Once an agent ships, the same platform that manages your services manages your agents. Harness already handles cost visibility, runtime release management, and experimentation. All of these capabilities now extend to cover agents.
AI Cost Management extends the cost visibility, attribution, and governance you rely on for cloud spend to every agent, model, and provider, so you know what agents cost and are better able to keep that spend under control.
AI Configs (NEW) support the release and management of prompts and model changes at runtime, backed by the same feature flagging infrastructure your teams already rely on. Run controlled experiments to see which AI behavior performs best, then promote the winner with confidence. If it doesn’t improve the customer experience, roll back instantly without redeploying. Learn more.

Building, testing, and deploying AI agents safely into production is only part of the challenge. Organizations also need to know which agents exist, who owns them, and whether an agent already solves the problem they're about to tackle. Without that visibility, organizations risk unnecessary cost and operational complexity.
AI Asset Catalog (NEW), part of the Harness Internal Developer Portal, makes sure every agent in your organization has an owner. It auto-discovers and registers your agents, skills, and plugins from your source code repositories. Each AI asset is stored with its full instruction set and linked to its owner and dependencies. Developers can easily discover what agents and skills already exist before building new ones, cutting down on duplicate work and sprawl. With out-of-the-box and custom scorecard checks, platform teams can define and enforce standards so AI assets are governed just like any other software component.

Security runs through every stage of the Agent DLC — build, test, deploy, operate, and govern — and requires a different approach than traditional software security. Agents reason and act at runtime in ways no static scan can anticipate. They dynamically expand their attack surface by connecting to tools and APIs, spawn sub-agents without a human in the loop, and inherit trust from every model and dependency they touch. Traditional security wasn't built for any of that.
New agent security capabilities shift left to limit what agents can do before they ship, and shields right to enforce policy on agents already running in production.
Shift-left
Shield-right

As organizations move AI agents into production, those agents are increasingly reviewing code, remediating security issues, assisting customers, and automating complex workflows. Yet most organizations have little visibility into how those agents actually operate.
Harness AgentTrace (NEW) captures execution at the run level and across full sessions, so teams can understand both what happened in a single agent run and how behavior evolves across an entire user interaction.
With AgentTrace, organizations can understand how an agent behaved and what influenced its path, identify performance bottlenecks and failure points, compare execution quality across models and prompts, and establish governance for AI systems running in production.
AgentTrace serves as the layer that connects every stage of Harness Agent DLC, providing the telemetry and audit trail consumed across Harness products.

Today, Harness is open-sourcing the foundational components of AgentTrace, including harness-sdk and harness-evals (the open-source SDK on which Harness AI Evals is built), so developers can use the same tracing primitives in their own AI applications. Learn more.
The challenge organizations face today is extending the same software development lifecycle to their agent delivery. That's the truth behind what’s driving Gartner's finding that only 8% of organizations have agentic AI in production.
Today, Harness is launching our Agent DLC to support our customers in successfully delivering AI agents. Everything you’ve done for software delivery over the last decade — governance, orchestration, security, testing — you can now do for agents in the same platform.
Talk to our team about what shipping your first agent through Harness Agent DLC would look like. Book a demo.


Traditional security was built for software that sits still. Agents don't.
Agentic applications break the assumptions traditional security was built on. The traditional SDLC assumes artifacts are static once deployed, attack surfaces are known and inventoried, humans control every decision and gate, and supply chain risk ends at code and dependencies. Agents violate all four. They reason and act at runtime in ways no static scan can fully anticipate. They dynamically discover and connect to tools, MCP servers, and APIs, expanding the attack surface continuously. They spawn sub-agents and chain across systems without a human in the loop. And they inherit trust from every model, tool, and API they connect to, making supply chain risk exponentially wider and harder to contain.
Security tools built for the traditional SDLC weren’t designed for any of this.
Securing agents requires a fundamentally different approach than securing traditional software. Not a new tool bolted onto existing practice, but a new discipline built around how agents actually work - one that shifts left to constrain what agents can do before they're deployed, and shields right to enforce policy and maintain visibility while they run.
Today, Harness announced the availability of the industry's first DevSecOps platform for the Agent Development Lifecycle (Agent DLC) - purpose-built for both developing and operating agents securely.
You can't predict everything an agent will do once deployed. But what an agent does at runtime isn't random. The skills you expose, the tools you wire up, the models you select, and the prompts you write all shape it. Shift-left for agent development isn't about catching every runtime risk before it happens; it's about limiting what agents can do once they're live.
Primitive Scanning analyzes the new design-time decisions that agents introduce, helping catch exposure and misconfiguration before any agent is built or deployed. It extends Harness SAST with skill and prompt scanning, and Harness Security Testing Orchestration with model scanning.
AIBOM with Harness Supply Chain Security gives you a complete inventory of every model, tool, and dependency used to build an agent, expanding the traditional SBOM to cover the full AI supply chain.
AI Testing tells you whether agents are safe by testing them for adversarial inputs, unexpected behaviors, and policy violations across the OWASP Top 10 LLM and Agentic AI risks.

AIBOM inventories the AI components used to build an agent, including models, libraries, frameworks, datasets, prompts, skills, tools, and services.
Shift-left narrows what agents can do, but once deployed, agents operate in an open world. They encounter inputs, tool responses, and chain behaviors that no pre-deployment check can fully anticipate. Protecting agents in production requires continuous visibility into what agents are running and what they're doing.
Agent Discovery expands AI Discovery beyond individual AI assets by introducing an agent SPM capability to the platform that continuously surfaces agents as they spin up, maps how AI assets connect and chain, and assesses their posture across your organization. Where shift-left defines the boundaries, Agent Discovery tells you what's operating within them.
AI Firewall protects all AI assets, including agents at runtime, enforcing policy continuously against prompt injection, tool misuse, and data exfiltration through agentic chains - after the agent is live and as long as it runs.
AgentTrace brings observability throughout the entire agent activity session, providing a full audit trail across prompts, reasoning, tool calls, and outputs. This is especially important for agentic operations to have confidence that the non-deterministic systems are acting as expected.

Agent Discovery continuously identifies active AI agents, maps their dependencies and interactions, and surfaces associated risk and sensitive-data exposure.
Blindly applying traditional AppSec to agent development doesn't work. The assumptions don't hold, the tools don't reach, and the attack surface keeps moving. What's needed isn't a patch on existing practice; it's a purpose-built approach that secures agents at every stage of how they're actually built and run.
That's what Harness offers. Shift-left to define the boundaries. Shield-right to hold them. A single platform that treats agent security not as an afterthought, but as a first-class discipline across the full Agent DLC.
Agents are already in production. The question is whether your security posture is built for them.
Talk to our team to see how Harness secures the Agent DLC.
.png)
.png)

For more than a decade, Infrastructure as Code (IaC) has transformed how engineering organizations build and operate systems.
Infrastructure became programmable, provisioning became repeatable, and configuration became version-controlled.
Teams gained the ability to automate environment creation, enforce policy consistently, and scale infrastructure operations far beyond what manual processes could support.
Yet one critical part of software delivery never fully made the same transition, the database.
As Mrina Sugosh, Senior Product Marketing Manager at Harness, explained during a recent discussion on modern software delivery: infrastructure evolved into a declarative system while database delivery largely remained procedural.
That gap is becoming increasingly difficult to ignore.
Infrastructure as Code introduced a powerful operating model. Instead of manually configuring servers and cloud resources, teams could define desired state in code and let pipelines handle deployment. Tools like Terraform, OpenTofu, AWS CloudFormation, AWS CDK, and Terragrunt let organizations standardize infrastructure management and retire the fragile, hand-run processes that came before.
Platform engineering itself emerged from this shift. Version-controlled infrastructure, reproducible environments, and codified policy became foundational capabilities for modern engineering organizations.
Databases followed a different path. Schema changes, migrations, rollback logic, and data management frequently stayed outside that same delivery framework. The result is a split operating model: infrastructure is automated, applications are automated, and database changes are still done by hand. That separation is where the risk lives.
Modern systems are no longer simple applications running on servers. They're interconnected ecosystems of applications, databases, APIs, queues, caches, event systems, and infrastructure services, each one depending on the others behaving correctly.
Yet many organizations still deploy these components through separate workflows. A database engineer manages schema changes, a DevOps engineer manages infrastructure, an application team manages deployments, and success depends on those people coordinating rather than those systems coordinating.
Wyatt Munson, Product Education Engineer at Harness, described what that looks like in practice: sitting shoulder to shoulder with a software engineer during a deployment, one person ready to roll back the application and the other ready to roll back the database, both watching for the moment to click at the same time. It worked. But a release that hinges on two people and their timing isn't a delivery model that scales.
Many organizations assume database delivery should behave like IaC, but the reality is more complicated. Infrastructure provisioning is generally additive and reconstructable: if a virtual machine fails, you recreate it; if a Kubernetes cluster is misconfigured, you rebuild it.
Database changes operate differently because they carry persistent business state. They represent years of accumulated data, application assumptions, indexing strategies, access patterns, and operational dependencies. A schema migration isn't provisioning infrastructure. It's modifying a live system, and even seemingly small changes can ripple outward:
As Munson put it: "At the end of the day, it's the data that's the most important." Losing infrastructure is disruptive. Losing data is catastrophic.
The risks of database delivery aren't theoretical. One example discussed during the webinar was a GitHub production database migration. A migration removed a column believed to be unused, but parts of the application still referenced that column through a separate ORM path. After the change deployed, GitHub saw elevated error rates across pull requests, push operations, notifications, webhooks, and API traffic.
The failure wasn't really the migration itself. It was that the database change and the application that depended on it were validated separately rather than together. The migration was checked as a migration and the application was checked as an application, but the two were never exercised as one system before the change reached production. So the dependency stayed invisible until it broke in front of customers.
This is the gap a unified delivery model is built to close, and it closes it in two places:
Database changes should be managed like application code, through version control and GitOps. That gives every change traceability, auditability, and a documented history: who made it, why, and when it shipped. The same properties that make application code reviewable and repeatable apply just as well to a schema migration.
Database delivery needs more than deployment automation. Before a change reaches production it should go through:
The goal is to remove uncertainty before a change ships, not to rely on an emergency undo after it's already in production.
The biggest opportunity is bringing infrastructure, application, and database delivery into a single operational framework. Instead of coordinating separate workflows by hand, platform teams orchestrate them through one pipeline, so application deployment, infrastructure provisioning, and database migration run as a single coordinated motion, governed consistently rather than stitched together by hand.
The next phase of platform engineering extends the code-driven model beyond infrastructure to delivery itself. Call it Delivery as Code: the principles that made infrastructure programmable, applied to how every change ships, databases included.
In practice that means three things.
Database changes move through controlled promotion workflows rather than ad hoc scripts, so each one is reviewed, tested, and promoted environment to environment like application code.
Governance gets codified through policy engines such as Open Policy Agent, so the rules that used to live in someone's head become enforceable at the pipeline:
AI begins to absorb the repetitive operational work, helping draft migration definitions and validation checks so engineers spend less time on boilerplate and more on the changes that actually need judgment.
The goal isn't replacing engineers. It's removing the repetitive operational toil so they can focus on higher-value work.
Platform teams are facing a new reality. AI-generated code is increasing development velocity dramatically, and more changes are entering delivery systems than ever before. When application deployment is automated but database delivery stays manual, the database becomes the bottleneck, and the fix isn't more coordination meetings. It's a unified delivery model where:
That's a delivery system that can scale alongside modern software development. Infrastructure as Code was the first step. Database DevOps is the next one.
Infrastructure as Code fundamentally changed software delivery by making infrastructure programmable.
But modern systems are more than infrastructure.
Applications, databases, policies, and delivery workflows must operate as a coordinated system.
As software delivery accelerates—particularly with the rise of AI-generated code—database delivery can no longer remain a separate operational process.
Platform teams that unify infrastructure, application, and database workflows will be better positioned to deliver software faster, safer, and with greater operational confidence.
Ready to see how Harness helps platform teams bring database delivery into the modern software delivery lifecycle? Explore Harness Database DevOps and Infrastructure as Code Management.
Database DevOps applies DevOps principles to database changes, including version control, automation, testing, governance, and CI/CD workflows.
Infrastructure as Code manages infrastructure state but does not address schema changes, data migrations, rollback workflows, or database governance.
Database changes modify persistent production data. Unlike infrastructure resources, databases often cannot be recreated without business impact.
It enables automated testing, version-controlled changes, rollback capabilities, and coordinated application and database deployments.
GitOps provides version control, auditability, and workflow automation for database schema changes and migration management.
Yes. Database DevOps integrates natively with Harness Continuous Delivery, so schema management, validation, and rollback run as steps in the same pipeline as your application deployments. If you run a different CI/CD tool, those same capabilities can be invoked from your existing pipelines instead.
Harness has an AI powered schema authoring capability, which can assist with migration generation, so engineers spend less time on boilerplate and more on the changes that need real judgment. Governance and approval controls stay in place regardless of how a change was authored.


Database migrations are rarely just about changing schema. In real production systems, every migration has to preserve three things at the same time: application availability, data consistency, and compatibility across versions. That is the hard part.
When teams say they want “100% uptime,” what they usually mean is no planned downtime during deployments and no user-visible interruption while the application and database are evolving. That goal is realistic, but only if the migration strategy is designed around compatibility from the start.
A migration should never assume that the new application version is the only code touching the database. During a rolling deployment, blue-green cutover, or staged rollout, both versions may run side by side for a period of time.
That creates a simple rule: “Every schema change must be safe for the current app version and the next app version.” If your schema is not designed for this overlap, you introduce:
The solution is not complex tooling, it's the correct migration strategy. Since the safe database migration is not just “correct” - it must be compatible across versions.
This is the foundation of zero downtime database migration.

These patterns follow the same rule: never break existing reads or writes during transition.
This is the real test of a safe migration. The old version may still:
The new version may:
To support both, design the transition so that:
That is why additive changes and compatibility windows matter more than raw speed. This aligns with real-world pipelines where schema and application changes are decoupled but coordinated.
During migration, both schema versions may remain active simultaneously.
This creates a synchronization window where:
Common synchronization approaches include:
Without synchronization safeguards, post-migration edits can cause data divergence between old and new schemas.
Your pipeline example reflects the same deployment philosophy: application rollout, schema application, and controlled progression are separated into explicit steps rather than collapsing everything into one risky event. That is exactly the kind of sequencing needed for production-safe migrations.
In a mature release process, a database migration stage should be treated as a release gate, not a side effect. The schema change should happen only when the release pipeline has proven that the next application version can coexist with the previous one.
That is how you preserve uptime without gambling on runtime behavior.
The expand-and-contract pattern is a phased migration strategy used to evolve database schemas safely without downtime. It works in three stages:
This allows both old and new application versions to operate safely during deployment.
Key best practices for zero downtime database migrations include:
These practices minimize risk and ensure smooth production rollouts.
To migrate a database without downtime, use a phased, backward-compatible approach:
This approach ensures continuous availability during the migration process.
Application-layer dual writes alone do not guarantee consistency. Failures between writes, retries, or partial transaction completion can still introduce divergence between old and new structures. In relational systems, teams often use triggers, CDC pipelines, or transactional synchronization to reduce drift risk during migration windows.
Backward compatible schema design means structuring database changes so that existing application versions continue to function without modification.
For example:
This is critical during rolling deployments where multiple application versions interact with the database simultaneously.
Common risks of database schema changes in production include:
These risks can be mitigated by using safe migration patterns, staged rollouts, and compatibility-first database design. For example, if a trigger, CDC stream, or synchronization process misses an update, the old and new representations may diverge silently.


A DevOps tools list is the set of tool categories spanning the software delivery lifecycle, source, build, test, secure, deploy, and operate, that a team assembles into a working stack. A complete list covers every stage from code to production; a good one covers them with as few disconnected tools as possible. In 2026, the useful question is not how long the list is, but how few seams sit between the tools on it.
A new engineer joins a team and asks for the DevOps tools list. What comes back is a 22-line inventory: a source host, two CI systems, an IaC engine, a registry, three scanners, a deployment tool, a couple of dashboards, and nobody who can fully explain how they all connect. That inventory is the team's DevOps tools list, and its length is often mistaken for its strength.
A DevOps tools list is the connected set of tools spanning the software delivery lifecycle (source control, build, test, security, deployment, and operations) that a team assembles to move software from code to production safely and reliably. A useful DevOps tools list covers every stage with as few disconnected tools as possible. The goal is not the longest list. It is the smallest unified stack that lets teams ship faster and safer.
A functional DevOps tools list covers nine stages. Each stage has multiple options, but the principle is the same: choose devops pipeline tools that integrate well, then consolidate the integration points.
The categories matter less than the integration. CI that shares a policy layer with your CD platform and security testing is more valuable than three best devops tools with no shared context. The Internal Developer Portal is what surfaces these as golden paths developers self-serve on, rather than ticket queues they wait on.
The categories above are not new. What changed in 2026 is the cost of how they are connected. AI moved into code creation, so more change flows through every stage—and the seams between separately chosen tools, each with its own access model and audit trail, became the place where governance and context break down. The list got longer; the gaps between its items got more expensive.
A useful DevOps tools comparison isn’t product-versus-product, it’s two ways of assembling the stack. The table below frames that DevOps tools comparison directly: the longer list against the right stack.
It is tempting to read a long tools list as a mature one. But each tool added to the list is another integration to maintain, another audit trail to reconcile, and another point where a security or quality check can be skipped. As AI raises the volume of change moving through the stack, those seams are exactly where speed turns into risk—the pattern Harness calls the AI Velocity Paradox.
Key data: Harness research (State of AI in Software Engineering 2025) shows 71% of teams say context-switching between tools drains productivity, and 73% of engineering leaders report barely any teams have standardized golden paths.
So the honest answer to "what's the best DevOps tools list" is not a longer list. It is a list short enough to govern consistently and complete enough to cover every stage—which usually means consolidating, not collecting.
The answer is not a specific list of vendor names. It is a set of principles that any good DevOps tools list should satisfy.
Key Distinction: The only stack you need is not the longest tools list—it's the smallest set of governed categories that covers the lifecycle without sprawl. A consolidated stack that shares governance beats a longer one whose tools don't.
Platform teams are asked to give developers fast, self-service delivery while maintaining governance and reliability. As AI accelerates code output and tools accumulate, the after-code stages (testing, securing, deploying, operating) fragment across products with no shared context or governance. The platform team ends up maintaining integration seams instead of improving delivery.

Harness is the AI-native Software Delivery Platform that automates and governs everything after code is written. The Software Delivery Knowledge Graph ties each build, deployment, and security event back to the service and commit it came from. On that foundation sit the after-code modules: Continuous Integration, Continuous Delivery and GitOps, the Internal Developer Portal, Infrastructure as Code Management, Application Security Testing, AI SRE, AI Test Automation, and Cloud and AI Cost Management. Each inherits shared access control, governance, and a single audit trail. Developer-friendly guardrails.
Consolidating the stack onto one governed platform helps reduce the governance gaps and integration toil that sprawl creates, accelerates remediation when something breaks, and lets teams ship faster and safer as AI raises the volume of change. The aim is not the longest tools list, but the smallest one a team can govern with confidence.
See how teams have simplified their stacks.
Two teams, two different sprawl problems, one outcome: consolidation returns engineering time to the work that actually needs it.
OneAdvanced managed over 100 product teams and 700-plus engineers deploying across six data centers, each with a different combination of Jenkins, CloudFormation, Octopus Deploy, Puppet, and Bash scripts. Pipelines took 3 to 30 hours to execute. Consolidating onto Harness CD gave every team self-service deployment on one governed platform. Average deployment time fell 88% from 2 days to 2 hours.
“We've conservatively saved 50 to 60% of total DevOps and engineering time spent on deployments and our previous CI/CD process.”
Martin Reynolds, DevOps Manager, OneAdvanced
Source: OneAdvanced enables 700 engineers with Harness
Deluxe, a payments and data leader, had grown a wide technology footprint. Teams relied on custom scripts, multiple tools, and no centralized governance. Adopting Harness gave Deluxe standardized CI/CD templates and centralized governance across teams. Pipeline setup time dropped from days to under 30 minutes using reusable templates.
“With Harness CD, one of the biggest improvements is the confidence we have in deployment. Gates ensure only the right things are deployed, and rollback scripts are already embedded.”
Pankaj Gupta, Executive Director of Enterprise Architecture, Deluxe
Source: Deluxe reduces CI/CD pipeline setup time with Harness
The best DevOps tools list is not the most comprehensive. It is the one where fewer, well-integrated devops pipeline tools replace fragmented point solutions, and where adding the hundredth team costs about what adding the tenth did. Start from the governance gaps: find the stages where your audit trails break, where approvals depend on a human remembering a step, where a deploy needs someone to watch a dashboard. Those are the integration seams worth removing.
A unified platform covering the after-code lifecycle with shared governance, golden paths, and AI-native automation is how teams absorb AI-generated code at machine speed without losing control of what ships.
See how Harness brings the full after-code lifecycle onto one platform.
A DevOps tools list is the connected set of tools spanning the software delivery lifecycle: source control, CI, artifact management, security testing, CD, infrastructure, observability, and cost management. The goal is not the longest list but the smallest unified stack with shared governance that lets teams ship faster and safer.
At minimum: source control, CI (to build and test), artifact registry, CD (to deploy), infrastructure automation, security scanning, and observability. Everything else is additive. Start with these and add based on actual pain in your devops pipeline tools, not theoretical coverage.
The best DevOps tools are the ones that reduce toil, integrate with your existing stack, enforce governance by default, and scale without requiring a complete overhaul. Tools that deliver automation, observability, and governance in one place outperform best-of-breed stacks that create integration seams between every stage.
No. A separate tool for every stage was the default in 2015. In 2026, unified platforms cover multiple stages with shared context, shared access control, and shared audit trails. The integration toil between separate tools is often more expensive than any capability gap a platform might have.
A DevOps tools list is what you have: an inventory of tools covering different stages. A DevOps platform is what you want: a system where those stages share context, permissions, and governance so every team can self-serve safely. The platform makes the tools list smaller and the outcomes better.
Fewer than most teams currently run. The average team uses 8 to 10 AI tools and up to 30 across the full SDLC. The goal is sufficient coverage with minimal integration seams and one governance layer across all of them. Consolidating by two or three tools typically reclaims significant engineering time.


A DevOps platform is an integrated software delivery system that manages the entire software development lifecycle (SDLC)—from source code and continuous integration (CI) to deployment, security, infrastructure, and operations. Unlike standalone DevOps tools that solve individual problems, a DevOps platform connects teams, workflows, and delivery processes in a single environment, providing shared automation, governance, and visibility.

A DevOps platform is becoming the standard answer to a gap that keeps widening: software development is accelerating, but software delivery is not keeping pace. AI is helping engineering teams write code faster, yet moving that code safely from commit to production still depends on build pipelines, security checks, deployment workflows, governance, and cross-team collaboration.
This gap is becoming more apparent as organizations adopt AI. The 2025 DORA State of AI-assisted Software Development report finds that AI amplifies an organization's existing strengths and weaknesses. Teams see the greatest benefits not from AI alone, but from strong internal platforms, well-defined engineering workflows, and effective collaboration.
That is why organizations are rethinking fragmented DevOps toolchains. Instead of relying on disconnected tools stitched together with custom integrations, many are adopting DevOps platforms that unify software delivery into a single system. The result is faster releases, stronger governance, and better visibility across the software development lifecycle.
In this guide, you will learn what a DevOps platform is, how it differs from a standalone DevOps pipeline, and what capabilities to look for when evaluating one for your organization.
A DevOps pipeline is a single automated workflow, such as building and deploying an application. A DevOps platform manages and orchestrates multiple pipelines while connecting the people, policies, tools, and processes required to deliver software reliably at scale.
The distinction becomes more apparent as engineering organizations grow. Individual DevOps pipeline tools can address specific stages of software delivery, but coordinating workflows, enforcing governance, and maintaining visibility across multiple teams becomes increasingly difficult when every capability operates in isolation.
Standalone DevOps tools are designed to solve specific challenges, whether it is source code management, CI/CD, security testing, or infrastructure automation. As engineering organizations grow, however, connecting these tools through custom integrations, scripts, and manual processes can increase operational complexity. A unified DevOps platform brings these capabilities together into a single software delivery system, creating consistent workflows, centralized governance, and shared visibility across teams.
Fragmented toolchains introduce accidental complexity. As engineering organizations scale, teams spend increasing amounts of time maintaining integrations, troubleshooting workflow failures, and synchronizing data across multiple systems instead of improving software delivery. Over time, this creates integration debt, increases operational overhead, and makes it harder to standardize software delivery across the organization.
Specialized DevOps tools solve specific problems well, but they are not designed to operate as a single software delivery system. As organizations adopt more tools, engineering teams must maintain integrations, synchronize data, enforce consistent policies, and switch between multiple interfaces to complete everyday tasks.
Over time, this creates integration debt and operational complexity. Instead of improving delivery processes, platform teams spend valuable engineering effort maintaining the toolchain itself. The result is slower releases, inconsistent governance, limited visibility, and a developer experience that becomes increasingly difficult to scale.
A unified DevOps platform shifts engineering effort from maintaining tools to improving software delivery. Instead of coordinating work across disconnected systems, teams operate from a common delivery framework with standardized workflows, consistent governance, and shared operational context.
The benefits extend beyond operational efficiency. For example, Ancestry reduced pipeline maintenance by 85%, increased deployment frequency 3x, and cut downtime by 50% after standardizing software delivery with a unified platform. Rather than adapting processes to fit individual tools, engineering teams can scale consistent delivery practices across applications, services, and environments, freeing up time to deliver more value to customers.
Key capabilities of a modern DevOps platform
A modern DevOps platform should do more than automate software delivery. It should provide the capabilities needed to build, secure, deploy, and govern applications consistently across teams, environments, and cloud providers.
As engineering organizations grow, the challenge is no longer adopting individual DevOps capabilities. It is operating them efficiently at scale. That is driving a broader shift toward unified platforms that reduce operational complexity while improving governance, visibility, and software delivery performance.
As engineering organizations grow, software delivery often becomes more difficult to manage than software development itself. New tools improve individual stages of the delivery lifecycle, but they also introduce additional licensing costs, longer onboarding cycles, fragmented visibility, inconsistent governance, and a broader security surface to manage.
This growing complexity is reflected in industry research. Forrester's The Forrester Wave™: DevOps Platforms, Q2 2025 reflects the industry's shift from evaluating individual delivery tools to assessing integrated DevOps platforms that support end-to-end software delivery.
Performance research reinforces the shift. Elite engineering teams deploy 182x more frequently than low performers (DORA, State of AI-assisted Software Development 2025), and that gap tracks closely with whether delivery runs on a unified platform or a fragmented toolchain. Together, these trends explain why enterprises are increasingly consolidating their DevOps toolchains into unified platforms, but which one should you go for?
Choosing a DevOps platform is a strategic engineering decision, not just a software purchase. The platform you select will influence how your teams build, secure, deploy, and govern software for years to come. Rather than comparing feature checklists, evaluate how well each platform supports your delivery workflows, integrates with your existing ecosystem, and scales with your engineering organization. In practice, the best DevOps platform is rarely the one with the most features. It is the one that fits the way your teams deliver software.
When evaluating DevOps platforms, look beyond individual capabilities. Consider whether the platform can:
Before making a decision, involve engineering, security, platform, and operations teams in the evaluation process. The answers to these questions will often reveal whether a platform fits your organization better than a feature comparison alone.
Modern software delivery requires more than CI/CD automation. Teams need a platform that unifies software delivery, security, governance, cost management, and engineering insights without increasing operational complexity. Harness delivers this through an AI-native DevOps platform that brings together:
Beyond consolidating capabilities, Harness helps engineering teams work more efficiently. AI-powered pipeline generation and optimization reduce manual effort, built-in governance enforces organizational policies across delivery workflows, and unified dashboards provide real-time visibility into deployments, reliability, compliance, and engineering performance. The result is a software delivery platform designed to help organizations build, secure, and deploy software with greater speed and consistency that engineering teams trust.
Every additional point tool starts as a fix for one problem and ends as one more system someone has to maintain, secure, and explain to a new hire. The question is not whether your DevOps tool stack will need to consolidate eventually. It is whether you do it on your own timeline or after the integration debt has already slowed delivery.
Start by mapping your own delivery workflow against the criteria above: integration, governance, scalability, AI capability, and total cost.
See how Harness brings CI, CD, security, cost management, and engineering insights onto one AI-native platform.
A DevOps pipeline is a workflow that automates stages of software delivery, such as building, testing, and deploying applications. A DevOps platform is a broader system that connects multiple pipelines with security, governance, artifact management, infrastructure automation, and engineering insights to support the entire software delivery lifecycle.
The best enterprise DevOps platform is one that aligns with your organization's software delivery workflows, security requirements, and long-term engineering strategy. Enterprise teams should prioritize unified governance, scalability, AI-assisted automation, and support for hybrid or multi-cloud environments over the number of individual features.
Yes. A unified DevOps platform can reduce the operational overhead of managing multiple tools, allowing smaller teams to automate software delivery, improve visibility, and scale more easily as engineering needs grow. The key is selecting a platform that matches the team's current requirements without adding unnecessary complexity.
Implementation timelines vary depending on the size of the organization, existing toolchain, and migration strategy. Smaller teams may complete adoption within weeks, while enterprise deployments often take several months as workflows, governance policies, and integrations are standardized across teams.
No. A CI/CD platform focuses primarily on automating software builds, testing, and deployments. A DevOps platform includes CI/CD but also provides capabilities such as security, governance, artifact management, infrastructure automation, engineering insights, and policy enforcement within a unified software delivery system.
A unified platform trades some flexibility for governance and simplicity, so teams that depend on a narrow best-of-breed tool for a specific workflow may find the built-in equivalent less specialized. The right test is whether the platform covers enough of your delivery lifecycle to retire the point tools it replaces, not whether every individual feature matches a specialist tool.


When we launched Autonomous Worker Agents, governance inherited, not integrated, was the core promise: agents run inside the same pipelines, and inherit the same RBAC, policy, and audit trails already governing production, rather than getting security bolted on after the fact. The first post in this series covered one half of how we back that promise: isolation, the four walls (image hardening, process isolation, secret isolation, network isolation) that contain a compromised agent, even if it turns hostile. We proved that model by replaying a real CVSS-9.0 breach against our own hardened image and watching it fail at every layer.
This post covers the other half. Isolation answers what happens when an agent is compromised. This post answers what an agent is allowed to do when it isn't, when it's running exactly as designed. Even a perfectly sandboxed Autonomous Worker Agent is still a liability if it runs with more access than the task requires. What identity does it run as, and which permissions does it hold? This is authorization and least privilege, applied to a caller that picks its own actions at runtime.
THE INVARIANT EVERYTHING ELSE ENFORCES
An agent holds no standing privilege of its own. Its effective access is a bounded subset of the triggering principal's, the minimum the task needs, and nothing more.
Delegated identity: An agent authenticates as the principal that triggered it: same user, same audit trail. It is never a standing superuser or a shared service account with broad role bindings.
Least privilege by construction: Its access is a scoped subset of the triggering user's, on a token minted per run and deleted when the run ends. The mint step rejects any permission it can't prove the parent already holds.
Policy and RBAC, inherited: The RBAC and OPA governance that already guard Harness pipelines extend to agents, covering who may build one and what policy allows, because an agent is just a new kind of pipeline step.
Enforced, not assumed: Every check runs on the server: RBAC, the scope filter, and the gateway's tool intersection. A hidden UI button proves nothing; the console, the API, and the agent all resolve to the same decision.
We split agent security into three categories. The first post covered isolation: it assumes the process is already compromised and asks what the kernel, the filesystem, and the network will refuse to do on its behalf, controls that hold even when everything above them fails.
This post is category two. It answers a question isolation never touches: when the agent is functioning exactly as designed, what is it authorized to reach? An agent that's perfectly sandboxed but runs with the triggering user's full role bindings is still over-privileged. Isolation bounds the blast radius of a breach; authorization bounds the blast radius of correct, intended execution.
The full model, with this post's category marked:

Before agents, a pipeline step was explicit. Someone wrote create_issue(project="INFRA"), it went through review, and you could read the pipeline and know exactly what it would do to the outside world. The decision was in the code, and the code was checked before it ran.
Agents don't work that way. You hand an agent a goal. At runtime, the model decides which tools to call, in what order, with what parameters. The action isn't in the code anymore. You can't read it before it happens, and every control in this post exists because of that shift.
Credentials work the way they always did; the harder problem is accountability. The decision-maker moved from a human at authoring time to a model at runtime, so the guardrails move to runtime too. If you can't review an action before it runs, you're limited to bounding which actions are possible and recording every one that happens. Harness already governs pipelines with RBAC, Policy-as-Code, and an audit trail, and since an agent is just a new kind of pipeline step, that governance extends to it directly.
The sharpest example of the shift is the credential the agent runs with, because getting that wrong makes every other control irrelevant.
Same agent, same job: run one deploy pipeline on the user's behalf. The only thing that differs is the token it carries.
That scoped token is one of five controls. On its own, it bounds which Harness resources the agent can reach, not who was allowed to build the agent, which tools it may call, or what it did afterward. The full picture spans five controls in two phases. Two apply before the agent runs, at authoring and save time, deciding who may build it and what policy allows. Three apply while it runs, bounding the identity it carries, the tools it can call, and the record it leaves. In order:
Each one below stands on its own: the gap it closes, how it works, and the diagram that makes it concrete. None of them trusts the model to behave; each is enforced by the platform.
Author, publish, and execute are separate permissions
The gap it closes
An agent can hold a privileged connector and act across production. If anyone with module access could create, publish, or delete one, there's no boundary at all: a low-trust user could publish an agent other teams run in production, or bind a privileged connector to a brand-new agent.
How it works
> Author, publish, and execute are three permissions, not one. A developer can build agents in their project without being able to publish one account-wide or run someone else's; each is a separate grant.
> Attaching a connector is gated on its own. Binding a privileged MCP connector to an agent is a distinct permission, so a low-trust user can't smuggle broad access in the back door.
> Enforced server-side, across account, org, and project. The UI hiding a button is never the source of truth.
In plain terms. A print shop. One badge lets you design a poster. A different, harder-to-get badge lets you put it on the wall where everyone sees it. And a third decides who's allowed to run the press. Nobody gets all three just for walking in.

Pipeline OPA policies, extended to agent definitions at save and trigger time
The gap it closes
RBAC says who may build and run an agent. But it can't express a rule about the agent's content: which model it uses, which connectors it may attach, how many turns it may take. A security team wants to write that rule once and have every agent obey it, no matter who authors it: "only approved models," "this connector is off-limits," "cap agents at ten turns," "names must follow our standard." Without it, every guardrail is per-agent and easy to miss.
How it works
Harness has governed pipelines with Open Policy Agent for years: Policy-as-Code that evaluates a pipeline against your rules at save and run time and blocks or warns on a violation. Agents are a pipeline construct, so they inherit the same engine. That policy surface now reads agent definitions too:
> Model restrictions: which model connectors an agent may use.
> Connector restrictions: which MCP connectors may be attached.
> Guardrail limits: caps like maximum turns, so it can't loop unbounded.
> Naming and sensitive variables: standards enforced, sensitive inputs kept out.
> Permission boundaries: flagging high-blast-radius verbs for explicit sign-off.
In plain terms. OPA is the building code that the plans must pass before construction. The gateway is the guard at the door once it's open. You want both: an illegal plan and a person walking out with something they shouldn't have are two different failures.

Keep one distinction straight, because a later control looks similar. OPA checks the definition up front, when the agent is saved or the pipeline is triggered. The MCP gateway (control 4) checks each call inline, as it happens. One stops a bad agent from shipping; the other stops a shipped agent from making a call it shouldn't.
A subset of the parent's grants, on a key that expires with the run
The gap it closes
The easy thing to hand an automated job is a normal token, a personal or service-account key. But those carry every permission their owner has. Give one to an agent that only needed to run one pipeline and you've handed it the whole keyring, and a leak spills the entire account.
How it works
> You can't grant what you don't have. At mint time, every requested permission is checked against the parent's own access: ask for something the parent can't do and creation fails. A scoped token can only ever narrow, never widen.
> Scope is enforced server-side, on every check. After access control says "yes," a scope filter flips anything outside the token's slice back to "no." Effective access is the overlap of the two.
> Ephemeral, and still you. The token is minted at step start and deleted when the run ends, minutes, not months, yet it resolves to the human who triggered it, so the audit trail names a person, not a faceless bot.
In plain terms. Your building pass opens forty doors. Before an errand, the desk cuts a paper key that opens door twelve, expires tonight, and is logged under your name. The runner can open door twelve, nothing else. Tomorrow it's scrap.

Effective access = what the parent has AND what the token was cut for. Whichever is smaller wins.
The token comes in two shapes, with the same scoping rules but different lifespans. Ephemeral is the default for pipeline agents: born at step start, bulk-deleted when the run ends, with no cleanup to forget. Persistent is user-created for standing needs (a CI job that only pulls one registry): longer-lived, but still just its declared slice, and revocable like any key.
Connector and agent allow-lists, enforced as an intersection
The gap it closes
Say two agents share one Jira connector: CI AutoFix needs to create issues, Vulnerability Remediation only needs to read them. Left alone, both can call every tool the Jira MCP server exposes, including delete_issue and transition_issue, because a connector has no tool restrictions by default. The scoped token bounds that Harness resources the agent reaches; it says nothing about which tools it may call on a third-party server. That's a separate leash.
How it works
> The connector declares what may flow through it at all. An admin sets the connector's tool allow-list once (get_issue, add_comment, search_issues) plus the list of agents approved to use it.
> Each agent declares the narrower set it needs. On the same connector, the read-only agent lists only the read tools; the AutoFix agent lists the write ones, so the same bot has different reach depending on which agent is calling.
> The gateway allows only the intersection. The effective set for any call is connector.allowedTools ∩ agent.allowedTools. A tool in the overlap proceeds; anything outside is blocked and logged before the call ever leaves Harness.
In plain terms. The connector is the toolbox the shop owns; the agent's list is what this worker signed out today. The gate only lets out what's on both lists. Grab for anything else, and it stops you at the door.

allowed = connector.allowedTools ∩ agent.allowedTools. Only tools on both lists reach the server.
The check runs outside the agent, so a prompt injection that hijacks the agent can't switch it off. It's centrally governed: change a connector's allow-list once, and every agent picks it up. The agent never holds the connector's real credentials either; the gateway attaches it on the way out.
Every tool call is bound to a principal, a run, and a result
The gap it closes
A pipeline runs at 2 am; the next morning, a few Jira tickets have changed. The run log says the pipeline ran and the agent step completed, but it does not say which tools it called, with what parameters, or which tickets it touched. Worse, the third-party system attributes the change to whoever created the connector months ago, not to this run. Authorization can be perfect, and you're still blind to what happened.
How it works
Authorization and attribution are different jobs: one decides whether an action is allowed, the other records who is answerable for it. A system can nail the first and fail the second, so every outbound tool call emits a structured record, not a buried log line, but fields you can query:
> Which agent made the call, and which run did it belong to?
> Which principal it acted as: the real human who triggered it, preserved through the scoped token.
> Which tool was called, with what parameters, and what result came back?

Because the scoped token carries the real identity all the way through, each record names the person behind the run, not just the agent. When something looks off, you read the record instead of cross-referencing timestamps by hand.
Both the RBAC layer and the scoped token use the same grammar, and it isn't a coarse role like "deployer." A grant is a resource type bound to an explicit set of verbs, optionally narrowed to named resource IDs and a scope. It maps one-to-one onto Harness's existing permission identifiers, so an agent grant reads exactly like a human role binding.
Each grant is scoped to an account, org, or project, and can even name specific resource IDs. Amber verbs are the high-blast-radius ones (create, edit, delete, push); they're default-deny for agents and have to be asked for on purpose. The catalog spans every Harness module: deployments, GitOps, infrastructure-as-code, security, cost. A real agent grant is a handful of these lines, never the whole list.
Put the five together, and the model collapses into one sentence: an agent's real power is the overlap of everything that had to say yes, and everyone defaults to no. Miss any one, RBAC, OPA, the scoped token, the gateway intersection, attribution, and the action doesn't happen. That overlap is deliberately tiny: far smaller than the owner's full access, on a key that expires with the job.
This is the same instinct as the isolation post, applied to a different failure mode. Isolation shrinks what a compromised agent can reach; permissions shrink what a trusted one can reach. Both assume the reach will be abused and make it as small as the job allows, enforced by the platform, never by the model's judgment.
Five controls, two phases. An agent's effective reach is the intersection of all five, and every one defaults to deny.
One tool call, from the agent's goal to the result. Two gates clear before it runs, two check the call itself, and one records what happened afterward, all five in sequence.
Two gates before the run, two on every call, one record after. None of them ask the model to be trustworthy.
You don't mint tokens, configure scope filters, or wire the gateway by hand. You declare the agent's permission set and tool allow-list on the stage spec; the platform mints the ephemeral scoped token, enforces the intersection at the gateway, and revokes the token when the run ends. A least-privilege "deploy and reconcile" agent looks like this:

No create, no delete, no secret access, and only two Jira tools. The agent can ship, reconcile, and comment, but it can't rewrite a pipeline, read a credential, or delete an issue, even though the person who triggered it might. The grant is checked at save time against that person's access and your OPA policy, so an over-privileged agent never ships.
Whose identity does the agent act as? The person who triggered the run. A scoped token still resolves to that user, so every action the agent takes is attributed to them in the audit log. The agent borrows the identity for reach; it doesn't get one of its own.
Can an agent ever end up with more access than the person running it? No. Its effective access is the overlap of what its grant asked for and what its triggering user actually has, whichever is smaller. The mint step verifies every requested permission against the parent's access first, so a grant can only ever subtract from what the human could already do, never add to it.
What happens to the token when the run ends? For a pipeline agent it's deleted. The token is ephemeral and tied to the execution: when the run finishes, every token it spawned is bulk-deleted. Lifetime is minutes, capped at a day, so a leaked one is expired and worthless almost immediately.
Is this enforced, or just hidden in the UI? Enforced on the server. Every permission check goes through one place, and the scope filter runs there, after normal access control, flipping anything outside the token's slice back to denied. Hiding a button changes nothing; the API, the console, and the agent all get the same answer.
How does a new team member avoid shipping an over-privileged agent? The grant is declarative YAML, checked before the agent runs. Ask for permission the triggering principal doesn't have, and it fails fast, naming the missing grant, instead of silently succeeding with too much or silently failing at runtime with too little.
Where does this sit next to isolation and the LLM gateway? Isolation (the first post) contains a compromised agent; permissions (this post) bound a well-behaved one. The behavioral layer, reading prompts and responses for injection and sensitive data, is the third part and its own post. Three parts, one goal: the agent's reach is decided by the system, not the model's judgment.


Infrastructure as Code (IaC) has transformed how teams manage environments, but let’s be honest: when something breaks, debugging can feel like searching for a needle in a YAML haystack.
If you’re working with Ansible, you already know its power: agentless automation, declarative playbooks, and consistent deployments. But even the most elegant playbooks can fail due to syntax issues, variable conflicts, or unexpected runtime behavior.
That’s where a structured debugging approach and modern platforms like Harness come in. With solutions like Harness Infrastructure as Code Management, teams gain visibility, governance, and control over IaC workflows at scale, enabling faster, more reliable troubleshooting.
Ansible is designed for simplicity, but real-world environments are anything but simple. Debugging is essential because:
Common challenges include variable interpolation problems, connection errors, and inconsistent execution across hosts.
Without proper debugging, these issues can slow down deployments, introduce risk, and waste engineering time.
Before debugging, you need to understand how Ansible works:
When something fails, it’s crucial to pinpoint where in this hierarchy the issue occurs. Understanding execution flow helps you isolate problems faster and avoid guesswork.
The fastest way to catch issues? Validate your YAML before execution.
ansible-playbook --syntax-check playbook.ymlThis catches:
Syntax errors are one of the most common causes of failure, so never skip this step.
Ansible provides built-in verbosity flags that reveal what’s happening under the hood:
ansible-playbook playbook.yml -v
ansible-playbook playbook.yml -vv
ansible-playbook playbook.yml -vvv
ansible-playbook playbook.yml -vvvvEach level gives you deeper visibility:
This is often the quickest way to identify where things go wrong.
The debug module is your best friend when troubleshooting.
It allows you to:
- name: Debug variable
debug:
var: my_variableYou can also display custom messages:
- name: Print message
debug:
msg: "Deployment started"This helps you verify that variables are set correctly and tasks are executing as expected.
Want to test changes without impacting systems?
Use check mode:
ansible-playbook playbook.yml --checkThis simulates execution and shows what would change without actually applying it.
It’s ideal for:
Ansible includes an interactive debugger that triggers when tasks fail.
You can enable it like this:
- name: Example task
command: /bin/false
debugger: on_failedWhen a task fails, the debugger allows you to:
This eliminates the need to rerun the entire playbook repeatedly.
Many issues stem from incorrect variables or templating.
Common problems include:
Use debug statements to inspect variables:
- debug:
msg: "{{ my_variable }}"Or check if variables exist:
when: my_variable is definedUnderstanding variable behavior is critical for reliable playbooks.
Registered variables capture task results, which can be incredibly useful.
Example:
- name: Run command
command: ls
register: result
- debug:
var: resultThis shows:
It’s especially useful when debugging conditional logic or failures.
Connection problems are another common culprit.
To debug:
You can also enable:
ANSIBLE_KEEP_REMOTE_FILES=1This keeps temporary scripts on remote machines for inspection.
Large playbooks are harder to debug.
Best practice:
You can use:
ansible-playbook playbook.yml --stepThis lets you execute tasks interactively, one at a time.
Logging is essential for long-term debugging.
You can configure logging in Ansible.cfg:
[defaults]
log_path = /var/log/ansible.logLogs help you:
Sometimes, you only want debug output under certain conditions.
Example:
- debug:
msg: "Variable is set"
when: my_variable is definedThis reduces noise while still providing useful insights.
Let’s look at frequent issues:
The most effective teams follow a structured approach:
This ensures you move from simple checks to deeper analysis without wasting time.
While native Ansible tools are powerful, they can become difficult to manage at scale, especially across multiple environments and teams.
That’s where Harness Infrastructure as Code Management comes in.
With Harness, teams can:
Instead of chasing errors across logs and CLI outputs, Harness provides a single pane of glass for managing and troubleshooting infrastructure.
To avoid recurring issues, follow these best practices:
Consistency and structure are key to reliable automation.
Structured Ansible debug and delivery practices transform reactive firefighting into proactive problem-solving. When you standardize verbosity levels, conditional output, and failure analysis, you cut mean time to resolution and stop scrolling through endless logs hunting for clues.
Those same debugging patterns that help you isolate failures manually become the intelligence that drives automated pipeline decisions. Smart platforms use your codified failure conditions, rollback triggers, and health checks to make deployment decisions without human intervention. Teams that systematize their debugging insights can focus on building features instead of babysitting deployments.
Ready to turn those debugging skills into automated safety nets? Harness Infrastructure as Code Management delivers AI-powered verification, automatic rollbacks, and GitOps workflows that eliminate the guesswork from production deployments.
These five questions address the debugging bottlenecks that turn 5-minute fixes into hour-long investigations. Each answer provides tested patterns that cut time-to-resolution.
Use -vv for task-level details and connection info. Reserve -vvv for module arguments and package manager chatter. Use -vvvv only when you need SSH transport debugging. In CI, pair verbosity with --limit to constrain output and keep log budgets manageable.
Never use debug: var= with secret variables directly. Instead, print only non-sensitive metadata, such as key names or lengths. Use Ansible Vault for encryption and use your CI platform's secret management. Harness handles secret injection safely in pipeline runs.
Use --limit hostname to isolate the problematic host. Enable the task debugger with ANSIBLE_ENABLE_TASK_DEBUGGER=True for interactive inspection. Compare gathered facts between working and failing hosts to identify configuration drift or missing dependencies.
Shell and command tasks default to changed: true regardless of whether there are actual changes. Define explicit changed_when conditions, such as changed_when: result.rc == 0 and 'updated' in result. stdout. Use --check and --diff modes to preview changes before execution.
Structure output with JSON formatting and redirect to files. Archive stdout, stderr, and diff outputs as build artifacts. Harness pipelines can capture these automatically and attach them to PR checks. Harness CD extends this with AI verification and automated rollback based on deployment artifacts.


DevOps solutions are the tools and platforms that help teams build, test, secure, deploy, monitor, and manage software throughout the software delivery lifecycle. While DevOps is often associated with CI/CD, modern DevOps software supports a much broader set of capabilities, including infrastructure automation, security, observability, testing, and developer self-service.
Organizations can adopt individual point tools for specific functions or use integrated DevOps platforms that bring multiple capabilities together. Point tools typically focus on a single capability, while integrated DevOps platforms combine multiple functions into a unified experience.
Quick Facts
Engineering teams have more DevOps solutions to choose from than ever before. CI/CD platforms, infrastructure automation tools, security scanners, observability platforms, and developer productivity solutions all promise faster software delivery. Yet for many organizations, adding tools has not necessarily made delivery simpler.
As software delivery environments grow, so does the operational burden of managing integrations, permissions, workflows, and governance across multiple systems. By 2027, most organizations will shift from multiple point solutions to unified platforms to streamline application delivery, reversing where the majority sat in 2023.
Choosing a DevOps stack is no longer just a tooling decision. It is an architectural decision that affects developer productivity, operational efficiency, governance, and the ability to scale software delivery over time. This guide explores the different types of DevOps solutions and the criteria teams should use when evaluating the right stack for their needs.
The capabilities listed above do not carry equal weight. Most teams already have access to CI/CD tools, security scanners, monitoring platforms, and infrastructure automation frameworks. The real question is whether those capabilities work together to improve software delivery.
When evaluating DevOps solutions, focus on six areas:
Beyond features, consider the long-term operational impact of each option. Integration maintenance, onboarding effort, licensing costs, and platform administration all contribute to the total cost of ownership. A tool that solves one problem today can create additional complexity as teams, applications, and delivery requirements grow.
Quick Tip: The lowest-cost DevOps tool isn't always the most cost-effective option. As teams scale, integration, maintenance, platform administration, and operational overhead can outweigh initial licensing savings.
Having the right capabilities is only part of the decision. Teams must also determine whether those capabilities should come from a unified platform or a collection of specialized devops software tools.
Most organizations choose between two approaches: adopting a unified DevOps platform or assembling a best-of-breed toolchain. The right choice depends on factors such as team size, operational complexity, compliance requirements, and internal engineering resources.
The same trade-offs apply when evaluating open source and commercial solutions. Open source tools often provide flexibility and community-driven innovation but may require additional expertise to deploy, integrate, and maintain. Commercial platforms typically offer enterprise support, built-in integrations, and streamlined administration in exchange for licensing costs.
Deployment models also influence tool selection. Cloud-native solutions are often preferred for scalability and faster adoption, while on-premise deployments remain common in highly regulated industries with strict security, compliance, or data residency requirements.
The best DevOps solution is not defined by a single category. It depends on how well the chosen approach aligns with your team's delivery model, governance needs, and long-term operational strategy. The same DevOps approach rarely works equally well across organizations. A startup focused on shipping quickly faces a different set of constraints than an enterprise managing hundreds of developers, compliance requirements, and complex delivery pipelines.
The same DevOps solution can be a great fit for one organization and a poor fit for another. Team size, delivery complexity, and operational requirements often have a greater impact on tool selection than feature lists.
Regardless of company size, engineering leaders should evaluate every DevOps solution against a few practical questions:
Vendor lock-in should also be part of the evaluation process. The deeper a tool becomes embedded in deployment pipelines, security controls, and developer workflows, the more difficult and costly it becomes to replace. Many DevOps initiatives run into trouble not because teams chose the wrong solution category, but because critical considerations such as workflow design, governance, and developer adoption were overlooked during implementation.
Even well-intentioned DevOps initiatives can create new challenges when tooling decisions are made in isolation.
Reducing operational overhead is one reason many organizations are rethinking fragmented DevOps toolchains in favor of platform-based approaches.
As software delivery becomes more complex, many organizations are looking for ways to improve engineering efficiency without adding operational overhead. DORA research (State of AI-assisted Software Development 2025) finds that software delivery performance predicts organizational performance and employee well-being, reinforcing the need for tools that help teams deliver software reliably and at scale.
Harness brings key software delivery capabilities together in a unified, AI-powered platform. Teams can automate build and test workflows with Harness CI, streamline deployments using Harness CD, and gain visibility into engineering productivity and delivery metrics through AI DLC Insights.
Cost efficiency is becoming equally important. According to the FinOps Foundation, 45% of organizations spending more than $100 million annually on cloud report that AI and machine learning are having a rapidly increasing impact on their FinOps practices. Harness Cloud & AI Cost Management (CACM) helps teams understand, optimize, and govern cloud spending alongside their software delivery workflows, reducing the need to manage disconnected tools across the engineering ecosystem.
Organizations evaluating DevOps solutions often face the same challenge: balancing delivery speed, governance, visibility, and operational overhead. The following examples show how different teams approached those challenges.
Ancestry managed software delivery across more than 80 Jenkins instances, with each team following a different deployment process and governance practice. After adopting Harness CI/CD, the company onboarded 350 systems in its first year, increased deployment frequency 3x, and achieved an 80-to-1 reduction in the effort needed to roll a change out across every pipeline.
“Harness now empowers Ancestry to implement new features once and then automatically extend those across every pipeline, representing an 80-to-1 reduction in developer effort.”
Ken Angell, Principal Architect, Ancestry
Source: Ancestry adds consistency and governance to cut downtime
United Airlines needed stronger governance across software delivery without slowing development teams. Choosing Harness for CI and CD let the airline shift security and governance left, giving developers self-service deployment within guardrails instead of waiting on manual review. United reported 75% efficiency gains and cut CI build times for one application from 22 minutes to under 5.
“By choosing Harness for CI and CD, we were able to give the governance policies to the developers and create the guardrails we needed. Harness gives us a platform rather than just a DevOps tool.”
Ratna Devarapalli, Director of IT, Architecture, Platform Engineering and DevOps, United Airlines
Source: United Airlines accelerates deployments with Harness
Tyler Technologies, the largest SaaS vendor solely focused on the U.S. public sector, ran client test environments around the clock even when most sat idle outside business hours. Reorganizing its cloud estate by client time zone and activity pattern and applying Harness Cloud Cost Management's AutoStopping let Tyler power down idle environments automatically. The result: $1.2 million in annualized cloud cost savings.
“Cloud AutoStopping opened up new possibilities for cloud cost management. We saw how reorganizing our deployments by geography, function, and use patterns could unlock game-changing savings.”
Chris Camire, Senior Manager of Technical Services, Tyler Technologies
Source: Tyler Technologies reaches $1.2M annualized cost savings with Harness Cloud Cost Management
The capabilities matter less than how well they fit together. A long feature list does not tell you whether a tool will reduce operational complexity or add to it, and the gap between those two outcomes is where most DevOps initiatives succeed or stall.
Map your own delivery workflow first, then evaluate DevOps solutions against integration, governance, scalability, and total cost, not a checklist of capabilities.
See how Harness brings CI, CD, security, and cost management onto one AI-powered platform.
Common DevOps tools include CI/CD platforms, source code repositories, infrastructure-as-code (IaC) tools, observability platforms, security scanners, and cloud cost management solutions. Popular examples include GitHub, GitLab, Jenkins, Terraform, Kubernetes, Datadog, and Harness.
The best DevOps software for small teams is typically easy to adopt, requires minimal administration, and supports multiple stages of the software delivery lifecycle. Many smaller organizations prefer integrated platforms to reduce the overhead of managing multiple tools and integrations.
Start by defining your software delivery workflow. Then identify the capabilities needed to support it, including source control, CI/CD, infrastructure automation, security, observability, and cost management. Select tools that integrate well together and can scale as your requirements evolve.
DevOps tools typically solve a specific problem, such as source control, testing, or monitoring. A DevOps platform brings multiple software delivery capabilities together in a unified environment, reducing integration complexity and improving visibility across workflows.
It may be time to reevaluate your DevOps solution if teams are spending significant effort maintaining integrations, onboarding new tools, addressing visibility gaps, or managing operational complexity. Frequent workflow bottlenecks and growing governance requirements are also common indicators.
A unified platform trades some flexibility for governance and simplicity; teams that need a specific best-of-breed tool for a narrow use case may find a platform's built-in version less specialized. The right test is whether the platform covers enough of your delivery lifecycle to retire the point tools it replaces, not whether it matches every feature in isolation.
Need more info? Contact Sales