Blog
Resilience Testing

How to Test Application Resilience Under Load with K6 and Chaos Engineering | Harness Blog

Test your app’s resilience under load using Grafana K6 and Harness Resilience Testing—best practices and real-world Kubernetes example.

TL;DR

  • Resilience testing measures how reliably your business services perform when system components fail temporarily under high load, revealing issues that performance testing alone cannot detect.
  • Load testing validates throughput and response times at scale, but combining it with chaos engineering reveals how your application behaves when critical dependencies fail during peak traffic.
  • Grafana K6 generates realistic user traffic patterns while Harness Resilience Testing injects controlled failures such as network latency, pod deletions, and API errors to simulate production incident scenarios.
  • Resilience probes define your steady-state hypothesis by continuously monitoring service latency, replica counts, and query performance throughout chaos experiments, producing a quantifiable resilience score.

In the real world, high traffic doesn’t arrive alone, it brings chaos with it.

Imagine your eCommerce site during a Black Friday sale. Users are flooding in, carts are filling up, and payment gateways are firing requests by the second. Your team has tested for load, and everything looks good in isolation. But what happens if the checkout service experiences latency, or the cart service pod restarts mid-transaction? Will customers still be able to check out? Will your system fail gracefully—or just fail?

This is where combining load testing with chaos engineering becomes critical.

Load testing validates performance under pressure. Chaos engineering ensures your app behaves reliably when key components fail, slow down, or misbehave—at the exact moment your system is under stress. By running both together, you move beyond just preparing for scale—you prepare for reality.

Let’s walk through a specific step by step guide!

Summary

Goal: Measure the resilience score of the Cart service under real-world load by injecting chaos experiments and tracking system health via resilience probes.

Sample Application: Boutique ECommerce Portal

Load Test Tool: Grafana K6, deployed locally at runtime.

Chaos Experiments: Network Loss, Network Latency, Pod Deletes, and HTTP API Status code errors.

Deployment and Test Setup
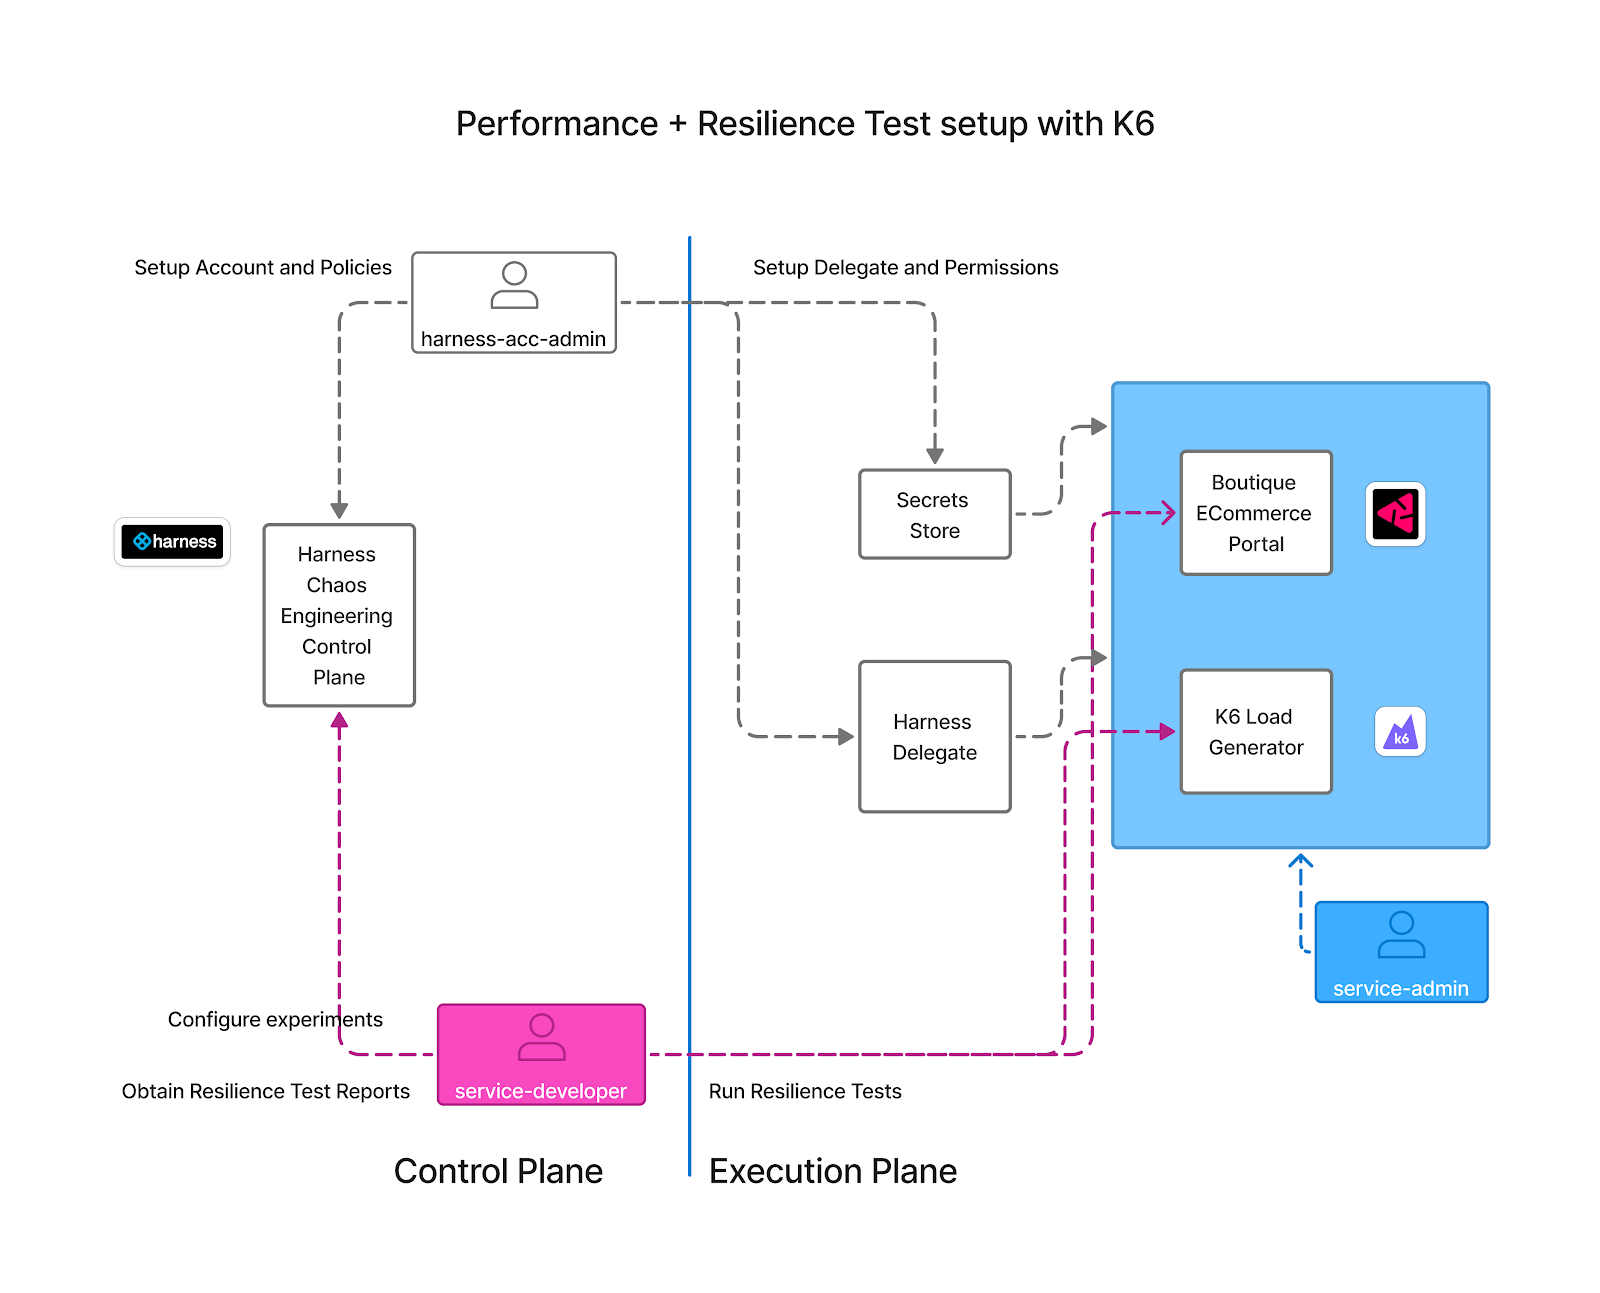
Load and resilience testing together with Harness Chaos Engineering and Grafana K6

As shown above, the policies and experiments are configured on the control plane, and the constructed chaos experiments are sent to the target hosts or clusters on the execution plane. The first step is to get access to the Harness platform.

Get Access to the Platform

Sign up for a free Chaos Engineering on Harness plan that is fully featured and allows you to run a certain number of chaos experiments per month.

Otherwise, if you are a current Harness customer, someone (harness-account-admin) would have invited you to join an existing account at Harness that allows you access to the Chaos Engineering product.

Once you get access through either of the above methods, you can view/create and run chaos experiments along with the load tests. Before we get into the details of setting up and running the specific chaos experiments, it is essential to understand the roles and permissions required to do the proper setup.

We are considering three types of users for this resilience test setup.

  1. Harness Account Administrator (harness-acc-admin)
  2. Kubernetes and Application Administrator (service-admin)
  3. Application developer / Performance tester (service developer)

First, harness-acc-admin configures the required roles for the service developer to create and run the chaos experiments.

Second, the service admin must set up a service account on the target application cluster, which will be used to run the load generation and chaos experiments.

Once the above two roles and permissions are set up, you can create and run the chaos experiments and load generation tasks as an application developer, QA engineer, or performance tester.

Before showing the actual chaos experiments, let's explore the application and the test scenarios in more detail.

The Application and Test Scenario

OnlineBoutique is a sample application we will use in this resilience testing under load scenario. It consists of multiple microservices that interact with each other through simple APIs and store transaction data in a database. The architecture is shown below:
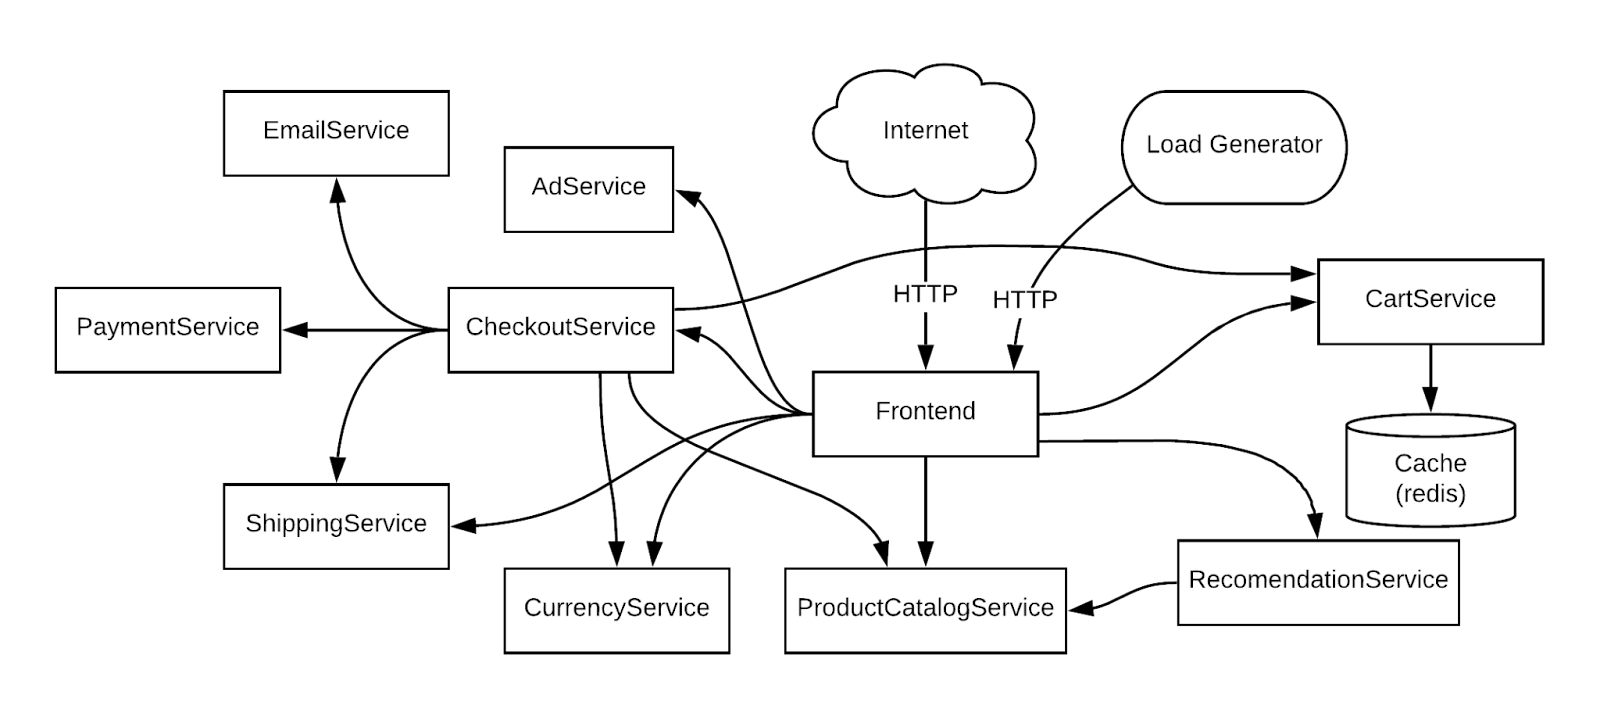
Online Boutique Diagram

In the above diagram, the load generation is done using the Grafana K6 load generation tool. The OnlineBoutique can be set up on various platforms. In the current example, we have set up the application on a Kubernetes platform.

For resilience testing with Harness Resilience Testing CMS Push Instructions: Testing application resilience under load with Grafana K6

Target Post Slug: testing-application-resilience-under-load-with-grafana-k6

Field 1: Title

How to Test Application Resilience Under Load with K6 and Chaos Engineering

Field 7: Key Takeaways

<ul>
<li>Resilience testing measures how reliably your business services perform when system components fail temporarily under high load, revealing issues that performance testing alone cannot detect.</li>
<li>Load testing validates throughput and response times at scale, but combining it with chaos engineering reveals how your application behaves when critical dependencies fail during peak traffic.</li>
<li>Grafana K6 generates realistic user traffic patterns while Harness Resilience Testing injects controlled failures such as network latency, pod deletions, and API errors to simulate production incident scenarios.</li>
<li>Resilience probes define your steady-state hypothesis by continuously monitoring service latency, replica counts, and query performance throughout chaos experiments, producing a quantifiable resilience score.</li>
</ul>

Field 20: FAQ

<h2>Frequently Asked Questions</h2>

<h3>What does application resiliency mean?</h3>
<p>Application resiliency is the ability of software to maintain core functionality during unplanned disruptions like component failures, network latency, or sudden traffic spikes. Resilient systems detect failures automatically, recover gracefully through fallback mechanisms, and minimize user impact without causing full outages. Unlike simple uptime, resiliency focuses on how well your application adapts when things go wrong.</p>

<h3>How to improve application resiliency?</h3>
<p>Improve resiliency by regularly testing systems under realistic failure conditions using chaos engineering. Inject faults like pod restarts, network delays, and resource exhaustion while monitoring service health with resilience probes. Automate recovery processes, implement retry logic and circuit breakers in your code, and validate resilience continuously in your CI/CD pipeline rather than waiting for production incidents to reveal weaknesses.</p>

<h3>What is the difference between load testing and resilience testing?</h3>
<p>Load testing validates performance under high traffic volumes by measuring throughput, response times, and resource utilization at scale. Resilience testing injects failures during that load to measure how well your system detects issues, recovers, and maintains service continuity. Combining both approaches reveals whether your application can handle Black Friday traffic levels while a key microservice crashes or experiences latency.</p>

<h3>How resilient should your load tests be?</h3>
<p>Resilience testing under load should simulate realistic failure scenarios your production environment faces: network latency between microservices (50-200ms delays), pod restarts during deployments, API timeouts from downstream services, and resource exhaustion. Target resilience scores above 80% where critical probes pass even when chaos is injected under peak load, ensuring your most important user journeys remain functional during incidents.</p>

<h3>What tools do I need for resilience testing on Kubernetes?</h3>
<p>You need three components: a load generator like Grafana K6 to create realistic traffic patterns, a chaos engineering platform like Harness to inject controlled faults (pod deletes, network chaos, resource stress), and observability tools like Prometheus or Datadog to monitor service health via resilience probes that validate your steady-state hypothesis throughout experiments.</p>

Field 19: Structured Data Field (SEO)

{  "@context": "https://schema.org",  "@type": "FAQPage",  "mainEntity": [    {      "@type": "Question",      "name": "What does application resiliency mean?",      "acceptedAnswer": {        "@type": "Answer",        "text": "Application resiliency is the ability of software to maintain core functionality during unplanned disruptions like component failures, network latency, or sudden traffic spikes. Resilient systems detect failures automatically, recover gracefully through fallback mechanisms, and minimize user impact without causing full outages. Unlike simple uptime, resiliency focuses on how well your application adapts when things go wrong."      }    },    {      "@type": "Question",      "name": "How to improve application resiliency?",      "acceptedAnswer": {        "@type": "Answer",        "text": "Improve resiliency by regularly testing systems under realistic failure conditions using chaos engineering. Inject faults like pod restarts, network delays, and resource exhaustion while monitoring service health with resilience probes. Automate recovery processes, implement retry logic and circuit breakers in your code, and validate resilience continuously in your CI/CD pipeline rather than waiting for production incidents to reveal weaknesses."      }    },    {      "@type": "Question",      "name": "What is the difference between load testing and resilience testing?",      "acceptedAnswer": {        "@type": "Answer",        "text": "Load testing validates performance under high traffic volumes by measuring throughput, response times, and resource utilization at scale. Resilience testing injects failures during that load to measure how well your system detects issues, recovers, and maintains service continuity. Combining both approaches reveals whether your application can handle Black Friday traffic levels while a key microservice crashes or experiences latency."      }    },    {      "@type": "Question",      "name": "How resilient should your load tests be?",      "acceptedAnswer": {        "@type": "Answer",        "text": "Resilience testing under load should simulate realistic failure scenarios your production environment faces: network latency between microservices (50-200ms delays), pod restarts during deployments, API timeouts from downstream services, and resource exhaustion. Target resilience scores above 80% where critical probes pass even when chaos is injected under peak load, ensuring your most important user journeys remain functional during incidents."      }    },    {      "@type": "Question",      "name": "What tools do I need for resilience testing on Kubernetes?",      "acceptedAnswer": {        "@type": "Answer",        "text": "You need three components: a load generator like Grafana K6 to create realistic traffic patterns, a chaos engineering platform like Harness to inject controlled faults (pod deletes, network chaos, resource stress), and observability tools like Prometheus or Datadog to monitor service health via resilience probes that validate your steady-state hypothesis throughout experiments."      }    }  ]}

{
 "@context": "https://schema.org",
 "@type": "FAQPage",
 "mainEntity": [
   {
     "@type": "Question",
     "name": "What does application resiliency mean?",
     "acceptedAnswer": {
       "@type": "Answer",
       "text": "Application resiliency is the ability of software to maintain core functionality during unplanned disruptions like component failures, network latency, or sudden traffic spikes. Resilient systems detect failures automatically, recover gracefully through fallback mechanisms, and minimize user impact without causing full outages. Unlike simple uptime, resiliency focuses on how well your application adapts when things go wrong."
     }
   },
   {
     "@type": "Question",
     "name": "How to improve application resiliency?",
     "acceptedAnswer": {
       "@type": "Answer",
       "text": "Improve resiliency by regularly testing systems under realistic failure conditions using chaos engineering. Inject faults like pod restarts, network delays, and resource exhaustion while monitoring service health with resilience probes. Automate recovery processes, implement retry logic and circuit breakers in your code, and validate resilience continuously in your CI/CD pipeline rather than waiting for production incidents to reveal weaknesses."
     }
   },
   {
     "@type": "Question",
     "name": "What is the difference between load testing and resilience testing?",
     "acceptedAnswer": {
       "@type": "Answer",
       "text": "Load testing validates performance under high traffic volumes by measuring throughput, response times, and resource utilization at scale. Resilience testing injects failures during that load to measure how well your system detects issues, recovers, and maintains service continuity. Combining both approaches reveals whether your application can handle Black Friday traffic levels while a key microservice crashes or experiences latency."
     }
   },
   {
     "@type": "Question",
     "name": "How resilient should your load tests be?",
     "acceptedAnswer": {
       "@type": "Answer",
       "text": "Resilience testing under load should simulate realistic failure scenarios your production environment faces: network latency between microservices (50-200ms delays), pod restarts during deployments, API timeouts from downstream services, and resource exhaustion. Target resilience scores above 80% where critical probes pass even when chaos is injected under peak load, ensuring your most important user journeys remain functional during incidents."
     }
   },
   {
     "@type": "Question",
     "name": "What tools do I need for resilience testing on Kubernetes?",
     "acceptedAnswer": {
       "@type": "Answer",
       "text": "You need three components: a load generator like Grafana K6 to create realistic traffic patterns, a chaos engineering platform like Harness to inject controlled faults (pod deletes, network chaos, resource stress), and observability tools like Prometheus or Datadog to monitor service health via resilience probes that validate your steady-state hypothesis throughout experiments."
     }
   }
 ]
}

PUSH ORDER

  1. Field 1: Title
  2. Field 7: Key Takeaways
  3. Field 20: FAQ
  4. Field 19: Structured Data Field (SEO)

After pushing, verify the live page renders all updated fields correctly.

haos Engineering, the following two things are essential:

  1. Chaos faults and targets: This defines what chaos faults to be injected. In our examples, we will run a K6 load generator using one chaos experiment and run another parallel chaos experiment that does one of the following:
    • Cause network latency between Checkout and PaymentServices
    • Cause network loss between Frontend and CheckoutServices
    • Injects an HTTP error code between Frontend and CartService
    • Delete a pod on the ProductCatalog service
  2. The meaning of resilient state: In chaos engineering terminology, this is also called the "Steady State Hypothesis." In Harness Resilience Testing, resilient states are defined using Resilience Probes. We are considering the following probes.
    • Check if the queries per second on the frontend are less than 2000ms at any time.
    • Check if the latency between the user and frontend is less than 20ms at any time.
    • Check if the number of queries per second on the CartService is less than 1000ms at any time.
    • Check if the pod replica count is the same (2) before and after the chaos execution.
    • Check if the Kubernetes nodes are healthy during the chaos execution.
    • Check if the latency between checkout and frontend is less than 20ms at any time.
    • Check if the latency between the CartService and frontend is less than 20ms at any time.

Step-by-Step Guide

The first steps are signing up at Harness and connecting your application to the Harness control plane.
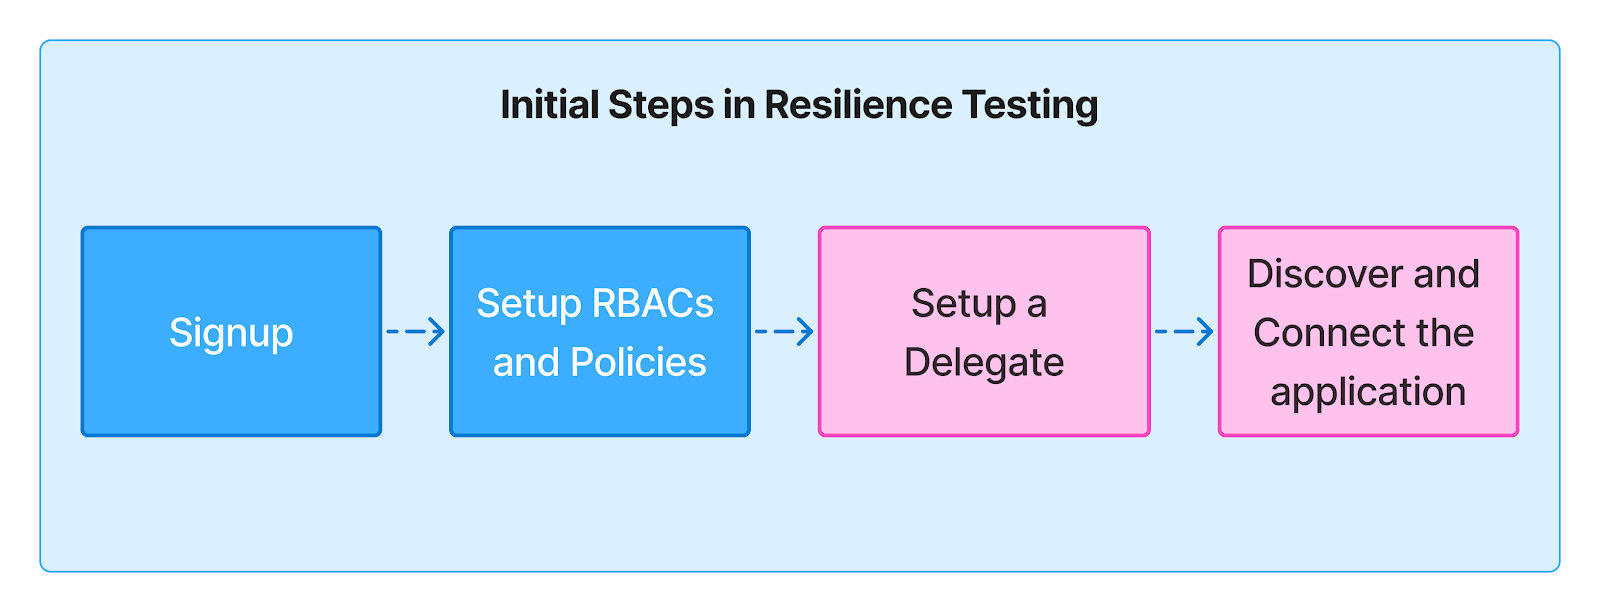
Workflow Steps

Step 1: Signup

Sign up at Harness to access the fully featured FREE Chaos Engineering plan. Alternatively, you may have received an invitation from someone in your organization who can access the Harness trail or enterprise plan. 

In either case, identify your role and others with admin permissions on the Harness control plane and your application’s host/cluster. 

Step 2: RBACs and Permissions
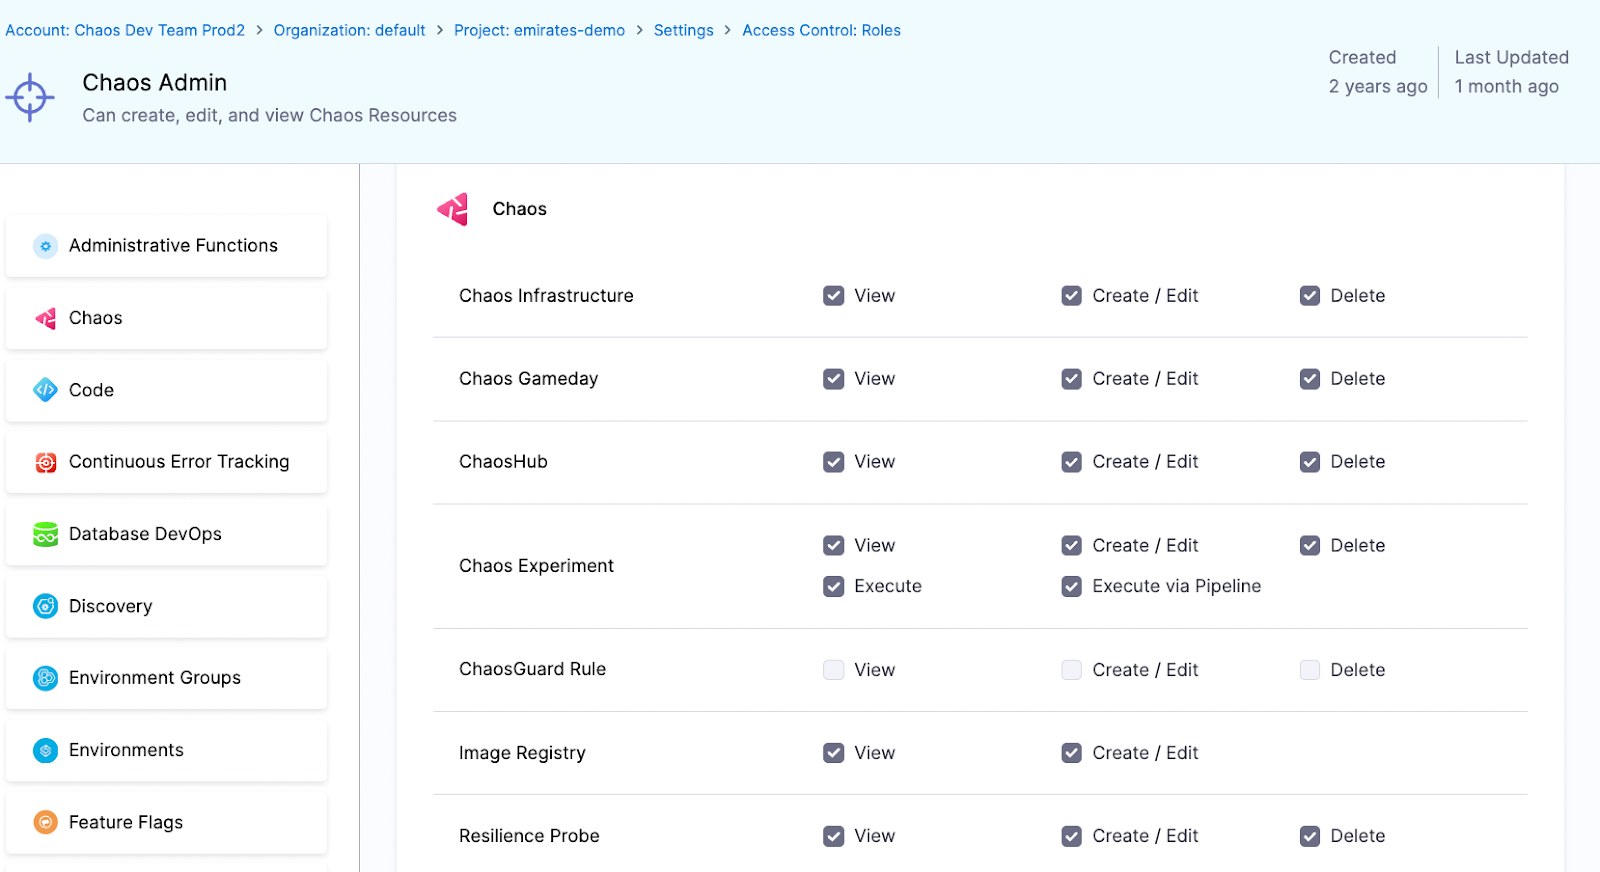
Harness UI of RBAC Permissions

The Chaos Admin role is the easiest way to access the overall Chaos administrative functions. You should also have admin access to the target application cluster to set up the Harness Delegate in the next step, run chaos experiments, and load tests later.

Step 3: Setup a Delegate 

Install the Harness Delegate on one of your Kubernetes clusters with network access to the cluster on which the application (in this case, the OnlineBoutique) is running. For help with the Delegate installation, see this link

Step 4: Discover and Connect your Application 

Harness Resilience Testing provides an easy process for onboarding a chaos agent onto a Kubernetes cluster. Follow this link to discover the resources and automatically create basic chaos experiments.  

Once the control and execution planes are set, specific steps for chaos experiments and load tests are followed.
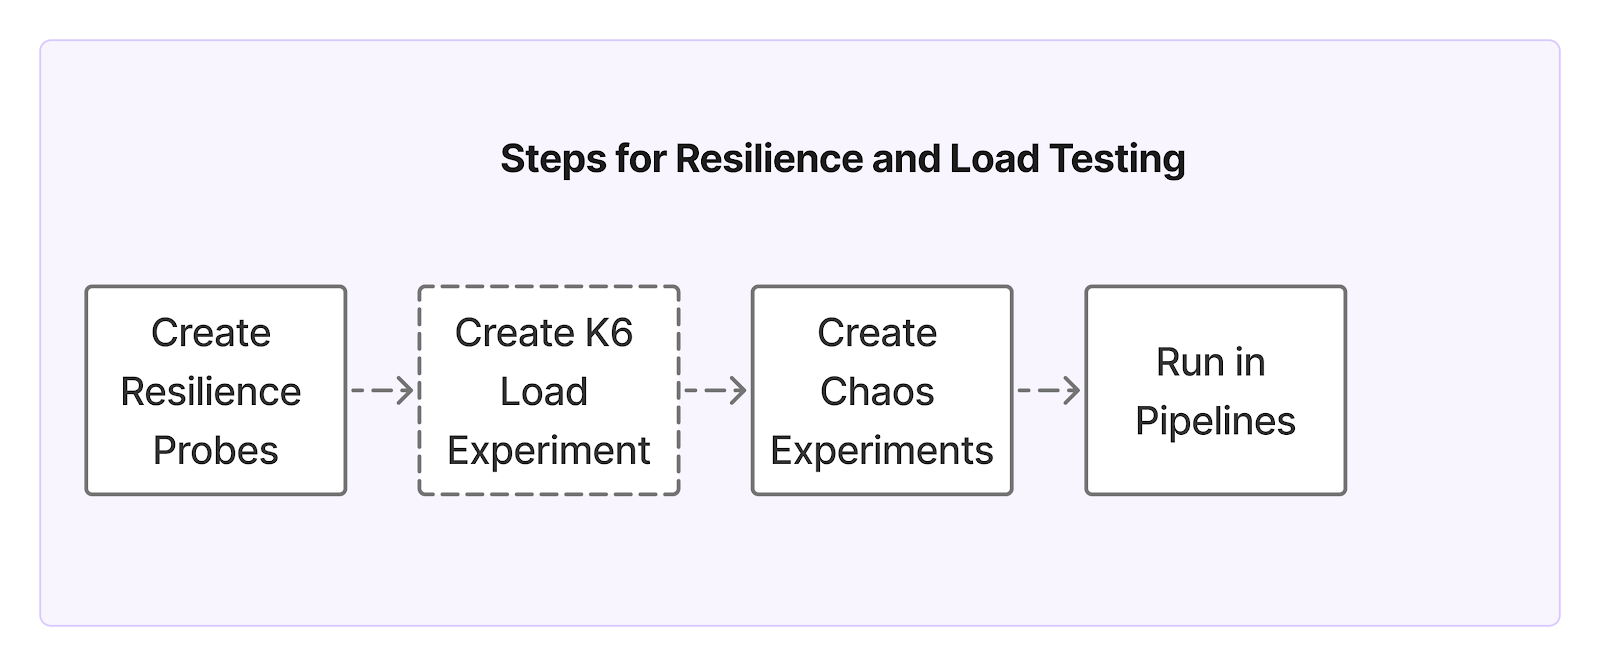
Steps for Resilience and Load Testing

Step 5: Create Resilience Probes

We are using three kinds of resilience probes:

  • Prometheus probe to check the latency of the services.
  • HTTP probe to check if a service is responding to the requests as expected.
  • Command probe that is custom-written for checking the node and replica checks.

Example Prometheus Probe:

The Prometheus probe uses Prometheus query to compute the latency, as shown below.
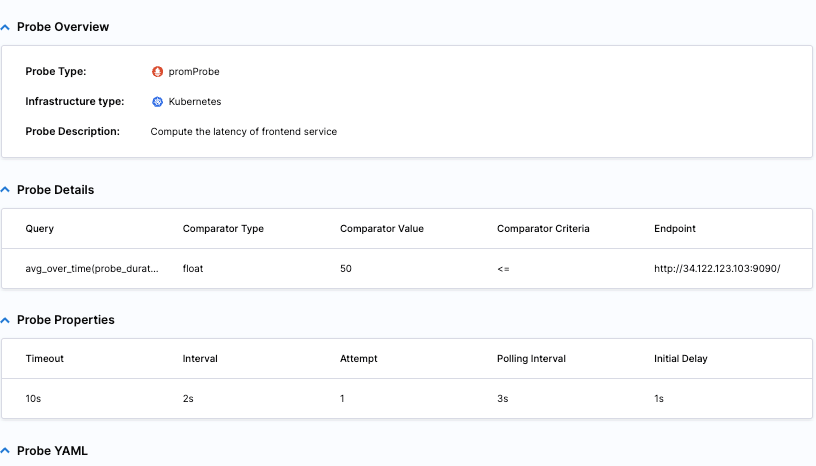
Prometheus Probe Example in Harness UI

name: boutique-frontend-latency-check
type: prom
ProbepromProbe/inputs:  
endpoint: http://XX.XX.XX.XX:9090/  
 query: avg_over_time(probe_duration_seconds{job=\"prometheus-blackbox-exporter\",    
 instance=\"frontend.boutique.svc.cluster.local:80\"}[60s:1s])*1000  
 comparator:    
  type: float    
   criteria: <=    
   value: "50"
runProperties:  
 probeTimeout: 10s  
 interval: 2s  
 attempt: 1  
 probePollingInterval: 3s  
 initialDelay: 1s
mode: Continuous

Example Command Probe:

A command probe that checks the number of pod replicas:
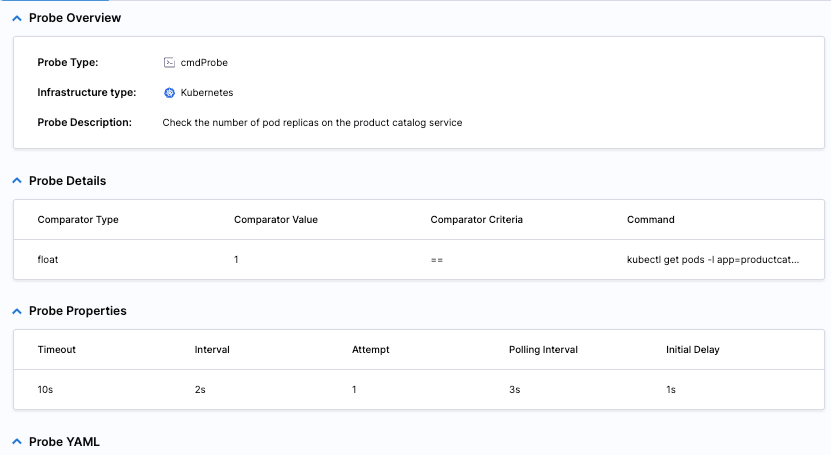
Command Probe in Harness UI

name: productcatalog-svc-replica-check
type: cmdProbe
cmdProbe/inputs:  
command: kubectl get pods -l app=productcatalogservice  -n    boutique  --no-headers | wc -l  
 comparator:    
  type: float    
   criteria: ==    
   value: "1"
runProperties:  
  probeTimeout: 10s  
   interval: 2s  
   attempt: 1  
   probePollingInterval: 3s  
   initialDelay: 1s
mode: Continuous

The list of resilience probes for checking the resilient state of various services is shown below.
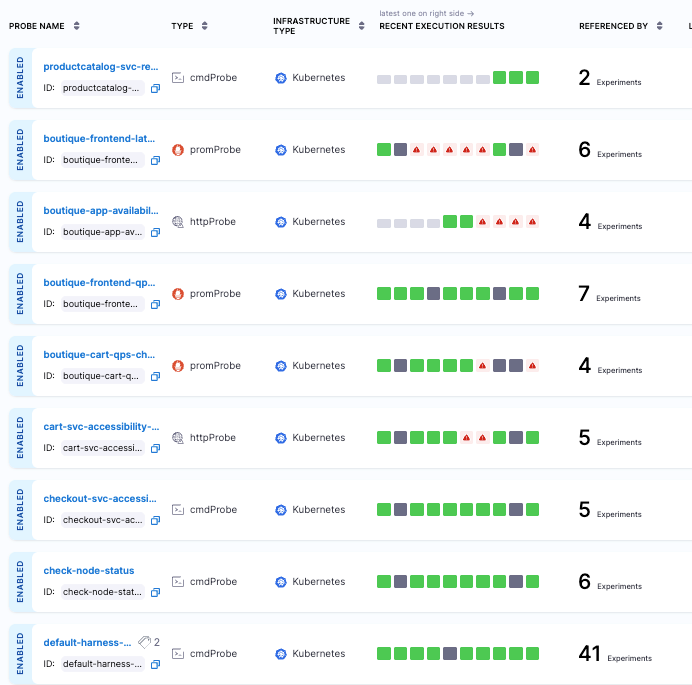
Example of Probes for Resilience Test

Step 6: Create K6 Load Experiment 

The K6 load generator experiment is available as a native chaos fault in the Enterprise ChaosHub of Harness Resilience Testing. It is configured for the load parameters, as shown below.
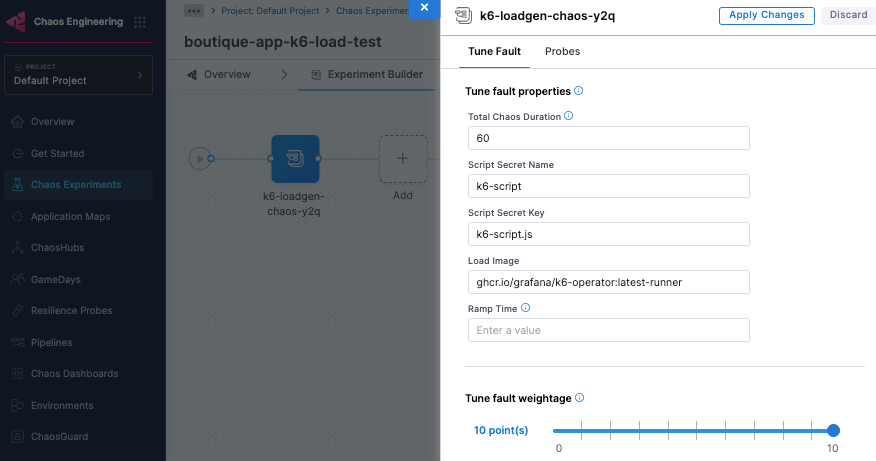
K6 Load Test Fault in Harness UI

‍Step 7:  Create chaos experiments for various scenarios 

The chaos experiments required for test scenarios are constructed from the native chaos faults like:

  • Network Latency
  • Network Loss
  • API Error Code and
  • Pod Delete

The experiments are created using the above faults and tuning them for the targeted services such as Frontend, Checkout, and ProductCatalog in the OnlineBoutique All the resilience probes created above can be attached to each experiment so that the resilient state is checked with each experiment.
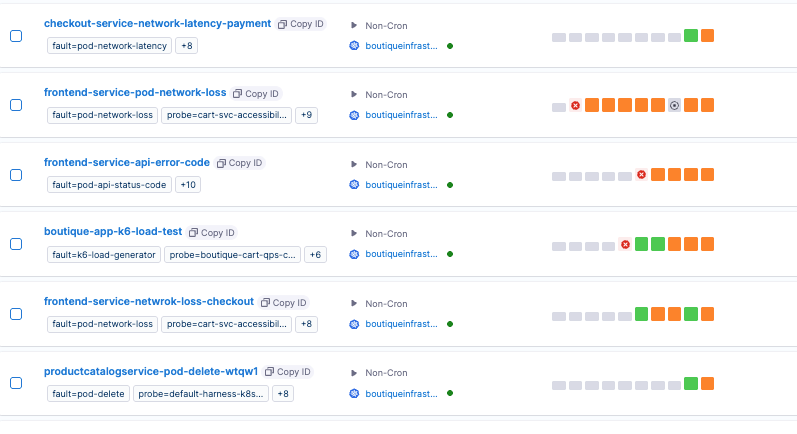
Chaos Experiments in Harness UI

Step 8: Run the load test and chaos test in parallel

The Harness Resilience Testing pipeline capability is used to run parallel chaos experiments. "Chaos Step" pulls a chaos experiment from the user's project into the pipeline stage, as shown below.
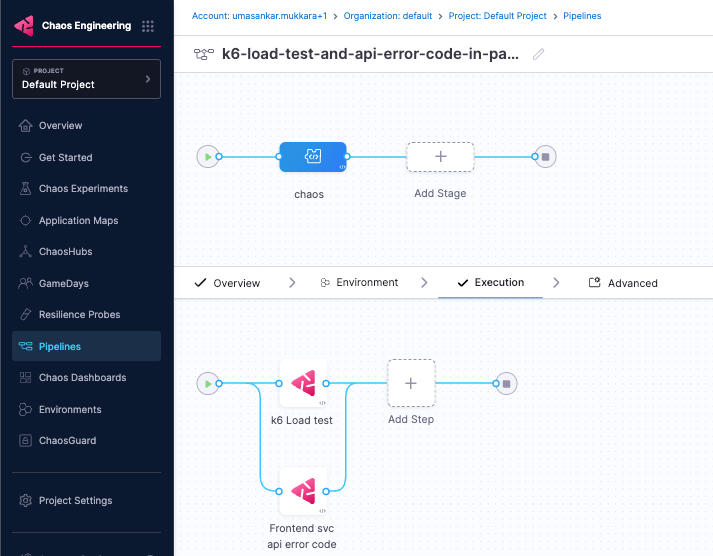
Chaos Test + Load Test in Harness UI

The pipelines can be run manually or through an API.

Observing the resilience test results

From the execution view, you can get the resilience score and the percentage of successful resilience probes when chaos is injected under load. A sample execution view is shown below.
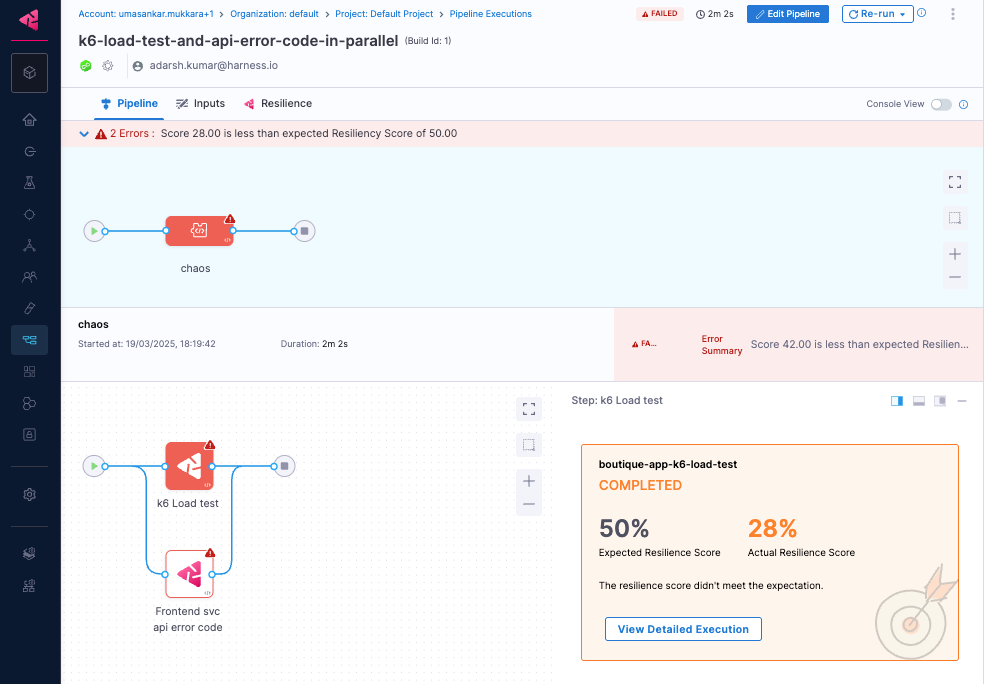
Resilience Score of Test

The summary of resilience probes is shown in the Resilience tab of the pipeline execution view.
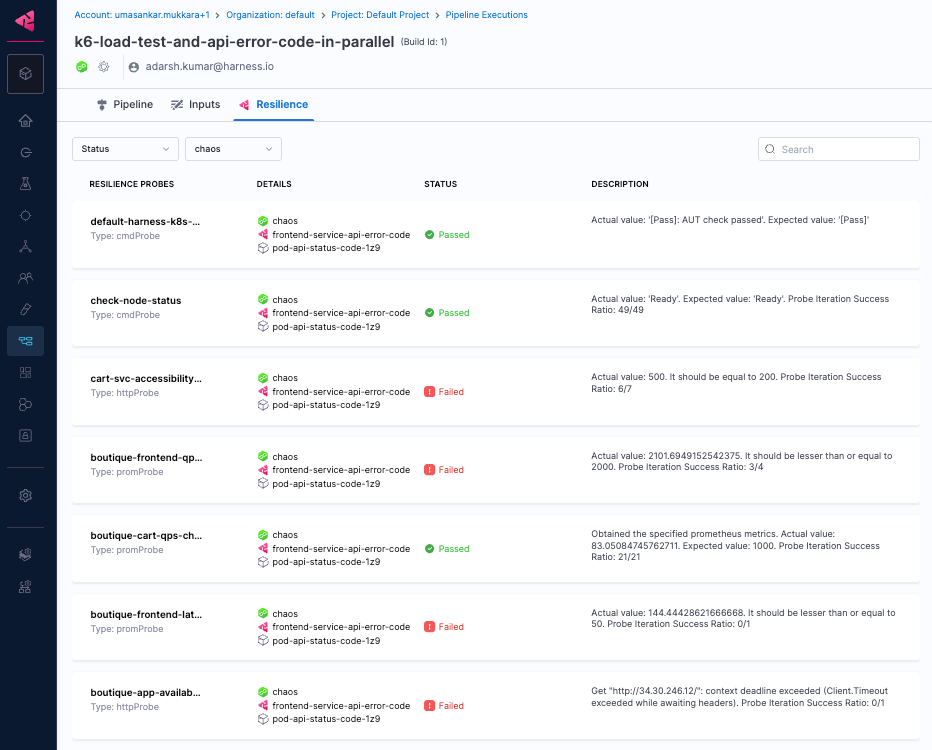
Resilience Probes Results

In summary, chaos experiments and Grafana K6 load tests are created using the out-of-the-box faults and can be run parallel using the pipelines.

Run Your First Chaos + Load Test Now

Ready to see how your systems behave when it matters most?

Sign up for Harness Resilience Testing and start combining real-world failure scenarios with load testing using Grafana K6. Whether you're preparing for your next peak traffic event or hardening your microservices for long-term resilience, this integrated approach helps you move from theory to reality—fast.

🔧 Get Started Free with Harness Resilience Testing
📚 Need help setting up? Check out the Docs
🚀 Already onboard? Try injecting your first chaos experiment with load today and discover your resilience score.


← Previous:
Next: →

FAQs

Related Resources

Linux Resilience Testing with Harness Chaos Engineering

Resilience Testing

Linux Resilience Testing with Harness Chaos Engineering

February 27, 2025

Matt Schillerstrom

+ more
Time to Read

A History of Chaos (Engineering, not the Universe)

Once upon a time, engineers believed that if they built their systems strong enough, nothing would ever fail. Then reality happened. Networks dropped. Servers crashed. Applications froze. And thus, Chaos Engineering was born—not as an act of destruction, but as a method to test things in a controlled way so we can fix them before customers even notice something’s wrong.

The concept gained traction in 2010 when Netflix unleashed Chaos Monkey, a tool that randomly shut down production instances to test resilience. Fast forward to today, and organizations across industries—like Netflix, Amazon, Google, Target, and Harness—are embracing chaos engineering as a core reliability practice to ensure system resilience and uptime.

But what about Linux-based systems—the backbone of modern infrastructure? From cloud servers to on-premises environments, Linux runs the world. And just like any system, it needs to be battle-tested. That’s where Harness Chaos Engineering steps in, providing powerful, safe, and automated resilience testing for Linux environments.

Let’s explore five critical Linux chaos experiments you can run today to harden your applications and infrastructure against failure.

1️⃣ CPU Stress: Can Your System Handle the Heat?

🔥 What happens when your system maxes out its CPU?
Imagine your application is humming along fine—until a sudden traffic spike (or a rogue process) consumes all CPU resources. Will your system stay responsive, or will it grind to a halt?

👉 Test It: The CPU Stress experiment overloads your processor to see how well your system prioritizes critical processes under high CPU usage. Start small configuring it to consume 20% of the CPU and gradually increase to 100%.

Why It Matters: Ensures your services stay responsive during peak loads and prevents CPU starvation.

2️⃣ Memory Stress: Running Out of RAM?

🧠 How does your system behave when memory is depleted?
Memory leaks, inefficient caching, or high loads can lead to Out-Of-Memory (OOM) crashes. This test simulates high RAM consumption to check whether your application can recover or panics and dies.

👉 Test It: The Memory Stress experiment overloads system memory to evaluate how your applications handle OOM conditions gracefully.

Why It Matters: Helps prevent crashes caused by unoptimized memory usage, ensuring smooth operation even under heavy load.

3️⃣ Network Latency: The Internet’s Favorite Saboteur

🌐 What happens when your network slows down?
A microservices architecture is only as strong as its weakest network link. Network latency can quickly degrade performance if your system relies on APIs or external services.

👉 Test It: The Network Latency experiment introduces artificial delays in network traffic, letting you observe how your application behaves under laggy conditions. Start testing with 500ms and gradually increase to find your tipping points of failure.

Why It Matters: Ensures critical functions don’t time out or fail under poor network conditions.

4️⃣ Disk Fill: What Happens When You Run Out of Space?

💾 Does your system gracefully handle full disks?
Running out of storage is a nightmare. Logs, databases, or file uploads can rapidly consume disk space, potentially halting everything.

👉 Test It: The Disk Fill experiment simulates a near-full disk to test how your system reacts when storage resources are depleted.

Why It Matters: This role ensures applications don’t break when storage runs low and verifies cleanup mechanisms, such as automated log rotation, temporary file cleanup, and proactive disk space monitoring, work as expected.

5️⃣ Service Restart: Can Your Apps Recover?

🔄 If a critical service crashes, does it restart smoothly?
In distributed systems, services stop and restart constantly. But what if your app doesn’t handle this well? You could experience cascading failures and extended downtime.

👉 Test It: The Service Restart experiment forcefully stops and restarts a system service, testing how well your application recovers.

Why It Matters: Ensures mission-critical services restart automatically and correctly, minimizing downtime.

Try These Experiments for Free with Harness Chaos Engineering 🚀

Chaos Engineering isn’t about breaking things for fun—it’s about finding weaknesses before they cause real-world outages. With Harness Chaos Engineering, you can safely run these tests in staging or production, with built-in safeguards to avoid accidental disasters.

And the best part? You can try it for free! 🎉

🔗 Start testing today with over 30 Linux resilience tests!

Sign up for the Harness Chaos Free Plan

Exploring Chaos Engineering for Kubernetes resilience testing

Resilience Testing

Exploring Chaos Engineering for Kubernetes resilience testing

October 3, 2024

Shashank Dwivedi

+ more
Time to Read

Objective: This blog aims to provide an understanding of Chaos Engineering, its importance, and best practices for testing the resilience of your Kubernetes Well-Architected Framework.

What is Chaos Engineering?

Chaos Engineering is the discipline of performing experiments on software systems to build confidence in their ability to withstand turbulent and unexpected conditions. In other words, failures are intentionally injected into applications to strengthen resilience. By proactively introducing controlled chaos, you can identify weaknesses and prevent catastrophic failures.

A formal definition:

Chaos engineering(https://en.wikipedia.org/wiki/Chaos_engineering) is the discipline of performing experiments on software to build confidence in the system's capability to withstand turbulent and unexpected conditions.”

In practice, this means creating and managing chaos in a system by injecting faults to discover vulnerabilities before they become critical failures.

Why is Chaos Engineering Important?

Incidents and outages are inevitable and can lead to significant financial losses. A prime example is one of the AWS outages in November 2020, caused by an issue in Amazon Kinesis. This failure affected a wide range of services, including Amazon ECS, EKS, CloudWatch, Lambda, and others, costing millions during the critical Black Friday sales week.

Chaos Engineering allows organizations to proactively test their systems’ weaknesses by reproducing incidents or injecting faults in a controlled manner. For instance, companies like Amazon and Netflix have reported up to a 45% reduction in downtime after adopting Chaos Engineering practices.

What is a Kubernetes Well-Architected Framework?

Kubernetes is a widely used container orchestration framework that provides best practices for building highly available and resilient applications. Here are key design patterns recommended for ensuring resilience:

Kubernetes Design Patterns:

  1. Liveness Probe: Verifies the container's health using checks (HTTP, Command, TCP) to ensure the container is restarted if it becomes unresponsive or deadlocked.
  2. Resource Requests and Limits: Developers must set CPU and memory requests and limits to prevent resource exhaustion (e.g., out-of-memory errors), ensuring application stability.
  3. Observability and Monitoring: Use observability tools like Prometheus or Datadog to monitor Kubernetes metrics, create alerts, and address anomalies.
  4. Node/Pod Affinity: Ensures pods are scheduled across nodes or availability zones for performance and reliability.
  5. Horizontal Scaling: Automatically scales application pods based on resource consumption (CPU, Memory) during high traffic, optimizing both performance and cost.
  6. Handling Voluntary Disruptions: This refers to intentional actions like maintenance or node restarts. It's essential to test how your application handles these disruptions.
  7. Security (Certificates): Applications should handle HTTPS interactions and manage SSL/TLS certificate expiration to prevent downtime.
  8. Mapping Service Dependencies: Understanding service dependencies is crucial to identifying bottlenecks during failure scenarios in micro-service architectures.

How Harness Chaos Engineering Enhances Kubernetes Resilience

Harness Chaos Engineering helps you automate resilience testing in your Kubernetes clusters, identifying potential weaknesses in your architecture.

Kubernetes Experiment Suite

Harness offers an experiment suite designed to test the resilience of Kubernetes design patterns. This suite contains 40+ recommended experiments categorized into the following for Kubernetes:

a) Voluntary Disruptions

  • Experiments: Pod Delete, Container Kill, Node Drain, Node Restart.
  • Use Cases: Test scenarios like node/pod affinity, SLAs, and failover in the event of a node failure. Verify how your application behaves during maintenance or restarts.

b) Scalability

  • Experiments: Pod and Node CPU Hog/Stress, Pod and Node Memory Hog/Stress, Pod Disk Fill, Pod and Node I/O Stress.
  • Use Cases: Verify the impact of resource exhaustion (CPU, memory) on application performance. Test Horizontal Pod Autoscaling and ensure applications scale appropriately during stress.

c) Service Dependency

  • Experiments: Pod and Node Network Latency, Pod and Node Black Hole/Network Loss.
  • Use Cases: Test how applications handle network latency, blackholes, and other communication failures. Ensure proper error handling and assess the impact of component failures.

d) Security

  • Experiment: Time Chaos (Certificate Expiration).
  • Use Cases: Simulate certificate expiration to test application response. Ensure your monitoring tools trigger alerts and that your application gracefully handles the scenario.

How Harness Chaos Engineering Automates Chaos Testing in Kubernetes

Harness Chaos Engineering simplifies and scales chaos testing for Kubernetes environments with features such as:

1. Automatic Service Discovery & Application Maps

Harness’s discovery agent automatically identifies services within your Kubernetes namespaces, providing an application map to show traffic flows between services.

__wf_reserved_inherit
Harness service discovery and application maps

__wf_reserved_inherit
Harness service relationship details

2. Auto-Creation of Experiments

After service discovery, Harness auto-generates chaos experiments at different levels of complexity (Basic, Intermediate, Advanced):

  • Basic Experiments (Only a Few): Includes Pod Delete and Network Loss experiments.
  • Intermediate Experiments (Moderate): Includes Pod Delete, Network Loss, and CPU experiments.
  • Advanced Experiments (Maximum): Includes Basic and Intermediate experiments along with Memory experiments.
__wf_reserved_inherit
Harness auto-creation of chaos experiments

3. Out-of-the-Box Kubernetes Faults

Harness offers a wide range of built-in chaos faults for Kubernetes (reference documentation), ensuring you can test for various failure scenarios.

__wf_reserved_inherit
Extensive chaos fault coverage for Kubernetes

4. Resilience Probes

Probes validate your hypothesis about the system’s resilience. For example, Is your application responsive when an application pod is deleted?

__wf_reserved_inherit
Multiple resilience probes options to ensure observability in your tests

5. Resilience Score

The resilience score quantifies how resilient your environment is after running chaos experiments. It’s based on the weight given to each fault and the success rate of probes, providing a clear picture of your system's reliability.

__wf_reserved_inherit
Chaos experiment lifecycle including resilience score

Conclusion

Chaos Engineering is essential for building resilient systems, particularly in Kubernetes environments. By proactively injecting faults, organizations can prevent failures and ensure high availability, ultimately leading to reduced downtime and better customer experiences.

For more detailed use cases and technical documentation, please refer to the Chaos Engineering Docs.

Sign up for FREE to experience the ease of resilience verification using chaos experiments. The free plan allows you to run a few chaos experiments at no charge for an unlimited time, boosting Chaos Engineering for the community.

Harness' Chaos Engineering ROI Calculator helps estimate business losses from outages and evaluates the ROI of chaos engineering practices. By simulating failures and optimizing recovery, it improves system reliability and reduces downtime, providing a clear financial benefit to organizations.

Announcing new features of Harness Chaos Engineering at the ChaosCarnival 2024

Resilience Testing

Announcing new features of Harness Chaos Engineering at the ChaosCarnival 2024

January 24, 2024

Uma Mukkara

+ more
Time to Read

In the last 18 months, we have been learning quite a bit about how customers are using the Chaos Engineering product and also the major challenges in the smooth transition from no-chaos to automated-chaos when it comes to adoption of chaos within their organisations. As a result, many new capabilities were being developed that are now unveiled at the ChaosCarnival 2024 conference. This article describes the motivation and functionality of the new features being unveiled today.

Automated onboarding of chaos experimentation on Kubernetes clusters

In this completely automated onboarding process, the user selects a target kubernetes cluster for starting the chaos or resilience journey. Harness Delegate does all the magic. Harness Delegate runs the preparatory work that is required on the target Kubernetes application, such as discovering the running services, relationships among them, creating application boundaries among the services and creating possible chaos experiments. After creating the experiments, a set of safe experiments are selected and run as well to create the initial resilience insights of the target Kubenernetes application.

The hassle of deploying the chaos agent on the target cluster and creating the experiments manually is completely avoided. This feature allows the DevOps teams to start the chaos engineering practices in the lower environments more liberally and efficiently.

Harness Delegate automated workflow: discover services, organize, create, recommend, and run experiments for resilience
Automated Chaos Experimentation

ChaosGuard

Governing capability around chaos orchestration is needed for the controlled execution of chaos experiments to avoid the unwanted loss of setups in lower environments and unexpected critical incidents in production because of self-inflicted chaos. 

Controlling the blast radius of chaos experiments is crucial to achieve the smooth running of services while the resilience verification is done. If a weakness is found during chaos experimentation, it should not be achieved at the cost of disrupting the service at unexpected time and prolonging for unexpected duration. The administrator who is overseeing the chaos experimentation should make sure that the chaos experimentation is happening outside the critical business times, being done by the right people and only safe experiments are in play. The administrator should have the capability to set up rules in the product control above desired behavior.

This feature provides the capability to govern the chaos orchestration by the team members. Administrators would be able to set up rules to govern the chaos around who can run what chaos experiments on what targets during which time. 

The ChaosGuard feature has individual rules and conditions that can be configured at the project level by those that have the required RBAC permissions. Rule contains one or more conditions. The rules control who can run a chaos experiment and the conditions control the target clusters or namespaces and the type of faults. By combining the rules and conditions, the administrator can effectively control who can run a given experiment, the time window of a chaos experiment, the targeted resources and type of chaos faults.

ChaosGuard matches a chaos experiment against sequential rules and conditions, blocking execution if any deny is met.
ChaosGuard for Chaos Orchestration governance

Resilience Probe Dashboards

A typical chaos experiment consists of a chaos fault while it observes multiple steady states for any deviation. This new feature allows the users to do exactly the opposite -  the users can see the effects of different chaos faults on one single steady state of a service. 

With this feature, you can see the history of chaos faults that were run while observing a specific steady state such as the status code of a service URL. This feature will help the potential weakness areas for a given part of the service.

Resilience Probes Dashboard showing how a single service endpoint behaves against various chaos faults
Chaos Resilience Probes

In product Chaos Sandbox

Harness Chaos Engineering now comes with a FREE sandbox environment for everyone and by default gives about 20 hours of operational run time that can be managed one hour at a time. The sandbox comes completely packaged with a sample application and the chaos infrastructure pre-built in it. Using this sandbox feature, users interactively learn the process of running and observing chaos experiments along with the direct observation of the sample application.

Users can get to run their first chaos experiment from the Signup within 5 minutes. 

Harness Chaos Sandbox interface showing an interactive learning tutorial for running a Pod Delete experiment
Chaos Sandbox

In product Chaos Engineering certification

With sandbox features, it is easy to learn how chaos experiments are structured, how to run them and how to make sense of the resulting resilience scores. This will also help to get the lab examination credits that are mandatory for achieving the “Harness Certified Expert in Chaos Engineering - Developer” certification. You can start the certification process here

In-product Chaos Certificate access card on the Harness Chaos Engineering overview dashboard
Chaos Engineering Certification

Chaos ROI calculator

The need for Chaos Engineering practices is well understood in those environments that have invested in the modern DevOps tools/practices. However, every organisation needs the data for justifying the investment into this new practice especially when it takes additional developers to design/write/automate/maintain the chaos experiments in the lower environments and SREs to do the same in production environments. Investing into chaos engineering can positively surprise you when you have frequent incidents and frequent developer/SRE war rooms.

Harness unveiled a simple yet complete ROI calculator for estimating the costs and potential benefits of investing in Harness Chaos Engineering. Check out the Chaos ROI calculator

Chaos ROI calculator interface with the headline: Investing in chaos engineering is a business decision
Chaos Engineering ROI

Signup today and run your sample chaos experiment in less than 5 minutes, it is FREE too !

Harness and Chaos Engineering logos on a dark blue background
Sign up and use chaos for Free

Get Started

Get Started with Harness AI

Try the full platform free. No module restrictions, no credit card.

Matt Schillerstrom
Director of Product Management and Product Marketing
Matt Schillerstrom is a Product Marketing Manager at Harness, specializing in Feature Management, Chaos Engineering, Database DevOps, and AI-native DevOps.
matt-schillerstrom
Matt Schillerstrom
https://www.linkedin.com/in/matt-schillerstrom-722b5559/
Uma Mukkara
Head of Chaos Engineering
Uma Mukkara is Head of Chaos Engineering at Harness, where he helps teams improve reliability by safely testing how systems behave during real-world failures. Earlier, Mukkara co-founded MayaData and helped build cloud-native technologies such as OpenEBS.
uma-mukkara
Uma Mukkara
https://www.linkedin.com/in/uma-mukkara/