Featured Blogs
Harness has been recognized as a Leader in the 2026 Gartner® Magic Quadrant™ for DevSecOps Platforms for the third consecutive year. Harness was also positioned furthest on the Completeness of Vision axis in the report.
Our Key takeaways:
- Harness is named a Leader for the third consecutive year
- Harness is positioned furthest on the Completeness of Vision axis
- Harness continues investing in governed, AI-powered DevSecOps
Harness is the AI platform for engineering, security, and operations teams to build, secure, deploy, govern, and optimize software delivery across the SDLC.
We believe our recognition in the Gartner Magic Quadrant for DevSecOps Platforms reflects the continued evolution of the Harness platform and our commitment to helping teams deliver software faster, safer, and with greater governance across the software delivery lifecycle.
We’re thrilled to share this recognition, which we believe reflects the strength of our product strategy, the breadth of our platform, and our continued investment in helping enterprises modernize software delivery with security, reliability, cost management, and AI built into the development lifecycle.
Today, organizations across industries like United Airlines, Ancestry, and Citi rely on Harness to reduce delivery complexity, improve developer productivity, strengthen governance, and accelerate innovation across increasingly complex software environments.
Why This Matters Now
Software delivery has entered a new era. AI coding assistants are helping teams create software faster than ever, but faster code generation also means more changes, more tests, more vulnerabilities, more deployments, and more incidents for organizations to manage. The next era of DevSecOps will not be defined by who can generate code faster. It will be defined by who can safely convert that speed into reliable business outcomes.
Our view is that the future of DevSecOps is autonomous AI agents, governed and directed by expert engineers. As humans and AI agents both contribute to software change, enterprises will need one connected platform to understand, validate, secure, deploy, observe, optimize, roll back, and prove every change across the software delivery lifecycle.
Our Journey
As a pioneer in modern software delivery, Harness offers over 15 platform products and has built one of the industry’s most comprehensive platforms to support the full spectrum of application development, deployment, security, reliability, feature management, cost management, and operations.
Harness has evolved through a combination of product innovation, internal entrepreneurship, open source investment, and strategic acquisitions. We believe our recognition as furthest on the Completeness of Vision axis in the 2026 Gartner® Magic Quadrant™ for DevSecOps Platforms is proof that Harness is solving problems for our customers in a measurable way.
Over the past year, Harness has continued to expand platform capabilities and AI agents across:
- Security and risk management
- AI-native testing capabilities including flaky test detection and AI impact testing
- Feature Management and Experimentation
- Cloud and AI Cost Management
- AI DLC insights
- Resilience Testing, and more
This matters because software delivery is no longer just about building and deploying code. Teams must now manage security risk, release complexity, infrastructure cost, compliance requirements, production reliability, and the growing impact of AI-generated software. The Harness platform allows teams to adopt what they need, when they need it, in one place.
With operations across North America, Europe, APAC, Latin America, and India, Harness serves organizations of all sizes across industries. Customers choose Harness not only for the breadth of the platform but also for the flexibility to adopt individual modules or the full platform based on their needs, maturity, and business priorities.
What’s Next for Harness
This recognition in our opinion is a milestone, and we’re proud, but we’re even more excited by the road ahead.
We build security in the software delivery lifecycle natively, not as a separate stage or disconnected toolchain. As AI increases the volume of code, changes, and security findings, enterprises will need platforms that connect detection, prioritization, policy, remediation, deployment, and runtime defense into a single, governed workflow.
Harness is focused on helping enterprises meet that moment. We will continue investing in AI software delivery to help teams move faster without losing control. Our goal is to help every organization deliver software that is faster to build, safer to release, easier to govern, and more resilient in production.
Thank you to our customers, partners, employees, and community for your continued trust. We’re excited about the journey ahead and can’t wait to show you what’s next.
Learn More
Get a complimentary copy of the 2026 Gartner® Magic Quadrant™ for DevSecOps Platforms.
Or, to talk to someone about Harness, please contact us.
Gartner Disclaimer
Gartner, Magic Quadrant for DevSecOps Platforms, 2026, Keith Mann, Thomas Murphy, Bill Holz, 15 June 2026
Gartner does not endorse any vendor, product, or service depicted in its research publications and does not advise technology users to select only those vendors with the highest ratings or other designation. Gartner research publications consist of the opinions of Gartner’s research organization and should not be construed as statements of fact. Gartner disclaims all warranties, expressed or implied, with respect to this research, including any warranties of merchantability or fitness for a particular purpose.
GARTNER is a registered trademark and service mark of Gartner, and Magic Quadrant is a registered trademark of Gartner, Inc. and/or its affiliates in the U.S. and internationally, and is used herein with permission. All rights reserved.
Over the last few years, something fundamental has changed in software development.
If the early 2020s were about adopting AI coding assistants, the next phase is about what happens after those tools accelerate development. Teams are producing code faster than ever. But what I’m hearing from engineering leaders is a different question:
What’s going to break next?
That question is exactly what led us to commission our latest research, State of DevOps Modernization 2026. The results reveal a pattern that many practitioners already sense intuitively: faster code generation is exposing weaknesses across the rest of the software delivery lifecycle.
In other words, AI is multiplying development velocity, but it’s also revealing the limits of the systems we built to ship that code safely.
The Emerging “Velocity Paradox”
One of the most striking findings in the research is something we’ve started calling the AI Velocity Paradox - a term we coined in our 2025 State of Software Engineering Report.
Teams using AI coding tools most heavily are shipping code significantly faster. In fact, 45% of developers who use AI coding tools multiple times per day deploy to production daily or faster, compared to 32% of daily users and just 15% of weekly users.
At first glance, that sounds like a huge success story. Faster iteration cycles are exactly what modern software teams want.
But the data tells a more complicated story.
Among those same heavy AI users:
- 69% report frequent deployment problems when AI-generated code is involved
- Incident recovery times average 7.6 hours, longer than for teams using AI less frequently
- 47% say manual downstream work, QA, validation, remediation has become more problematic
What this tells me is simple: AI is speeding up the front of the delivery pipeline, but the rest of the system isn’t scaling with it. It’s like we are running trains faster than the tracks they are built for. Friction builds, the ride is bumpy, and it seems we could be on the edge of disaster.

The result is friction downstream, more incidents, more manual work, and more operational stress on engineering teams.
Why the Delivery System Is Straining
To understand why this is happening, you have to step back and look at how most DevOps systems actually evolved.
Over the past 15 years, delivery pipelines have grown incrementally. Teams added tools to solve specific problems: CI servers, artifact repositories, security scanners, deployment automation, and feature management. Each step made sense at the time.
But the overall system was rarely designed as a coherent whole.
In many organizations today, quality gates, verification steps, and incident recovery still rely heavily on human coordination and manual work. In fact, 77% say teams often have to wait on other teams for routine delivery tasks.
That model worked when release cycles were slower.
It doesn’t work as well when AI dramatically increases the number of code changes moving through the system.
Think of it this way: If AI doubles the number of changes engineers can produce, your pipelines must either:
- cut the risk of each change in half, or
- detect and resolve failures much faster.
Otherwise, the system begins to crack under pressure. The burden often falls directly on developers to help deploy services safely, certify compliance checks, and keep rollouts continuously progressing. When failures happen, they have to jump in and remediate at whatever hour.
These manual tasks, naturally, inhibit innovation and cause developer burnout. That’s exactly what the research shows.
Across respondents, developers report spending roughly 36% of their time on repetitive manual tasks like chasing approvals, rerunning failed jobs, or copy-pasting configuration.
As delivery speed increases, the operational load increases. That burden often falls directly on developers.
What Organizations Should Do Next
The good news is that this problem isn’t mysterious. It’s a systems problem. And systems problems can be solved.
From our experience working with engineering organizations, we've identified a few principles that consistently help teams scale AI-driven development safely.
1. Standardize delivery foundations
When every team builds pipelines differently, scaling delivery becomes difficult.
Standardized templates (or “golden paths”) make it easier to deploy services safely and consistently. They also dramatically reduce the cognitive load for developers.
2. Automate quality and security checks earlier
Speed only works when feedback is fast.
Automating security, compliance, and quality checks earlier in the lifecycle ensures problems are caught before they reach production. That keeps pipelines moving without sacrificing safety.
3. Build guardrails into the release process
Feature flags, automated rollbacks, and progressive rollouts allow teams to decouple deployment from release. That flexibility reduces the blast radius of new changes and makes experimentation safer.
It also allows teams to move faster without increasing production risk.
4. Remember measurement, not just automation
Automation alone doesn’t solve the problem. What matters is creating a feedback loop: deploy → observe → measure → iterate.
When teams can measure the real-world impact of changes, they can learn faster and improve continuously.
The Next Phase of AI in Software Delivery
AI is already changing how software gets written. The next challenge is changing how software gets delivered.
Coding assistants have increased development teams' capacity to innovate. But to capture the full benefit, the delivery systems behind them must evolve as well.
The organizations that succeed in this new environment will be the ones that treat software delivery as a coherent system, not just a collection of tools.
Because the real goal isn’t just writing code faster. It’s learning faster, delivering safer, and turning engineering velocity into better outcomes for the business.
And that requires modernizing the entire pipeline, not just the part where code is written.

Feature flags are table stakes for modern software development. They allow teams to ship features safely, test new functionality, and iterate quickly, all without re-deploying their applications. As teams grow and ship across multiple services, environments, and languages, consistently managing feature flags becomes a significant challenge.

Harness Feature Management & Experimentation (FME) continues its investment in OpenFeature, building on our early support and adoption of the CNCF standard for feature flagging since 2022. OpenFeature provides a single, vendor-agnostic API that allows developers to interact with multiple feature management providers while maintaining consistent flag behavior.
With OpenFeature, you can standardize flag behavior across services and applications, and integrate feature flags across multiple languages and SDKs, including Node.js, Python, Java, .NET, Android, iOS, Angular, React, and Web.
Why OpenFeature matters today
Feature flagging may appear simple on the surface; you check a boolean, push up a branch, and move on. But as Pete Hodgson describes in his blog post about OpenFeature:
When I talk to people about adopting feature flags, I often describe feature flag management as a bit of an iceberg. On the surface, feature flagging seems really simple… However, once you get into it, there’s a fair bit of complexity lurking under the surface.
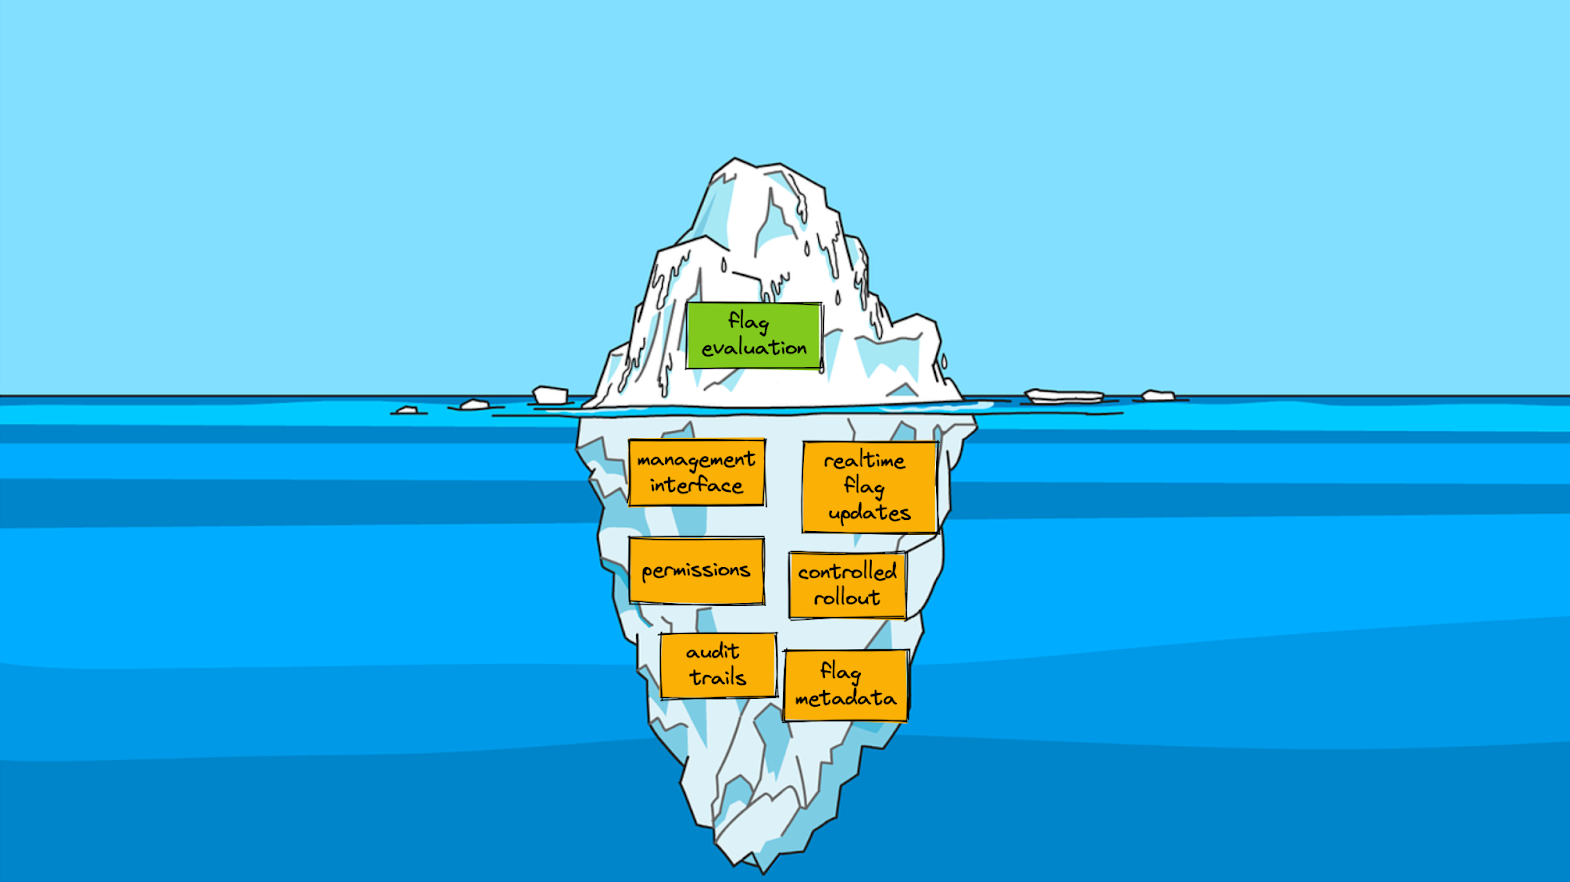
At scale, feature management is more than toggling booleans; it's about auditing configurations, controlling incremental rollouts, ensuring governance and operational best practices, tracking events, and integrating with analytics systems. OpenFeature provides a standard interface for consistent execution across SDKs and providers. Once teams hit those hidden layers of complexity, a standardized approach is no longer optional.
This need for standardization isn’t new. In fact, Harness FME (previously known as Split.io) was an early supporter of OpenFeature because teams were already running into the limits of proprietary, SDK-specific flag implementations. From a blog post about OpenFeature published in 2022:
While feature flags alone are very powerful, organizations that use flagging at scale quickly learn that additional functionality is needed for a proper, long-term feature management approach.
This post highlights challenges that are now commonplace in most organizations: maintaining several SDKs across services, inconsistent flag definitions between teams, and friction in integrating feature flags with analytics, monitoring, and CI/CD systems.
What’s changed since then isn’t the problem; it’s the urgency. Teams are now shipping faster, across more languages and environments, with higher expectations around governance, experimentation, and observability. OpenFeature is a solution that enables teams to meet those expectations without increasing complexity.
Integrate OpenFeature with Harness FME
Feature flagging with OpenFeature provides your team with a consistent API to evaluate flags across environments and SDKs. With Harness FME, you can plug OpenFeature directly into your applications to standardize flag evaluations, simplify rollouts, and track feature impact, all from your existing workflow.
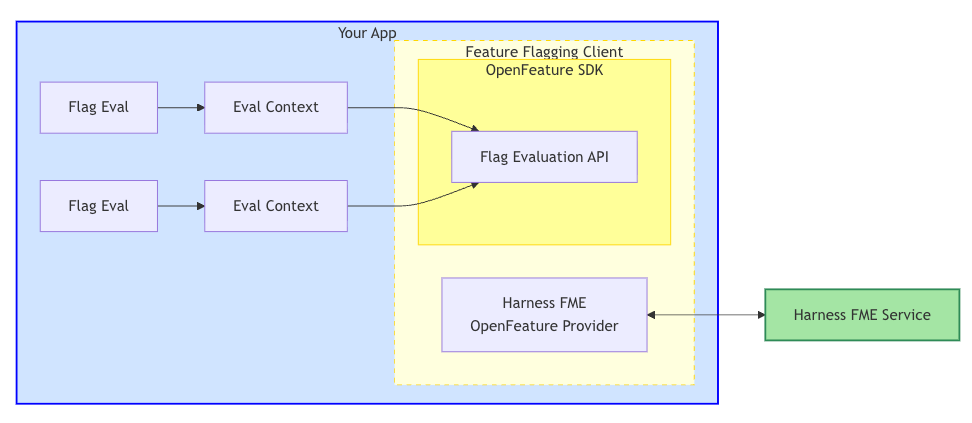
The Harness FME OpenFeature Provider wraps the Harness FME SDK, bridging the OpenFeature SDK with the Harness FME service. The provider maps OpenFeature's interface to the FME SDK, which handles communication with Harness services to evaluate feature flags and retrieve configuration updates.
In the following example, we’ll use the Harness FME Node.js OpenFeature Provider to evaluate and track feature flags in a sample application.
Prerequisites
Before you begin, ensure you have the following requirements:
- A valid Harness FME SDK key for your project
- Node.js 14.x+
- Access to npm or yarn to install dependencies
Setup
- Install the Node.js OpenFeature provider and dependencies.
- Initialize and register the provider with OpenFeature using your Harness FME SDK key.
- Evaluate feature flags with context. Target specific users, accounts, or segments by passing an evaluation context.
- If you reuse the same targeting key frequently, set the context once at the client or API level:
- Optionally, track user events like user actions or conversion events to measure flag impact. Event tracking links user behavior directly to your feature flags, helping you understand the real-world impact of each rollout.
With the provider registered and your evaluation context configured, your Node.js service can now evaluate flags, track events, and access flag metadata through OpenFeature without needing custom clients or SDK rewrites. From here, you can add additional flags, expand your targeting attributes, configure rollout rules in Harness FME, and feed event data directly into your experimentation workflows.
Start using Harness FME OpenFeature providers today
Feature management at scale is a common operational challenge. Much like the feature flagging iceberg where the simple on/off switch is just the visible tip, most of the real work happens underneath the surface: consistent evaluation logic, targeting, auditing, event tracking, and rollout safety. Harness FME and OpenFeature help teams manage these hidden operational complexities in a unified, predictable way.
Looking ahead, we’re extending support to additional server-side providers such as Go and Ruby, continuing to broaden OpenFeature’s reach across your entire stack.
To learn more about supported providers and how teams use OpenFeature with Harness FME in practice, see the Harness FME OpenFeature documentation. If you’re brand new to Harness FME, sign up for a free trial today.
Get a demo switch to Harness FME
Latest Blogs

Feature Flag Tools Compared: 10 Best Platforms for Safer Releases
- Modern feature flag tools have evolved past simple on/off toggles into full experimentation platforms.
- The right platform plugs directly into your CI/CD pipeline and observability stack, so experimentation becomes a daily developer practice instead of an off-to-the-side project.
- Choosing a feature flag tool ultimately comes down to scale, governance, and how clearly each release ties to the business KPIs your leadership actually cares about.
The 10 Best Feature Flag Tools for 2026
Releasing new software used to be a big deal. You would set aside a Saturday night, wake up the on-call engineer, push the code, and hope that nothing broke before Monday morning.
Then came feature flags, which changed everything without anyone noticing.
Feature flags let you separate deployment from release, so you can send code to production in a dormant state and turn it on for users when you're ready. No more 1 a.m. maintenance windows. We don't have to ship every feature in a release together anymore, or scramble to pull one back with a hotfix. Just code in production, off by default, and ready when you say so.
But the tools have improved a lot. Feature flag tools these days are more than just on/off switches. The best ones have flag management, progressive delivery, real-time release monitoring, A/B testing, and AI-driven guardrail metrics all built right into your CI/CD pipeline. That changes how a release looks, how a rollback feels, and how confident your team is when they ship.
Here's a look at the best feature flag tools available, along with what each one does well and what to look for when picking the right one for your team.
What Feature Flag Tools Really Do
A feature flag, or feature toggle, is a conditional block in your code that controls whether a new feature is active for a given user. Wrap a flag around a checkout page redesign, and you can push the code to production while keeping the new flow hidden from 99% of users. Set it to 1% as a canary, monitor your metrics, and gradually increase the rollout percentage if everything looks good.
Feature flag tools handle the whole lifecycle: creating flags, targeting users, rolling them out incrementally, monitoring their impact, and retiring flags once they've served their purpose.
Modern platforms add a few more layers on top of that:
- Progressive delivery. Instead of releasing everything at once, release features to bigger groups of users over time, based on performance metrics.
- Experimentation. Use proper sample size calculations and significance testing to run statistically sound A/B tests.
- Release monitoring. Find out how feature exposure affects error rates, latency, and business KPIs in real time.
- Governance. RBAC, audit trails, and approval workflows for organizations operating in regulated industries.
The toggle itself isn't worth much. The safety net around it is.
What to Look for in a Feature Flag Tool
Before you start looking at different tools, make sure you know what your team really needs. Some questions you should ask are:
Does it work with the CI/CD pipeline you already have? Your developers will work around a flag platform that is outside of your delivery workflow, not with it.
Can it connect flag exposure to your observability stack? You don't want three dashboards to cross-reference when something breaks at 3 a.m. You want one screen that tells you which feature caused the spike.
Will it scale with your traffic and your team? When you have millions of users, SDK performance, evaluation latency, and offline fallback are all important.
Does it cover governance for regulated environments? In healthcare, fintech, or anything touching PII, RBAC, approval workflows, immutable audit trails, and Policy as Code aren't optional.
How does it handle flag lifecycle management? Stale flags are technical debt. The best platforms include ownership assignment, sunset policies, and dashboards that surface flag age and usage frequency.
With those criteria in mind, here are the best tools to consider.
The 10 Best Feature Flag Tools
1. Harness Feature Management & Experimentation (FME)
Harness FME is a developer-first platform that brings feature management, A/B testing, and release monitoring into one unified system. Built on the combined Split and Harness lineage, FME is designed for enterprise teams that want experimentation baked into their CI/CD pipeline not bolted on as a separate workflow.
What makes FME stand out:
- Unified flags and experimentation. Feature management and A/B testing share the same flag, SDK, and data pipeline. No parallel systems to reconcile.
- AI-driven release monitoring. Release monitoring automatically connects flag exposure to error rates, latency, and business KPIs. You know which feature broke something right away, not hours later.
- Warehouse-native experimentation. Run analysis directly on your Snowflake, BigQuery, or Databricks data, so experiment results live alongside the rest of your business intelligence.
- Automated rollback and progressive delivery. If p95 latency climbs 10% for 84 seconds, FME handles the rollback automatically while you sleep.
- Enterprise governance. RBAC, SAML federation, immutable audit logs, and approval workflows for regulated industries.
Best for: Enterprise engineering teams that want a single platform for feature flags, experimentation, and release monitoring, with deep CI/CD integration.
2. LaunchDarkly
LaunchDarkly is one of the oldest feature flag platforms on the market. It's a popular choice for teams that want a flag-first product with mature SDK support for most major languages.
Some of its strengths are that it has a lot of SDK support, good targeting options, and a long history of managing features. Some teams may prefer other vendors for bundled analytics or warehouse-native analysis. Teams that do a lot of A/B testing often use LaunchDarkly with a separate analytics or stats engine, which makes things more complicated.
Best for: Teams whose primary need is feature flag management, with separate tooling for testing and observability.
3. Statsig
Statsig has become a popular platform for product-led growth teams. Statsig is a popular platform for product-led growth teams because it has a free tier that includes feature flags, experimentation, and product analytics all in one place.
The platform's statistical engine is good. It can do sequential testing and has a good way of testing for significance. With warehouse-native mode, you can analyze your own data infrastructure. Statsig is still growing in enterprise governance, but its RBAC and audit features aren't as strong as those found in regulated industries.
Best for: Product-led growth teams that want flags, experiments, and analytics in one system without heavy enterprise requirements.
Ownership note: Statsig announced in September 2025 that it would join OpenAI. OpenAI said Statsig would continue operating independently and serving current customers, so buyers may want to watch how the roadmap evolves under new ownership.
4. Optimizely Feature Experimentation
Optimizely's roots are in web-based A/B testing, and it brings that history of experimentation into its feature flag product. The platform's statistical methods are well-established, and marketing teams that have used other Optimizely products are likely to choose it.
The downside is that you can see where Optimizely came from in some places. The product is more useful for web and front-end use cases and less useful for the kind of deep backend, infrastructure-level flag management that engineering teams often need. More developer-native tools tend to work better for product engineering teams that only work on products.
Best for: Marketing-engineering hybrid teams already invested in the Optimizely ecosystem who want to extend it to product feature testing.
5. PostHog
PostHog is an open-source platform that bundles product analytics, feature flags, experimentation, and session replay together. It's a popular pick for early-stage companies that want a lot of capability without paying for multiple platforms.
The all-in-one approach works well at a smaller scale. As you grow, you may find that specialized tools go deeper on individual capabilities particularly enterprise-level flag management and statistical rigor. The self-hosted option is a meaningful advantage for teams with strict data residency requirements.
Best for: Startups and growth teams that want product analytics and feature flags in one place, with a self-hosting option.
6. Flagsmith
Flagsmith is a feature flag platform that is completely open source and can be hosted in the cloud or on your own server. It's a good choice for teams that need open-source flexibility (or strict self-hosting) but don't want to lose the polished product experience.
The platform does a good job of covering the basics, like targeting, segmentation, multivariate flags, and SDK support for most languages. It's not as heavy as enterprise platforms when it comes to advanced experimentation, AI-driven release monitoring, and deeply automated guardrails.
Best for: Teams with privacy requirements, self-hosting mandates, or a strong preference for open-source software.
7. Unleash
Unleash is another open-source option with a strong following in Kubernetes-native shops. It's known for being straightforward to set up, easy to understand, and well-suited to teams that want full control over their tooling.
Like Flagsmith, Unleash handles flag management well but doesn't extend as far into experimentation or release intelligence. If your team primarily needs to safely gate features and host the platform yourself, Unleash is a solid choice.
Best for: Open-source-first teams, especially those running Kubernetes infrastructure.
8. ConfigCat
ConfigCat markets itself as a simple, inexpensive feature flag service with clear prices and an easy setup. A lot of small to medium-sized teams choose it because they want to manage flags without the extra work that comes with a bigger platform.
The product includes the basics, such as targeting, segmentation, percentage rollouts, and connections to popular tools. It wasn't made to be a testing platform, so teams that need statistical analysis will have to use it with something else.
Best for: Small-to-midsize teams that want light-weight, budget-friendly flag management without enterprise complexity.
9. GrowthBook
GrowthBook is an open-source feature flag platform originally built around warehouse-native experimentation. The premise: your experiment data is already in BigQuery, Snowflake, or Redshift, so it should be analyzed there rather than piped to a separate vendor.
For data teams that have invested heavily in their warehouse, GrowthBook is a strong fit. The statistical methods are rigorous. Bayesian and frequentist options, sequential testing, CUPED variance reduction, and the open-source model gives you full control over the platform.
Best for: Data teams that want serious warehouse-native experimentation with open-source control.
10. AWS AppConfig
AWS AppConfig is Amazon's native configuration and feature flag service for teams operating entirely within the AWS ecosystem. It integrates cleanly with Lambda, ECS, EKS, and EC2, and runs as a fully managed service under your existing AWS account.
The trade-off is depth. AppConfig treats flags as part of broader application configuration. It isn't a purpose-built platform for experimentation or release intelligence. Teams that need advanced targeting, A/B testing, and release monitoring at the level of a dedicated tool will outgrow it quickly.
Best for: AWS-native teams with modest flag requirements who want to stay within the AWS ecosystem.
How to Pick the Right Feature Flag Tool for Your Team
Once you've narrowed down your list, here are a few things to think about.
- Match the tool to your scale. A platform that works for a 10-person startup probably won't work for a business with 500 engineers, and the other way around. Check how well the SDK works when it's under load, how deep the governance is, and how the platform handles thousands of flags across hundreds of services.
- Look for pipeline-native integration. If turning on a flag means a developer has to stop what they're doing and do something else, that flag won't be used as much. The best platforms let you manage flags like GitOps and trigger updates with CLI commands or pipeline steps.
- Build in flag hygiene from day one. Old flags are a type of technical debt. Look for dashboards that show the lifecycle of a project, policies about when to end a project, and who is responsible for what. Amazon requires flag removal tasks to be done when the task is created, which is a good idea to copy.
- Plan for governance before you need it. RBAC, audit trails, approval workflows, and policy-as-code may seem like too much for a small project, but they cost a lot to add later. Get the governance bench set up early.
- Run a two-week pilot with one team before rolling out company-wide. You can learn more about a platform in two weeks with just one engineering team than you can with a dozen vendor demos. Don't just look at how well it works on its own; make sure it fits with your current tools.
- Tie your tool choice to KPIs. You should be able to measure the tool you choose by how often it is deployed, how often it fails to change, how long it takes to recover, and (ideally) how it affects business outcomes for specific experiments. It's hard to explain why you spent the money if you can't connect it to those numbers.
Stop Guessing and Start Shipping with Confidence
Feature flag tools started as a clever way to ship code that wasn't quite ready without breaking production. They've grown into something much larger: the foundation for safer releases, faster experimentation, and a development culture where shipping doesn't feel like gambling.
The best platforms bring feature flags, progressive delivery, real-time monitoring, and AI-driven guardrails together in one place integrated with your CI/CD pipeline so every release becomes a controlled experiment rather than a leap of faith.
Harness Feature Management & Experimentation brings flags, experimentation, and release monitoring into a single enterprise-grade platform, with AI-driven guardrails and deep CI/CD integration built in. Every deployment becomes a measurable, recoverable experiment instead of a gamble.
Feature Flag Tools: Frequently Asked Questions (FAQs)
What's the difference between a feature flag and a feature toggle?
They mean the same thing. "Feature flag" and "feature toggle" are used interchangeably across the industry. Some teams use "toggle" for simple on/off switches and "flag" for more complex multivariate or targeted releases, but most platforms and engineers treat them as the same concept.
Are open-source feature flag tools production-ready?
Flagsmith, Unleash, and GrowthBook are all capable of running in production at scale. The trade-off is usually in advanced experimentation, AI-driven release monitoring, and enterprise governance. If those aren't requirements, open source is a legitimate path. For teams where they are requirements, a managed enterprise platform typically saves more in engineering time than it costs.
Can I use feature flags without a dedicated platform?
Yes. Many early-stage products start with homegrown approaches using config files or environment variables. The cracks show later: targeting becomes hard to manage, there are no audit trails, and stale flags accumulate as silent technical debt. Most teams hit a threshold (usually around 20 to 30 active flags) where a dedicated platform pays for itself in saved engineering time.
How do feature flag tools integrate with CI/CD pipelines?
The best platforms integrate directly with your CI/CD pipeline so flag updates can flow through GitOps workflows, CLI commands, or pipeline steps. That keeps flag changes in the same review and audit flow as code deployments. During an incident, you have one place to look: what changed, when, and who changed it.
Do I need separate tools for A/B testing and feature flags?
You can run them separately, but you'll spend ongoing effort keeping data consistent across two systems. Unified platforms like Harness FME use the same flag, SDK, and exposure pipeline for both flag management and experimentation which eliminates an operational pain point that most teams don't appreciate until they've lived with the split-system version.
How do you prevent feature flag debt?
Three habits cover most of it:
- Assign an owner and an expiration date when you create a flag.
- Maintain a flag hygiene dashboard that surfaces age, usage frequency, and removal candidates.
- Treat flag removal as a normal engineering task, not an afterthought. File the removal ticket before the flag goes live.
Harness Named a Leader in the 2026 Gartner® Magic Quadrant™ for DevSecOps Platforms for the Third Consecutive Year
Harness has been recognized as a Leader in the 2026 Gartner® Magic Quadrant™ for DevSecOps Platforms for the third consecutive year. Harness was also positioned furthest on the Completeness of Vision axis in the report.
Our Key takeaways:
- Harness is named a Leader for the third consecutive year
- Harness is positioned furthest on the Completeness of Vision axis
- Harness continues investing in governed, AI-powered DevSecOps
Harness is the AI platform for engineering, security, and operations teams to build, secure, deploy, govern, and optimize software delivery across the SDLC.
We believe our recognition in the Gartner Magic Quadrant for DevSecOps Platforms reflects the continued evolution of the Harness platform and our commitment to helping teams deliver software faster, safer, and with greater governance across the software delivery lifecycle.
We’re thrilled to share this recognition, which we believe reflects the strength of our product strategy, the breadth of our platform, and our continued investment in helping enterprises modernize software delivery with security, reliability, cost management, and AI built into the development lifecycle.
Today, organizations across industries like United Airlines, Ancestry, and Citi rely on Harness to reduce delivery complexity, improve developer productivity, strengthen governance, and accelerate innovation across increasingly complex software environments.
Why This Matters Now
Software delivery has entered a new era. AI coding assistants are helping teams create software faster than ever, but faster code generation also means more changes, more tests, more vulnerabilities, more deployments, and more incidents for organizations to manage. The next era of DevSecOps will not be defined by who can generate code faster. It will be defined by who can safely convert that speed into reliable business outcomes.
Our view is that the future of DevSecOps is autonomous AI agents, governed and directed by expert engineers. As humans and AI agents both contribute to software change, enterprises will need one connected platform to understand, validate, secure, deploy, observe, optimize, roll back, and prove every change across the software delivery lifecycle.
Our Journey
As a pioneer in modern software delivery, Harness offers over 15 platform products and has built one of the industry’s most comprehensive platforms to support the full spectrum of application development, deployment, security, reliability, feature management, cost management, and operations.
Harness has evolved through a combination of product innovation, internal entrepreneurship, open source investment, and strategic acquisitions. We believe our recognition as furthest on the Completeness of Vision axis in the 2026 Gartner® Magic Quadrant™ for DevSecOps Platforms is proof that Harness is solving problems for our customers in a measurable way.
Over the past year, Harness has continued to expand platform capabilities and AI agents across:
- Security and risk management
- AI-native testing capabilities including flaky test detection and AI impact testing
- Feature Management and Experimentation
- Cloud and AI Cost Management
- AI DLC insights
- Resilience Testing, and more
This matters because software delivery is no longer just about building and deploying code. Teams must now manage security risk, release complexity, infrastructure cost, compliance requirements, production reliability, and the growing impact of AI-generated software. The Harness platform allows teams to adopt what they need, when they need it, in one place.
With operations across North America, Europe, APAC, Latin America, and India, Harness serves organizations of all sizes across industries. Customers choose Harness not only for the breadth of the platform but also for the flexibility to adopt individual modules or the full platform based on their needs, maturity, and business priorities.
What’s Next for Harness
This recognition in our opinion is a milestone, and we’re proud, but we’re even more excited by the road ahead.
We build security in the software delivery lifecycle natively, not as a separate stage or disconnected toolchain. As AI increases the volume of code, changes, and security findings, enterprises will need platforms that connect detection, prioritization, policy, remediation, deployment, and runtime defense into a single, governed workflow.
Harness is focused on helping enterprises meet that moment. We will continue investing in AI software delivery to help teams move faster without losing control. Our goal is to help every organization deliver software that is faster to build, safer to release, easier to govern, and more resilient in production.
Thank you to our customers, partners, employees, and community for your continued trust. We’re excited about the journey ahead and can’t wait to show you what’s next.
Learn More
Get a complimentary copy of the 2026 Gartner® Magic Quadrant™ for DevSecOps Platforms.
Or, to talk to someone about Harness, please contact us.
Gartner Disclaimer
Gartner, Magic Quadrant for DevSecOps Platforms, 2026, Keith Mann, Thomas Murphy, Bill Holz, 15 June 2026
Gartner does not endorse any vendor, product, or service depicted in its research publications and does not advise technology users to select only those vendors with the highest ratings or other designation. Gartner research publications consist of the opinions of Gartner’s research organization and should not be construed as statements of fact. Gartner disclaims all warranties, expressed or implied, with respect to this research, including any warranties of merchantability or fitness for a particular purpose.
GARTNER is a registered trademark and service mark of Gartner, and Magic Quadrant is a registered trademark of Gartner, Inc. and/or its affiliates in the U.S. and internationally, and is used herein with permission. All rights reserved.

A/B Testing at Scale: Enable Safe Experimentation for Platform Teams
- Integrating A/B testing and feature flags directly into CI/CD pipelines empowers developers with self-service experimentation, while maintaining enterprise governance and security.
- Standardizing experimentation workflows—including flag management, guardrail metrics, and automated verification—reduces operational bottlenecks and technical debt across large engineering teams.
- AI-powered automation enable platform teams to scale safe experimentation. Intelligent tooling provides portfolio-level visibility and ROI measurement without sacrificing control or compliance.
With the acceleration of AI-assisted coding, spurring the velocity of software releases, the challenge of ensuring stable deployments is heightened, and platform teams are feeling the hit. The State of AI-assisted Software Development DORA report measured a negative impact on software delivery stability: “an estimated 7.2% reduction for every 25% increase in AI adoption.”
The DORA report advises:
Considered together, our data suggest that improving the development process does not automatically improve software delivery—at least not without proper adherence to the basics of successful software delivery, like small batch sizes and robust testing mechanisms.
A robust testing mechanism rapidly gaining momentum is testing in production. Let’s take a closer look at how this practice boosts software delivery stability and supports the software development lifecycle (SDLC). We’ll also consider how to make testing in production, specifically A/B testing at scale, work for you.
What is testing in production?
Testing in production (TIP) means testing new software code on live traffic in active real-world environments. TIP is complementary to pre-production testing and does not replace it. It does, however, carry tangible benefits:
- Real-World Validation. Tests new features in the actual production environment, measuring performance under real-world conditions and detecting issues that staging (due to lack of data variety) cannot catch.
- Speed & Efficiency. Eliminate the need to create and maintain expensive, multi-layered staging environments for heavy testing.
- Improved User Experience. Allows teams to quickly iterate on features where they create confirmed value, by means of tight feedback loops on real user data.
- Early Issue Detection: Equips your team to spot issues early on, by testing features in production in small amounts or with limited visibility. You can resolve the errors before they escalate or affect more customers.
Feature flags are instrumental in the practice of safe testing in production because they decouple deployment and exposure at the most granular level. By means of feature flags, you implement incremental feature release techniques and unlock progressive experimentation. With carefully crafted A/B testing, you empower rapid feedback loops that confirm real feature value, validate high quality software, and increase team productivity and satisfaction.
These testing and verification capabilities are crucial as never before in this “AI moment” where AI-assisted coding enjoys wide adoption and funding.
How A/B Testing Works
A/B testing is the process of simultaneously testing two different versions of a web page or product feature in order to optimize a behavioral or performance metric, while ensuring guardrail metrics are not negatively impacted. A/B testing spans the whole spectrum of software verification: you can safely carry out architectural validation on fundamental architectural changes or gather behavioral analytics on UI variations.
Progressive experimentation with feature flags lets you roll out changes to a small slice of users first, catch problems early, and expand only when the data looks good.
The key is keeping deployment and release separate. You decouple deployment and release by delivering new features in a dormant state. Code goes out behind a flag. You validate it with real traffic.
Why A/B Testing Belongs in Your CI/CD Pipeline
A/B testing built into your CI/CD pipeline means you're making data-driven decisions based on observed metrics. Advanced feature flagging correlates statistical data, with pinpoint precision, to the actual feature variation causing the impact. Even when multiple features are rolled out concurrently, an enterprise-grade feature management platform will effectively parse the data, alert you to the impactful variant, and enable you to roll back any negative feature in seconds. The time/cost savings and safety benefits are astounding.
A/B testing provides a great experience for both marketing teams and engineers:
- Marketers can enjoy the freedom to boldly conduct business experiments and conclusively determine the features that drive key performance indicators (KPIs) and return on investment (ROI).
- Engineers can confidently improve architecture and perform code refactoring, knowing these changes will be safely measured against guardrail metrics for real-world engineering verification.
An enterprise-level platform like Harness, provides Feature Management and Experimentation, bringing flags, monitoring, and full experimentation freedom into a finely-tuned, seamless end-to-end software delivery tech stack for your platform team. Integrating A/B testing and feature flags directly into CI/CD pipelines empowers your teams with self-service experimentation while maintaining enterprise governance and security.
Progressive exposure limits the blast radius
Bundling features into cliff-jump releases put every user account at risk simultaneously. A progressive ramp—starting with just 1 or 2% of traffic, and gradually increasing—means a bug in your checkout flow only affects a fraction of users before you catch it. Progressive delivery validates that SLOs are holding before exposure expands. p95 latency spiking? Error rate creeping up? You catch it when a tiny fraction of users are affected—not thousands—and Harness CD integrates cleanly with Jenkins, GitLab, or GitHub Actions.
The deploy-and-hold pattern is the keystone. Ship code in the "off" state behind a feature flag and nothing changes for users until you're ready. Deploy at 11 AM on a Tuesday instead of 1 AM on a Sunday. No change windows, no dashboard babysitting. Code is in production, the feature is dark, and you flip the switch when you're ready to monitor it. That's the freedom of progressive experimentation with feature flags in practice.
AI-assisted verification handles the noise
Raw telemetry is information in theory and chaos in practice. AI-powered monitoring watches flag-level metrics—not just "something is slower," but "checkout button variant B is adding 43ms of p95 latency." That specificity matters. When you have six active experiments running, your engineers are not flipping through dashboards trying to isolate which one broke something. The system tells you.
From Feature Flags to Experiments: Architecture That Works Seamlessly
If your team is already running feature flags with health monitoring, you're closer to a full experimentation platform than you might think. Targeting logic, rollout percentages, kill switches—that's already experiment infrastructure. What's missing is experiment tracking, statistical analysis, and deterministic assignment.
To implement experiments with your feature flagging:
- Build on existing flag infrastructure. Targeting, rollout percentages, and kill switches are already there. Add experiment tracking on top rather than running parallel systems. Harness Feature Management handles both in one place.
- Use stable user IDs for deterministic assignment. Consistent hashing keeps users in the same variant across sessions and devices. No drift, no contaminated data.
- Evaluate flags on the SDK side. Toggle decisions should be fast and deterministic. Local evaluation avoids remote call latency and keeps user data secure.
- Route alerts to features, not just systems. "Checkout variant B caused a +43ms p95 increase" is actionable; "Latency is up" isn't. Release monitoring with flag context makes rollback decisions take on surgical precision, and proper experimentation systems prevent sample ratio mismatch and bot traffic from skewing results.
An experimentation system built on top of your feature flagging makes A/B testing a cinch and eliminates operational bottlenecks and technical debt for your platform team.
CI/CD Workflow: Six Stages for Safe Experimentation
A/B testing doesn't have to be complicated. It can run as part of a structured rollout with automated KPI metrics and guardrails:
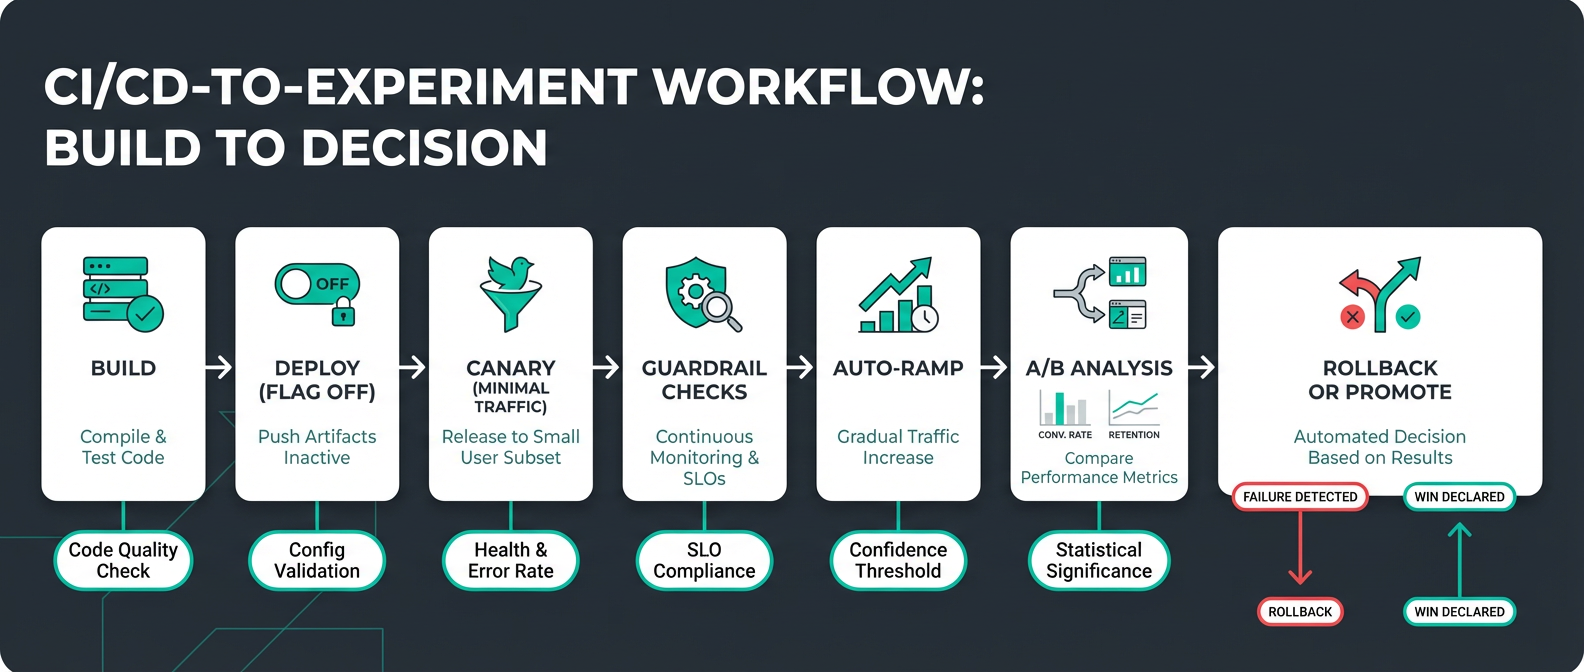
The seven stages are built into your pipeline and completed with minimal human intervention:
- Build and test. Catch issues before they ship. Pre-production unit, regression, smoke, and integration testing is incorporated into code builds and repository merges.
- Deploy, but keep new features inactive. Launch new features but keep them dark behind conditional statements that evaluate a feature flag. New features are in production but hidden.
- Canary at 1%. Enable the flag for a small slice of real traffic. This achieves engineering verification of new code under production traffic and processing loads. At this point, the blast radius of these issues is minimal and they are quickly isolated and resolved.
- Check guardrails. Automated monitoring reports error rate, latency, performance, and business KPIs. A powerful statistical analysis engine measures metrics for feature flag variants against the baseline, detects statistical significance, and alerts on positive or negative impact at the feature level.
- Auto-ramp. Expand the audience for each feature by progressively increasing real-user exposure as you continue to monitor guardrails, for example 1% → 5% → 25% → 50% → 75% → 100%. A deterministic feature flag assignment algorithm controls the gradual increase in audience size and ensures that users aren’t repeatedly flipped between feature variants.
- A/B Analysis. Automatically calculate metrics and generate data analysis charts for feature variant comparison. Executive dashboards show experiment velocity, win rates, and KPI lift to demonstrate ROI and guide strategic decisions.
- Auto-rollback or promote. Thresholds crossed? The system reverts a feature without waiting for a human to notice, while you sleep.
Sample sizes matter more than most teams realize
A common mistake is ramping too fast and drawing conclusions from thin data. If your sample size is too low, your experiment will be underpowered, and you will be unlikely to detect a reasonably-sized impact. Calculate that you have a large enough sample to be able to detect impacts of the size that are important to you.
Progressive experimentation requires patience. Premature conclusions produce unreliable results, and unreliable results produce bad decisions.
Governance isn't overhead, it's insurance
Every experiment should have a documented hypothesis, defined success metrics, blast radius assessment, and rollback plan before it touches production. Feature flag lifecycle management also keeps technical debt from quietly accumulating—flags that never get retired are toggle debt and a production surprise waiting to happen.
Turn Every Release Into a Measured Experiment
The goal isn't just fewer 3 a.m. incidents, though that's a welcome side effect. The real win is replacing gut feel with data at every stage of delivery.
With modern testing in production: feature flags decouple deploy from release, progressive ramps limit blast radius, AI-powered guardrails catch regressions before they spread, and centralized analytics replace the multi-tool sprawl that makes experimentation feel expensive.
Every time you release a feature you can ramp gradually up to 100% using percentage-based rollouts, alert on specific pre-decided latency increases, and enforce minimum sample sizes before promotion. Let every release become a decision backed by actual evidence, not optimism.
Harness Feature Management & Experimentation consolidates flags, release monitoring, and A/B testing, so every deployment is a controlled experiment—not a gamble.
Safe A/B Testing in Production: Frequently Asked Questions
How do you pick guardrail metrics without blocking every release?
Start with your existing SLO metrics and be conservative. Grafana's SLO guidance recommends event-based SLIs over percentiles for cleaner signals. Focus on business-critical user journeys first.
What's a practical ramp schedule for a mid-sized SaaS team?
Every team has slightly different criteria to consider before safely ramping up. Release monitoring with automated guardrails removes the need for someone to manually review metrics at each stage—which is the only way this actually scales.
How do you handle sample ratio mismatch?
Monitor assignment ratios continuously using chi-squared tests. Harness FME’s attribution and exclusion algorithm is honed to ensure accurate samples. In addition, FME reassesses experiment health in real-time, including sample ratio.
Filter bot traffic early too. Microsoft's bot detection research shows bots can skew conversion rates by 15–30%. Behavioral signals like sub-10-second session duration or unusual referrer patterns are a practical starting point for exclusion algorithms.
Should you A/B test infrastructure changes or just product features?
A/B testing works best for user-facing changes where behavior matters. Infrastructure changes are better suited to progressive rollouts with guardrail monitoring—different changes, different success metrics. Performance and reliability for engineering experiments; conversion and engagement for growth. Keep the tooling integrated in your pipeline either way.
How do you maintain consistent user experiences across devices and services?
Deterministic hashing on stable user IDs. Hash user ID plus experiment name to generate consistent assignments and make sure the same user sees the same variant whether they're on mobile, desktop, or clearing cookies every 20 minutes. Avoid session-based bucketing—it creates flickering experiences, causes re-bucketing, and erodes trust in experiment data. Lean on SDK-side evaluation for consistency that holds across your entire stack.

Beyond the Big Bang: De-risking Cloud Migrations with Progressive Delivery
At 2 am, your migration goes live. By 2:07, error rates spike, and rollback isn’t an option. Cloud migrations, API rewrites, and architecture transformations rarely fail because of bad code. They fail because of how that code is released.
Most teams still rely on a “big bang” cutover where infrastructure, services, and user-facing changes go live at once. This concentrates risk into a single moment. When something breaks, rollback is slow, visibility is limited, and the blast radius is large.
This is not just anecdotal. According to BCG, more than half of transformation efforts fail to achieve their intended outcomes within three years.
The difference between success and failure is not the migration itself. It is the release strategy.
Cloud Migration Is Not a Single Change
“Cloud migration” sounds simple, but in practice, it is a layered transformation.
Most migrations combine several of the following:
- Monolith to microservices
- API or data pipeline rewrites
- Frontend or UI rebuilds
- On-prem to cloud infrastructure moves
- Introduction of new service layers
These rarely happen in isolation. Teams often try to ship them together in a single coordinated release. That coupling increases complexity and multiplies risk.
Before your next migration, list every system involved. If they are all released together, you are carrying unnecessary risk.
The Core Anti-Pattern: Big Bang Releases
The failure mode is consistent:
- A new service is deployed
- Infrastructure flips to the cloud
- A redesigned UI is released
- All at once
There is no safe way to validate behavior in production. There is no gradual exposure. Rollback often requires redeploying an old stack that may no longer be compatible.
Even worse, teams lack a reliable baseline. They cannot answer simple questions:
- Is performance better?
- Is the cost lower?
- Is reliability improved?
Without that, migration becomes guesswork.
Decoupling Deployment from Release
Modern teams are adopting a different model:
- Deploy code anytime. Release it gradually.
Feature flags provide a control layer that separates deployment from exposure. Code can exist in production without being active for all users.
This enables:
- Controlled rollout by percentage, region, or cohort
- Instant rollback without redeployment
- Real-time measurement tied to specific changes
Start by putting one service behind a feature flag and releasing it to internal users first.
Progressive Delivery for Migrations
Replace Cutovers with Progressive Rollouts
Instead of switching everything at once:
- Deploy the new system alongside the old one
- Route a small percentage of traffic
- Observe behavior
- Increase exposure gradually
If something fails, you reduce traffic or revert instantly.
This shifts migration from a single high-risk event to a series of measurable steps.
The Strangler Fig Pattern in Practice
A common migration strategy is the strangler fig pattern.
- Build new functionality alongside the legacy system
- Gradually route traffic to the new components
- Retire legacy code over time
Feature flags make this executable in production by controlling routing and exposure. But to make this work in practice, you need a control layer that can manage traffic in real time.
How Progressive Migration Actually Works
Below is a simplified view of how feature flags act as a control plane during migration:
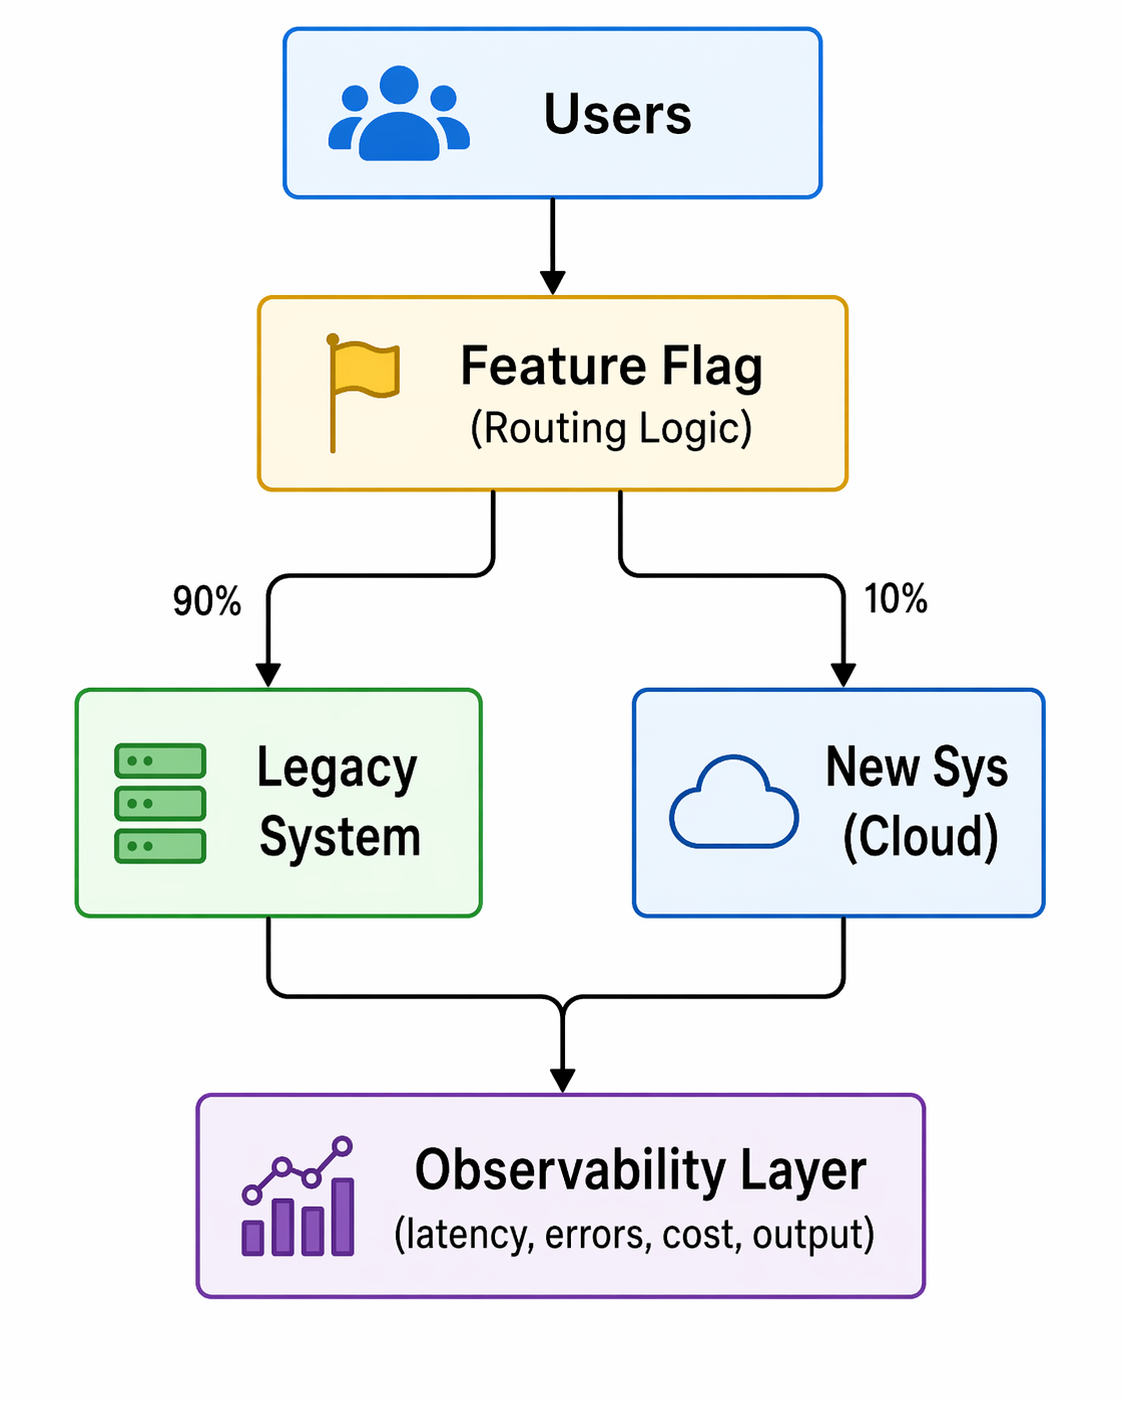
Fig: Feature-flag–driven progressive traffic routing during migration
Two things matter here:
- Routing control: traffic can be shifted gradually
- Measurement: metrics are tied to each variation
This is not just a toggle. It is a runtime decision and an observability layer.
Measure What Actually Matters
A successful migration is not defined by deployment success. It is defined by outcomes.
Key metrics include:
- Latency and throughput
- Error rates
- Infrastructure cost
- Output correctness
These metrics are not theoretical. They are what teams use to validate migrations in real production environments.
Real Example: Dual Pipeline Migration
In the Beyond the Toggle ebook, a legacy Spark batch pipeline was replaced with a streaming architecture, with a progressive rollout rather than a cutover.
- Both pipelines ran in production
- A feature flag routed traffic between them
- Metrics were compared in real time
The new system showed faster processing and lower costs before the full rollout.
From the webinar, teams often go further:
- Run both systems simultaneously
- Compare outputs for correctness
- Measure performance differences per request
This allows validation of both performance and data integrity before committing.
Define your baseline metrics before migration. If you cannot measure improvement, you cannot prove success.
Staging Lies. Production Doesn’t.
Staging environments cannot replicate production conditions. They lack:
- Real traffic patterns
- Data scale
- Edge cases
Feature flags enable safe production testing through controlled exposure.
Common Patterns
- Canary releases by percentage or region
- Cohort-based rollouts (geo, customer segment)
- Dual execution for validation
Not all canary releases are percentage-based. Some teams roll out by country or user segment first, then expand globally.
Guardrails
To make this safe:
- Automated rollback based on thresholds
- Feature-level observability
- Access control and audit logs
Decision Making: Continuous Go / No-Go
A migration is a sequence of decisions, not a single moment.
At each stage:
- Define the metric
- Measure impact
- Decide to expand or roll back
In one example from the webinar:
- A rollout reached 30% traffic
- Error rates increased
- Traffic was reduced to 20%
- The issue was isolated and fixed
- Rollout continued safely
This approach removes pressure from a single “launch moment” and distributes risk across stages.
Advanced Considerations for Developers
Feature Flag Performance and Reliability
Modern flag systems avoid becoming a bottleneck:
- Evaluations happen locally via SDKs
- Configurations are cached
- Systems continue operating even if the flag service is unavailable
This ensures minimal latency and high reliability.
Handling Complex Systems
Not all migrations are equal.
- Data pipelines and database paths require more planning
- Read and write paths may need staged transitions
- Flags still apply, but design complexity increases
The key is incremental transition, not avoidance.
Managing Flag Lifecycle and Tech Debt
Feature flags are temporary by design.
If left unmanaged, they accumulate and create complexity. Teams need:
- Visibility into flag state and usage
- Defined lifecycle policies
- Cleanup after full rollout
Emerging approaches include automation that detects stale flags and generates pull requests to remove them.
This Is a Delivery Strategy Change
Adopting progressive delivery is not just a tooling decision. It changes how teams release software.
Key considerations:
- Align with existing change management processes
- Integrate flags into CI/CD pipelines
- Maintain governance and auditability
Feature flags do not bypass controls. They enhance them by adding visibility and control at runtime.
What to Look for in a Feature Flag Platform
For migration use cases, a Feature Flag platform should provide:
- Tight integration with CI/CD pipelines
- Built-in experimentation and metrics
- Governance, approvals, and audit logs
- Developer-friendly SDKs and workflows
Flags should not feel like a bolt-on. They should be part of how software is built and released.
Conclusion: From Risk Event to Controlled Process
The biggest mistake teams make is treating migration as a moment.
It is not.
It is a controlled progression of changes, each validated in production under real conditions.
Feature flags enable this by:
- Decoupling deployment from release
- Enabling gradual exposure
- Providing real-time measurement
- Allowing instant rollback
The result is simple:
Migrations become reversible, observable, and data-driven.
Want a deeper breakdown of these patterns and real-world examples? Read the full ebook or see a demo.

The Complete Guide to Feature Testing for Modern DevOps Teams
Today’s teams are challenged to ship fast without breaking things. Traditional deployment strategies tie every code change directly to user exposure, forcing teams to trade velocity for safety and live with stressful, all-or-nothing releases.
Feature testing changes that.
In modern DevOps, you don't have to cross your fingers during a big-bang rollout. Instead, you can use feature testing strategies to deploy code in the "off" state behind feature flags and then progressively make it available to real users through controlled rollouts, experiments, and real-time verification. You check to see if the feature works, if it works as expected, and if it demonstrably improves key metrics before you go all the way.
Harness Feature Management & Experimentation (FME) combines enterprise-scale feature flags, AI-driven release monitoring, and automated rollbacks into a single platform that eliminates manual toil and dramatically reduces the blast radius of every change.
Key Takeaways:
- Feature testing uses feature flags, progressive delivery, and experiments to make sure that new features work safely in real-world settings before they are fully rolled out.
- Automated guardrails, AI-driven verification, and instant rollbacks take the place of manual deployment babysitting and lower the risk of production releases.
- As your feature testing program grows, good governance, lifecycle management, and observability keep feature flags from becoming technical debt.
The Practical Benefit of Feature Testing
Feature testing is the practice of validating individual product features or changes by turning them on for specific users or segments, measuring their impact, and iterating based on real data. Instead of treating a release as a binary “on/off” event, you treat each feature as something you can test, tune, and prove in production-like conditions.
In practical terms, feature testing usually combines:
- Feature flags (toggles) that control who sees a feature and when.
- Progressive rollouts that move from a small percentage of traffic to full exposure based on guardrails.
- Experimentation and analytics to compare “feature on” vs “feature off” or different configurations of the same feature.
Compared to traditional functional testing, which answers “does this feature work according to spec?” and is well covered in Microsoft testing best practices documentation, feature testing answers broader questions: “Does this feature behave correctly under real load, in real environments, and does it actually improve user or business outcomes?”
How Feature Testing Improves Deployment Safety in CI/CD Pipelines
In many pipelines, code changes and user exposure are tightly coupled: once you deploy, everyone sees the change. That’s what creates big-bang releases, long regression cycles, and weekend war rooms, and it clashes with Google’s Site Reliability Engineering practices, which focus on balancing speed and reliability.
Modern feature testing in CI/CD improves safety through three mechanisms: safe deployments, cross-pipeline validation, and automated guardrails.
1. Deploy Code Safely in the “Off” State
With feature testing, new functionality is put behind feature flags. You deploy to production with flags disabled, so the code is present but dormant. If something goes wrong, you don’t scramble to roll back an entire deployment; you switch off a specific feature in seconds.
This pattern:
- Controls and minimizes the blast radius of each change.
- Enables safe testing in production, exposing a new feature to specific teams or selected beta users before making it generally available.
- Supports trunk-based development, where teams continuously merge small changes without exposing half-finished work.
You can reinforce these best practices with Harness CD’s ability to deploy anywhere across clusters, regions, and environments.
2. Validate Early in CI, Verify Live in CD
Feature testing spreads risk management across the pipeline. In CI, you run automated tests and static checks to catch regressions before code ever reaches production. In CD, you gradually enable the feature for real-world traffic and measure its impact on performance and behavior.
- CI validation ensures that the feature doesn’t break existing contracts or core flows.
- CD verification checks how the feature behaves under active real-world workloads, infrastructure, and user patterns.
To keep feedback loops tight, teams can use Harness CI Test Intelligence and Incremental Builds so that only the tests and assets impacted by feature changes are rebuilt and run. That means faster builds and more iterations of feature tests per day.
3. Replace Manual Monitoring with Automated Guardrails
Manual deployment babysitting doesn’t scale. Engineers watch dashboards, refresh logs, and debate in chats about whether a metric “looks bad enough” to roll back. We’ve all been there. Modern feature testing replaces these outdated practices with explicit guardrails tied to each feature.
You define thresholds for:
- System metrics (error rates, p95 latency, memory, CPU)
- User behavior (conversion, click-through, drop-off, task completion)
- Business KPIs (revenue per session, subscription starts, trial activations)
When metrics drift beyond acceptable ranges for a feature test, automated systems pause the rollout or roll the feature back automatically. Harness CD’s AI-assisted deployment verification and metric alert webhooks make these guardrails part of your standard pipeline.
Types of Feature Tests You’ll Actually Run
In practice, most teams cycle through a few common patterns of feature testing:
- Fit Validation Tests: Turn a feature on for a small audience (e.g. 1–5% of traffic) and measure these users’ key performance indicators. Compare these measurements with the KPIs of users who don’t see the feature. This answers “should we keep this feature at all?”
- Configuration and Variant Tests: Run different configurations of the same feature (layout, copy, price points, algorithm parameters) as variations. Measure which variant performs best, then roll out the winner.
- Rollout / Guardrail Tests: Use percentage-based ramps (1% → 5% → 25% → 50% → 100%) and validate guardrails at each stage. If a guardrail is breached, automatically roll the feature back.
- Performance and Reliability Tests: Turn the feature on in environments or segments that mimic worst-case scenarios (high load, specific device types, critical user journeys) to catch performance regressions before broad release.
- Long-Running Optimization Tests: Keep mature features under ongoing feature tests to continually refine configurations; for example, tuning search ranking, recommendation models, or pricing logic over time.
Enterprise Feature Flags: Best Practices for Sustainable Feature Testing
Naming, ownership, and lifecycle policies ensure that feature flagging remains an asset and essential tool to your engineering team, and never becomes technical debt.
Adopt these practices:
- Name flags with intent and an expiration horizon. Use descriptive patterns like checkout_v2_rollout_2026q1 and tag flags as “experiment,” “ops kill switch,” or “permanent config.” Temporary flags should have 30–90 day retirement targets.
- Assign clear ownership and document the business context. Every flag should have an owner, a purpose, and a link to the initiative or experiment it supports. When the experiment ends, the owner is accountable for the cleanup.
- Manage the entire feature flag lifecycle with pipelines. Standardize and take feature flag testing through each stage (e.g. internal testing, pre-production, external beta, experimenting, ramping, 100% released, removed from code) by using pipeline steps. You can use pipeline templates to ensure quality feature testing, visibility across teams, and flag cleanup.
- Evaluate flags locally for performance. Use SDKs that evaluate rules in memory with typed configurations and caching, so each flag check is sub-millisecond and doesn’t depend on a remote call. This keeps feature testing safe even at billions of evaluations per day.
- Target users with rich attributes and percentage controls. Roll out by segments (customer tier, geography, device type, beta cohort) with granular percentage ramps instead of flipping everything at once.
- Wire guardrails to real business KPIs, not just system metrics. Error rates are necessary but not sufficient. Great feature testing also measures how the feature affects conversion, retention, and revenue.
Tools like Harness FME help enforce these policies with lifecycle management, analytics, and governance built in.
Progressive Delivery with AI Verification and Safe Rollbacks
Progressive delivery is the natural evolution of continuous delivery: instead of shipping a change straight to 100% of users, you roll it out gradually while continuously evaluating its impact. Feature testing is how you operationalize progressive delivery day to day.
A typical progressive feature test might look like this:
- Stage 1: 1% of traffic
Validate that the feature works end-to-end and doesn’t cause obvious errors or crashes. - Stage 2: 5–10% of traffic
Watch performance metrics (latency, error rate) and basic user behavior (clicks, drop-offs). - Stage 3: 25–50% of traffic
Evaluate deeper KPIs such as conversion, sign-ups, and revenue per session. - Stage 4: 100% rollout
Once guardrails are stable and the feature’s impact is positive, promote to full exposure and clean up any temporary flags.
AI-driven verification makes this sustainable. Instead of manually eyeballing dashboards, you reuse the same guardrails you defined earlier and let the platform detect when a feature test is outside your risk tolerance.
Harness CD can automatically pause or roll back using AI-assisted deployment verification and your chosen rollback strategy. Combined with Harness FME, that rollback can be as simple as deactivating the flag—no new deployment required.
Feature Testing Best Practices for DevOps Teams
To get consistent results from feature testing, treat it as a disciplined practice, not just “turning on flags in prod.” You’ll see the same theme in Google SRE's reliability testing guidance, where tests are treated as a first-class component of the software development lifecycle, essential to running reliable systems.
Anchor your testing practices on these principles:
- Start feature testing on critical flows first. Begin where mistakes are most expensive: checkout, signup, onboarding, pricing, and core workflows.
- Define clear hypotheses and success metrics before you flip a flag. “We expect this new checkout step to increase completion rate by 2–3% without hurting latency” is testable. “Let’s see what happens” is not.
- Keep environments and identifiers stable. Feature testing benefits from stable user identifiers, consistent flag keys, and predictable routing, ensuring results are trustworthy.
- Automate as much as possible in CI/CD. Use pipelines to create, validate, and retire feature tests rather than managing flags manually. Harness CD’s powerful pipelines and DevOps pipeline governance help you standardize how feature tests are approved, rolled out, and cleaned up.
- Centralize visibility and analytics. Tie feature tests to dashboards that show both technical and business impact. This is a cinch with the FME experimentation dashboard that lays out all key, guardrail, and supporting metrics for any feature test, and then digs deeper with sophisticated analysis charts for each metric. The dashboard comes complete with health checks and AI analytics for a comprehensive, at-a-glance view of “what did this feature test actually do?”
How Harness Supports Feature Testing Across CI, CD, and FME
Harness is built to make feature testing the default, not the exception.
- In CI: Speed up builds and tests so you can run more feature tests per day without burning developers on long waits.
- In CD: Model progressive delivery strategies as visual or YAML pipelines, apply Policy as Code for approvals and freeze windows, and let AI-driven verification enforce guardrails automatically.
- In Feature Management & Experimentation (FME): Create flags, define targeting rules, attach metrics, and run experiments, all from a single place. With a patented attribution engine, FME shows how each feature test affects your KPIs, even when multiple features are rolled out concurrently.
The result: feature testing isn’t a side project. It is central to how your team ships every meaningful change.
Make Safer Releases Your Default with Harness FME
Feature testing turns deployment anxiety into routine confidence. By separating code deployment from feature release, you ship more often, test more ideas, and protect your users and your business.
With Harness, you get enterprise-scale feature flags, AI-powered release monitoring, and automated rollbacks built into the same platform you already use for CI and CD. Feature tests become standard operating procedure, not a special-case process.
Ready to move beyond big-bang releases and manual deployment babysitting? Start running your first production-safe feature tests with Feature Management & Experimentation and make safer releases your default.
Feature Testing: Frequently Asked Questions (FAQs)
Once you start using feature flags and progressive delivery, new questions show up fast, so this feature testing FAQ gives you straightforward answers for day-to-day practice.
What is feature testing, and how is it different from functional testing?
Feature testing uses flags, rollouts, and metrics to check how a feature works and affects users in the wild. Functional testing checks if the feature meets specification requirements, while feature testing checks if it works in real life and makes things better.
How does feature testing work with feature flags and progressive delivery?
With feature flags, you can turn features on or off for specific users or groups (or a percentage of users) without having to redeploy. Progressive delivery uses those flags to progressively expose features to a larger audience while you watch guardrails. Together, they let you run safe feature tests, roll out winners, and quickly roll back changes that don't work.
When is it better to do a feature test than a regular A/B test?
When you change the core functionality, infrastructure behavior, or anything else that could affect performance, reliability, or critical flows, you should use feature testing. Classic A/B tests are great for making small changes to the user experience or content, but feature testing is better for bigger changes to the product or engineering that need close control and the ability to roll back.
Does feature testing hurt performance in production environments?
Done correctly, no. Modern SDKs evaluate flags locally in memory with minimal CPU overhead and avoid remote calls on every request. The time required to pull the initial payload (feature flag and segment definitions) can be reduced to milliseconds by using edge computing, streaming, caching, flag sets, and other optimization strategies.
How do I prevent feature flags for testing from creating technical debt?
Give flags clear names, give them owners, set expiration dates, and make sure that cleanup is part of your pipelines, just like you would with code. Enterprise tools like Harness FME and Harness CD governance help you set and enforce lifecycle policies, surface old flags, and preclude any accumulation of tech debt.
How can Harness help automate feature testing and rollouts across CI/CD?
Harness brings together fast, smart CI; policy-driven CD with AI verification; and feature management with built-in experimentation. You set up feature tests once, add metrics, and then the platform takes care of progressive rollouts, guardrail enforcement, and rollbacks in all of your environments.
.png)
A/B Testing Tools: The CTO's Guide to Safe and Measurable Change
- Unified experimentation platforms that combine feature flags, progressive delivery, and real-time analytics make it safer, faster, and easier for CTOs to measure innovation.
- AI-powered guardrails and automated issue detection lower operational risk.Teams find and fix problems early, while still maintaining enterprise-level governance.
- Deep integration with CI/CD pipelines and observability tools means developers experiment every day — and every release is tied to data and real business outcomes.
Picture this: It's 2 a.m. Your phone is buzzing. A new feature just went out to your entire user base, and conversion rates are tanking. Your on-call engineer is digging through logs, your Slack channels are on fire, and you’re left wondering, Why didn't we just test this first?
Every CTO has a version of this story. And most of them have quietly vowed never to repeat it.
Harvard Business School studied 35,000 startups and found that companies using A/B testing had 10% more page views and were 5% more likely to raise VC funding. That's the difference between a product that proves itself and one that guesses its way forward. But here's the problem: too many engineering teams are still stitching together fragmented tools that create operational risk instead of reducing it.
The right experimentation platform changes that. It combines feature flags, progressive delivery, and real-time analytics in a single developer-first system. This gives your team governance, guardrails, and measurable ROI to ship with confidence. That's exactly what modern platforms like Harness Feature Management & Experimentation (FME) accomplish.
What CTOs Actually Need From A/B Testing Tools
Here's something that doesn't get said enough: the best A/B testing tools aren't separate systems — they're extensions of the development workflow your team already uses.
Think about what happens when you bolt on a standalone experimentation tool. This tasks the team with an extra dashboard to check or additional data source to reconcile, that doesn't quite sync with your monitoring stack. Friction ensues, and friction kills adoption.
What you actually need is a platform with:
- GitOps-compatible flag management so experimental changes move through the same review and audit flow as code
- Observability integrations that correlate exposure data with your monitoring stack — no manual cross-referencing required
- Code review processes that stay intact when an experiment goes live, rather than get bypassed
- Role-based access controls, approval workflows, and immutable audit trails for regulated industries like fintech, healthcare, or anything that touches PII — table stakes, not nice-to-haves
The bottom line: CTOs need platforms that prove their value through measurable outcomes, reduced deployment failures, faster release cycles, and clear KPI improvements tied to specific experiments. That's the metrics-driven visibility that technology investments expect.
- Progressive Delivery: Stop Shipping to Everyone at Once
Imagine rolling out a new checkout flow to your entire user base on a Tuesday afternoon, only to realize three hours later that it breaks on Safari. That's a Tuesday you don't want to have.
Progressive delivery is how you avoid it. The idea is simple: start small, watch closely, and scale strategically. You begin with a canary release and ramp gradually as performance metrics confirm everything is working. Research backs this up: canaries surface faults at just 5% exposure, which drops change failure rates from 14.7% to 6.2%. That's not just a marginal gain. It’s a strong boost to your reputation that positions you over and above the competition.
The real unlock is automated guardrails. Instead of relying on an engineer to catch a latency spike at midnight, you configure release monitoring to halt or roll back deployments automatically when thresholds are breached.
- Feature Flag Management: Ship the Code, Control the Experience
One of the most powerful mindset shifts in modern software delivery is this: deploying code and releasing features are two completely different things. Feature flags are what make that separation real.
When you ship features off by default, you eliminate the risk of unproven code reaching users before it's ready. You can push continuously while controlling exactly what each user sees, in real time, without a new deployment. For CTOs managing large engineering orgs, that's a significant operational win. Teams ship faster and experience 45% fewer deployment-related incidents when flag lifecycles are properly managed.
Harness Feature Management gives enterprise teams the foundation to make this work at scale. A few practices that separate mature feature flag management from the cobbled-together kind:
- Ship features off by default: Deploy new functionality behind flags set to "off" and activate when ready. Then release progressively while maintaining careful control of blast radius and a close watch on guardrails.
- Maximize the benefits of trunk-based development: Feature flags dovetail perfectly with all the benefits of trunk-based development, where teams incrementally commit new features within inactive paths gated by feature flags. These incremental commits save your developers from the “merge hell” of guessing their way through manual conflict resolution shortly before each release.
- Set flag ownership and expiration dates: Assign each flag to a specific owner and establish automatic sunset policies to keep your codebase clean. Amazon mandates flag removal tasks at creation time — it's a practice worth borrowing.
- Target specific environments and user segments: Test safely with internal teams, beta users, or specific geographies before a broader rollout.
- Monitor flag hygiene with dashboards: Track flag age, usage patterns, and removal rates to prevent technical debt from building up across your engineering org.
- Treat flag changes like code changes: Route configuration updates through version control, approval processes, and audit logs.
- Cache flags locally for business continuity: Ensure features stay available, even if the flag management service goes down.
- Real-Time Impact Analysis: Know in Minutes, Not Days
Old-school A/B testing had a cadence to it. You'd launch a test, wait a week for statistical significance, pull a report, schedule a readout, and take 2 weeks to make a decision that should have been obvious in 48 hours.
Real-time impact analysis changes that rhythm entirely. When a gradual release starts, modern platforms like Harness FME auto-capture performance and error metrics, letting teams validate impact within minutes instead of days. That kind of speed fundamentally changes how your team operates — you're iterating faster because you're learning faster.
But speed without accuracy is its own problem. There's nothing more frustrating than pausing a successful experiment because a guardrail fired on noisy data. Set your decision thresholds upfront — for example, pause if conversion delta drops below 0.5% with a p-value above 0.1 — and lean on automated guardrails to protect against false positives that kill valuable experiments before they can prove themselves.
- AI-Driven Experimentation: Less Setup, Smarter Guardrails
Setting up a well-designed experiment used to take days. Someone had to manually configure segments, calculate sample sizes, check for bias, estimate time-to-significance, and then monitor the whole thing while also doing their actual job. It's no wonder teams cut corners.
AI takes care of the tedious, error-prone manual work in minutes, and empowers your engineers to engage their creativity, anticipate learning, and reap the rewards.
Some of the benefits of AI-driven experimentation:
- Intelligent test setup and targeting. AI analyzes historical data to suggest high-value segments, anticipate seasonality patterns in flag traffic and experiments, and alert you to biased tests before launch — so you're not three weeks in before realizing your sample size was never going to get you to significance.
- Real-time anomaly detection. Research shows that ML-based systems achieve both increased speed and superior accuracy in real-time anomaly detection. Detection speed is boosted by 35% while accuracy improves by 40% — a clear win-win.
- AI-powered decision recommendations. Platforms like Harness Release Agent analyze results in real time and give clear guidance — roll out, roll back, or refine — speeding up iteration cycles by 3x.
- Predictive impact forecasting. AI estimates long-term effects using patterns from similar past experiments, which is especially valuable for metrics like customer lifetime value that take months to materialize on their own.
- Developer Workflow Integration: Experiments Belong in the Pipeline
Here's a question worth asking honestly: if running an experiment requires a developer to step outside their normal workflow, how often do you think they're actually going to do it?
The answer, in most orgs, is "not as often as they should." And that's not a people problem — it's a tooling problem.
Successful experimentation means embedding tests within your existing development processes, not running them alongside them. Modern platforms trigger flag changes through GitOps workflows, CLI commands, or pipeline steps, keeping experimental changes in the same review and audit flow as code deployments. When something goes sideways during an incident, your on-call engineer shouldn't have to cross-reference three different dashboards to figure out which feature caused the spike.
The best platforms sync exposure data directly with your observability stack so feature context surfaces right where the team is already looking. Harness integrates with Datadog, New Relic, and Sentry to correlate feature exposure with performance metrics — and SDKs handle low-latency evaluation and graceful degradation so experiments don't become a reliability liability.
- Automated Issue Detection: Stop a Bad Rollout Before It Costs You
Ask any CTO who's lived through a bad deploy how much a few minutes of slow detection costs. The answer usually involves a very uncomfortable number and a very uncomfortable conversation with the CEO. Bad rollouts cost thousands in revenue per minute and damage customer trust in ways that are genuinely hard to recover from.
Automated issue detection is your safety net. Modern platforms correlate performance degradation directly with specific feature toggles, which means you know which feature caused the problem — not just that something is wrong. A few capabilities that matter here:
- Auto-correlate metrics with feature exposure. Track real-time error rates, latency percentiles, and conversion metrics to pinpoint which flag caused a regression, even when multiple features rolled out at the same time.
- Define SLO-based rollback policies. Set automated triggers like "revert if p95 latency increases more than 10% for 84 seconds" — no guesswork, no late-night judgment calls.
- Surface exact feature and cohort context. Give on-call engineers the problematic flag, affected user segment, and rollout percentage up front. No debugging across multiple systems required.
- Trigger instant flag deactivation. Kill a problematic feature in under 5 seconds — dramatically faster than any hotfix deployment.
- Minimize false positive alerts. Use workload-aware baseline modeling and fixed horizon testing to distinguish genuine regressions from normal traffic variation. Your engineers don't need more alert fatigue.
- Enterprise-Grade Security: Governance That Doesn't Slow You Down
There's a version of governance that genuinely protects your organization. And then there's the kind that just adds friction until engineers find workarounds. The goal is the first kind.
Regulated teams need RBAC and SAML federation to centralize identity management, and Policy as Code enforcement through tools like Open Policy Agent — defining exactly who can create experiments, which environments require approvals, and what configurations trigger automatic reviews.
Beyond access controls, compliance requires immutable audit logs that capture every exposure decision, configuration change, and rollback across environments. Data encryption in transit and at rest, along with geography-aware PII controls, are non-negotiable for maintaining full visibility into who changed what, when, and why.
- Targeted Rollouts: The Right Users at the Right Time
There's a big difference between rolling a feature out to 10% of users randomly and rolling it out to 10% of your highest-value accounts. One gives you a noisy signal. The other gives you feedback that actually helps you make a confident decision.
Targeted rollouts let you validate changes with the right cohorts, directly improving your risk profile and time-to-value.
- Target high-value segments first. Use account tier, geography, or device type to expose features to priority cohorts who can give you actionable feedback before a broader release.
- Implement allow/deny lists for predictable exposure. Explicit inclusion and exclusion rules based on user attributes or risk scores keep sensitive cohorts protected from experimental changes.
- Use percentage rollouts within segments. Start at 1–5% within your target segment and increase gradually based on performance metrics and user feedback.
- Isolate high-risk changes to internal teams first. Deploy disruptive features to internal users or beta customers before your broader base. Catch issues when the blast radius is small.
- Leverage entitlement-based targeting. Route features based on subscription tiers or account permissions so premium features reach paying customers first.
- Monitor segment-level performance in real time. Track conversion rates and technical performance per segment to make data-driven decisions about expanding or rolling back exposure.
- Psychological Safety: Making It Safe to Ship
This one doesn't show up in enough engineering conversations, but it should. The fear of shipping is real — and it's one of the most underrated blockers to innovation in engineering orgs.
When your team knows that a bad deployment means an after-hours all-hands incident and two days of rollback work, they slow down. They second-guess. They push for longer QA cycles and bigger batch releases, which ironically makes each release riskier, not safer.
Feature flags break that cycle. When you can deploy small changes behind flags and roll back instantly — in seconds, not hours — the stakes drop dramatically. Research shows that psychological safety increases learning behaviors by 62%. That's your team trying things, learning faster, and compounding their improvements over time instead of shipping in fear.
One Speedway Motors director put it plainly: the psychological safety their experimentation platform provides gets mentioned in annual performance reviews. That's not a technical win — it's a cultural one. Harness FME enables exactly this by decoupling deploy from release, codifying rollback plans, and setting pre-commit metrics that remove the ambiguity that kills confidence during incidents.
- Data-Driven Releases: Connecting Tests to What the Board Cares About
"Our test showed a lift in engagement" is not a sentence that moves a board meeting. "This experiment drove a 3.2% improvement in 90-day retention, which maps to $X in annual recurring revenue" — that one gets attention.
Effective data-driven release strategy means connecting every experiment to metrics that actually matter at the executive level.
- Connect experiments to revenue metrics. Focus on retention, cost-to-serve, and other KPIs that directly impact valuation and stakeholder value. Vanity metrics don't close funding rounds.
- Define decision rules before testing begins. Set significance level, statistical power (typically 80%), and minimum detectable effect upfront. Without this, you're p-hacking, whether you mean to or not.
- Build executive dashboards. Surface cycle time, failure rates, and KPI lift per experiment, so leadership has real-time visibility into both experiment performance and business outcomes.
- Implement sequential testing for faster decisions. Use statistical approaches that enable valid interim analysis, so you can act on clear signals without waiting for predetermined sample sizes.
- Establish metric ownership across teams. Assign clear definitions, update frequencies, and accountability for each KPI to prevent measurement drift and maintain compliance alignment.
- Automate feature-to-KPI attribution. Connect feature flags directly to analytics platforms to capture performance data automatically and eliminate manual reporting delays.
Ship Confidently. Measure Everything. Repeat.
The 2 a.m. phone call doesn't have to be part of your story. With the right experimentation platform — one that combines controlled rollouts, real-time impact detection, and instant rollback — your team ships faster and your leadership sleeps better.
Research shows 82% of successful feature management teams monitor at the feature level, making every release measurable and data-driven. Progressive delivery with AI-driven guardrails doesn't just reduce technical risk. It reduces the hesitation around shipping that limits innovation in the first place.
See how Harness combines feature flags, experimentation, and release monitoring to accelerate your delivery pipeline while reducing risk.
A/B Testing Tools: Frequently Asked Questions (FAQs)
CTOs evaluating experimentation platforms face complex decisions about governance, compliance, and measurable business impact. These questions address the most common concerns around regulatory requirements, technical integration, and executive reporting.
How do A/B testing tools enforce governance and auditability in regulated industries?
Enterprise platforms provide immutable audit trails, role-based access controls, and approval workflows that meet compliance standards like HIPAA and SOX. Policy-as-code approaches enable automated compliance checks within CI/CD pipelines. Your platform should maintain timestamped logs of all experiment changes, user assignments, and rollback actions for regulatory review.
What's the difference between progressive delivery and classic A/B testing?
Progressive delivery uses feature flags to control exposure gradually (1% to 10% to 50%) while monitoring real-time performance metrics. Classic A/B testing typically splits traffic 50/50 for statistical comparison. Progressive approaches reduce blast radius and enable instant rollbacks without code deployments, making them safer for production environments.
How should experiments integrate with CI/CD and observability tooling?
Experiments should trigger through GitOps workflows and sync exposure data with your existing monitoring stack. Release monitoring capabilities correlate feature flags with error rates and latency spikes automatically. SDKs should provide low-latency evaluation and graceful degradation to protect system reliability during experiments.
What statistical methods and guardrails reduce false positives and risk?
Advanced sequential and fixed horizon testing methods enable continuous monitoring while controlling false positive rates. Pre-specify decision criteria, use variance reduction techniques, and implement multiple-testing corrections. Automated guardrails should halt experiments when SLO thresholds are breached and alert you to sample ratio mismatches.
How can a CTO tie experiment outcomes to executive KPIs and board reporting?
Establish an Overall Evaluation Criterion that cascades from product-level metrics to guardrails and diagnostics. Centralized metric definitions ensure consistent measurement across teams. Create executive dashboards showing experiment velocity, win rates, and KPI lift per quarter to demonstrate ROI and guide strategic decisions.

AI Ships More Code. Harness FME Helps You Release It Safely
- AI increased code velocity, but it also exposed how manual most release operations still are.
- Harness FME now fits directly into pipeline-driven workflows, so rollout, approvals, experimentation, and cleanup can follow one repeatable path.
- Recent policy integration adds governance where teams need it most: on flags, targeting rules, segments, and change requests.
- The value is platform-level because Harness connects delivery, release control, and policy enforcement in one system.
- Platform teams can move faster without creating feature flag sprawl, approval bottlenecks, or production rollout drift.
Feature flags with pipelines and policies help reduce risk
AI made writing code faster. It didn’t make releasing that code safer.
That’s the tension platform teams are dealing with right now. Development velocity is rising, but release operations still depend on too many manual decisions, too many disconnected tools, and too much tribal knowledge. Teams can deploy more often, but they still struggle to standardize how features are exposed, how approvals are handled, how risky changes are governed, and how old flags get cleaned up before they turn into debt.
That’s where the latest Harness FME integrations matter.
Harness Feature Management & Experimentation is no longer just a place to create flags and run tests. With recent pipeline integration and policy support, FME becomes part of a governed release system. That’s the bigger story.
Feature flags are valuable. But at scale, value comes from operationalizing them.
AI sped up code. It didn’t fix release operations.
The software delivery gap is getting easier to see.
In a recent Harness webinar, Lena Sano, a software developer on the Harness DevRel team and I framed the problem clearly: AI accelerates code creation, but the release system behind it often still looks manual, inconsistent, and fragile.
That perspective matters because both Lena and I sit close to the problem from different angles. I brought the platform and operating-model view. Lena showed what it actually looks like when feature release becomes pipeline-driven instead of person-driven.
The tension they described is familiar to most platform teams. When more code gets produced, more change reaches production readiness. That doesn’t automatically translate into safer releases. In fact, it usually exposes the opposite. Teams start batching more into each launch, rollout practices diverge from service to service, and approvals become a coordination tax instead of a control mechanism.
That’s why release discipline matters more in the AI era, not less.
Feature flags without pipelines don’t scale
Feature flags solve an important problem: they decouple deployment from release.
That alone is a major improvement. Teams can deploy code once, expose functionality gradually, target cohorts, run experiments, and disable a feature without redeploying the whole application.
But a flag by itself is not a release process.
I made the point directly in the webinar: feature flags are “the logical end of the pipeline process.” That line gets to the heart of the issue. When flags live outside the delivery workflow, teams get flexibility but not consistency. They can turn things on and off, but they still don’t have a standardized path for approvals, staged rollout, rollback decisions, or cleanup.
That’s where many programs stall. They adopt feature flags, but not feature operations.
The result is predictable:
- rollout patterns vary by team
- approvals happen too often or too late
- experiments live outside the release workflow
- stale flags stay in code far longer than they should
- governance turns into manual review instead of automation
This is why platform teams need more than flagging. They need a repeatable system around feature release.
Pipelines make feature release operational
The recent Harness FME pipeline integration addresses exactly that gap.
In the webinar demo, Lena showed a feature release workflow where the pipeline managed status updates, targeting changes, approvals, rollout progression, experiment review, and final cleanup. I later emphasized that “95% of it was run by a single pipeline.”
That’s not just a useful demo line. It’s the operating model platform teams have been asking for.
Standardized rollout states
The first value of pipeline integration is simple: teams get a common release language.
Instead of every service or squad improvising its own process, pipelines can define explicit rollout stages and expected transitions. A feature can move from beta to ramping to fully released in a consistent, visible way.
That sounds small, but it isn’t. Standardized states create transparency, reduce confusion during rollout, and make it easier for multiple teams to understand where a change actually is.
Approvals and evidence in one workflow
Approvals are often where release velocity goes to die.
Without pipelines, approvals happen per edit or through side channels. A release manager, product owner, or account team gets pulled in repeatedly, and the organization calls that governance.
It isn’t. It’s coordination overhead.
Harness pipelines make approvals part of the workflow itself. That means platform teams can consolidate approval logic, trigger it only when needed, and capture the decision in the same system that manages the rollout.
That matters operationally and organizationally. It reduces noise for approvers, creates auditability, and keeps release evidence close to the actual change.
Rollback paths that match the problem
One of the most useful ideas in the webinar was that rollback should depend on what actually failed.
If the problem is isolated to a feature treatment, flip the flag. If the issue lives in the deployment itself, use the pipeline rollback or redeploy path. That flexibility matters because forcing every incident through a full application rollback is both slower and more disruptive than it needs to be.
With FME integrated into pipelines, teams don’t have to choose one blunt response for every problem. They can respond with the right mechanism for the failure mode.
That’s how release systems get safer.
Cleanup built into the release lifecycle
Most organizations talk about flag debt after they’ve already created it.
The demo tackled that problem directly by making cleanup part of the release workflow. Once the winning variant was chosen and the feature was fully released, the pipeline paused for confirmation that the flag reference had been removed from code. Then targeting was disabled and the release path was completed.
That is a much stronger model than relying on someone to remember cleanup later.
Feature flags create leverage when they’re temporary control points. They create drag when they become permanent artifacts.
Policy is the missing control plane for feature management
Pipelines standardize motion. Policies standardize behavior.
That’s why the recent FME policy integration matters just as much as pipeline integration.
As organizations move from dozens of flags to hundreds or thousands, governance breaks down fast. Teams start hitting familiar failure modes: flags without owners, inconsistent naming, unsafe default treatments, production targeting mistakes, segments that expose sensitive information, and change requests that depend on people remembering the rules.
Policy support changes that.
Harness now brings Policy as Code into feature management so teams can enforce standards automatically instead of managing them with review boards and exceptions.
Governance without review-board bottlenecks
This is the core release management tradeoff most organizations get wrong.
They think the only way to increase safety is to add human checkpoints everywhere. That works for a while. Then scale arrives, and those checkpoints become the bottleneck.
Harness takes a better approach. Platform teams can define policies once using OPA and Rego, then have Harness automatically evaluate changes against those policy sets in real time.
That means developers get fast feedback without waiting for a meeting, and central teams still get enforceable guardrails.
That is what scalable governance looks like.
Guardrails for flags, targeting, segments, and change requests
The strongest part of the policy launch is that it doesn’t stop at the flag object itself.
It covers the areas where release risk actually shows up:
- Feature flags: enforce naming conventions, required ownership, tags, and metadata
- Targeting rules: block unsafe production rollouts, require safer defaults, and enforce environment-specific targeting rules
- Segments: prevent risky definitions, including segment patterns that could expose PII
- Change requests: require the right approvals and structure when sensitive rollout conditions are met
That matters because most rollout failures aren’t caused by the existence of a flag. They’re caused by how that flag is configured, targeted, or changed.
Flexible scope and inheritance across teams
Governance only works when it matches how organizations are structured.
Harness policy integration supports that with scope and inheritance across the account, organization, and project levels. Platform teams can set non-negotiable global guardrails where they need them, while still allowing business units or application teams to define more specific policies in the places that require flexibility.
That is how you avoid the two classic extremes: the wild west and the central committee.
Global standards stay global. Team-level nuance stays possible.
Why this is a platform story, not a feature story
The most important point here is not that Harness added two more capabilities.
It’s that these capabilities strengthen the same release system.
Pipelines standardize the path from deployment to rollout. FME controls release exposure, experimentation, and feature-level rollback. Policy as Code adds guardrails to how teams create and change those release controls. Put together, they form a more complete operating layer for software change.
That is the Harness platform value.
A point tool can help with feature flags. Another tool can manage pipelines. A separate policy engine can enforce standards. But when those pieces are disconnected, the organization has to do the integration work itself. Process drift creeps in between systems, and teams spend more time coordinating tools than governing change.
Harness moves that coordination into the platform.
This is the same platform logic that shows up across continuous delivery and GitOps, Feature Management & Experimentation, and modern progressive delivery strategies. The more release decisions can happen in one governed system, the less organizations have to rely on handoffs, tickets, and tribal knowledge.
A better operating model for platform teams
The webinar and the new integrations point to a clearer operating model for modern release management.
1. Deploy once, release gradually
Use CD to ship the application safely. Then use FME to expose the feature by cohort, percentage, region, or treatment.
2. Put rollout logic in the pipeline
Standardize stages, approvals, status transitions, and evidence collection so every release doesn’t invent its own operating model.
3. Enforce policy automatically
Move governance into Policy as Code. Don’t ask people to remember naming standards, metadata requirements, targeting limits, or approval conditions.
4. Preserve the right rollback options
Use the flag, the pipeline, or a redeploy path based on the actual failure mode. Don’t force every issue into one response pattern.
5. Remove flags before they become debt
Treat cleanup as a first-class release step, not a future best intention.
This is the shift platform engineering leaders should care about. The goal isn’t to add feature flags to the stack. It’s to build a governed release system that can absorb AI-era change volume without depending on heroics.
What engineering leaders should measure
If this model is working, the signal should show up in operational metrics.
Start with these:
- Change failure rate — are smaller, feature-level controls reducing risky releases?
- Mean time to recovery — can teams isolate and contain problems faster?
- Approval overhead per release — are approvals becoming more targeted and less repetitive?
- Flag lifecycle hygiene — are stale flags being removed on schedule?
- Policy violation trends — are teams catching bad patterns earlier in the workflow?
- Release consistency across teams — are rollout paths becoming more standardized?
These are the indicators that tell you whether release governance is scaling or just getting noisier.
Ready to see it in action?
AI made software creation faster, but it also exposed how weak most release systems still are.
Feature flags help. Pipelines help. Policy as code helps. But the real value shows up when those capabilities work together as one governed release model.
That’s what Harness FME now makes possible. Teams can standardize rollout paths, automate approvals where they belong, enforce policy without slowing delivery, and clean up flags before they become operational debt. That is what it means to release fearlessly on a platform, not just with a point tool.
Ready to see how Harness helps platform teams standardize feature releases with built-in governance? Contact Harness for a demo.
FAQ
Why do teams need both pipelines and feature flags?
Pipelines automate deployment and standardize release workflows. Feature flags decouple deployment from feature exposure, which gives teams granular control over rollout, experimentation, and rollback. Together, they create a safer and more repeatable release system.
What does Harness FME pipeline integration add?
It brings feature release actions into the same workflow that manages delivery. Teams can standardize status changes, targeting, approvals, rollout progression, and cleanup instead of handling those steps manually or in separate tools.
Why is policy as code important for feature management?
At scale, manual governance breaks down. Policy as code lets platform teams enforce standards automatically on flags, targeting rules, segments, and change requests so safety doesn’t depend on people remembering the rules.
What kinds of policies can teams enforce in Harness FME?
Teams can enforce naming conventions, ownership and tagging requirements, safer targeting defaults, environment-specific rollout rules, segment governance, and approval requirements for sensitive change requests.
How does this reduce release risk?
It reduces risk by combining progressive rollout controls with standardized workflows and automated governance. Teams can limit blast radius, catch unsafe changes earlier, and respond with the right rollback path when issues appear.
How does this support the broader Harness platform story?
It shows how Harness connects delivery automation, feature release control, and governance in one system. That reduces toolchain sprawl and turns release management into a platform capability rather than a collection of manual steps.
How do teams avoid feature flag debt?
They make cleanup part of the workflow. When the rollout is complete and the winning treatment is chosen, the pipeline should require confirmation that the flag has been removed from code and no longer needs active targeting.

Why Warehouse Native Experimentation Matters for Platform Teams
Releasing fearlessly isn't just about getting code into production safely. It's about knowing what happened after the release, trusting the answer, and acting on it without stitching together three more tools.
That is where many teams still break down.
They can deploy. They can gate features. They can even run experiments. But the moment they need trustworthy results, the workflow fragments. Event data moves into another system. Metric definitions drift from business logic. Product, engineering, and data teams start debating the numbers instead of deciding what to do next.
That's why Warehouse Native Experimentation matters.
Today, Harness is making Warehouse Native Experimentation generally available in Feature Management & Experimentation (FME). After proving the model in beta, this capability is now ready for broader production use by teams that want to run experiments directly where their data already lives.
This is an important launch on its own. It is also an important part of the broader Harness platform story.
Because “release fearlessly” is incomplete if experimentation still depends on exported datasets, shadow pipelines, and black-box analysis.
Releasing fearlessly requires more than safer deployments
The AI era changed one thing fast: the volume of change.
Teams can create, modify, and ship software faster than ever. What didn't automatically improve was the system that turns change into controlled outcomes. Release coordination, verification, experimentation, and decision-making are still too often fragmented across different tools and teams.
That's the delivery gap.
In a recent Harness webinar, Lena Sano, a Software Developer on the Harness DevRel team and I showed why this matters. Their point was straightforward: deployment alone is not enough. As I said in the webinar, feature flags are “the logical end of the pipeline process.”
That framing matters because it moves experimentation out of the “nice to have later” category and into the release system itself.
When teams deploy code with Harness Continuous Delivery, expose functionality with Harness FME, and now analyze experiment outcomes with trusted warehouse data, the release moment becomes a closed loop. You don't just ship. You learn.
Warehouse Native Experimentation is now generally available
Warehouse Native Experimentation extends Harness FME with a model that keeps experiment analysis inside the data warehouse instead of forcing teams to export data into a separate analytics stack.
That matters for three reasons.
First, it keeps teams closer to the source of truth the business already trusts.
Second, it reduces operational drag. Teams do not need to build and maintain unnecessary movement of assignment and event data just to answer basic product questions.
Third, it makes experimentation more credible across functions. Product teams, engineers, and data stakeholders can work from the same governed data foundation instead of arguing over two competing systems.
General availability makes this model ready to support production experimentation programs that need more than speed. They need trust, repeatability, and platform-level consistency.
Why the old experimentation model breaks at AI speed
Traditional experimentation workflows assume that analysis can happen somewhere downstream from release. That assumption does not hold up well anymore.
When development velocity rises, so does the volume of features to evaluate. Teams need faster feedback loops, but they also need stronger confidence in the data behind the decision. If every experiment requires moving data into another system, recreating business metrics, and validating opaque calculations, the bottleneck just shifts from deployment to analysis.
That's the wrong pattern for platform teams.
Platform teams are being asked to support higher release frequency without increasing risk. They need standardized workflows, strong governance, and fewer manual handoffs. They do not need another disconnected toolchain where experimentation introduces more uncertainty than it removes.
Warehouse Native Experimentation addresses that by bringing experimentation closer to the release process and closer to trusted business data at the same time.
What Warehouse Native Experimentation does differently
This launch matters because it changes how experimentation fits into the software delivery model.
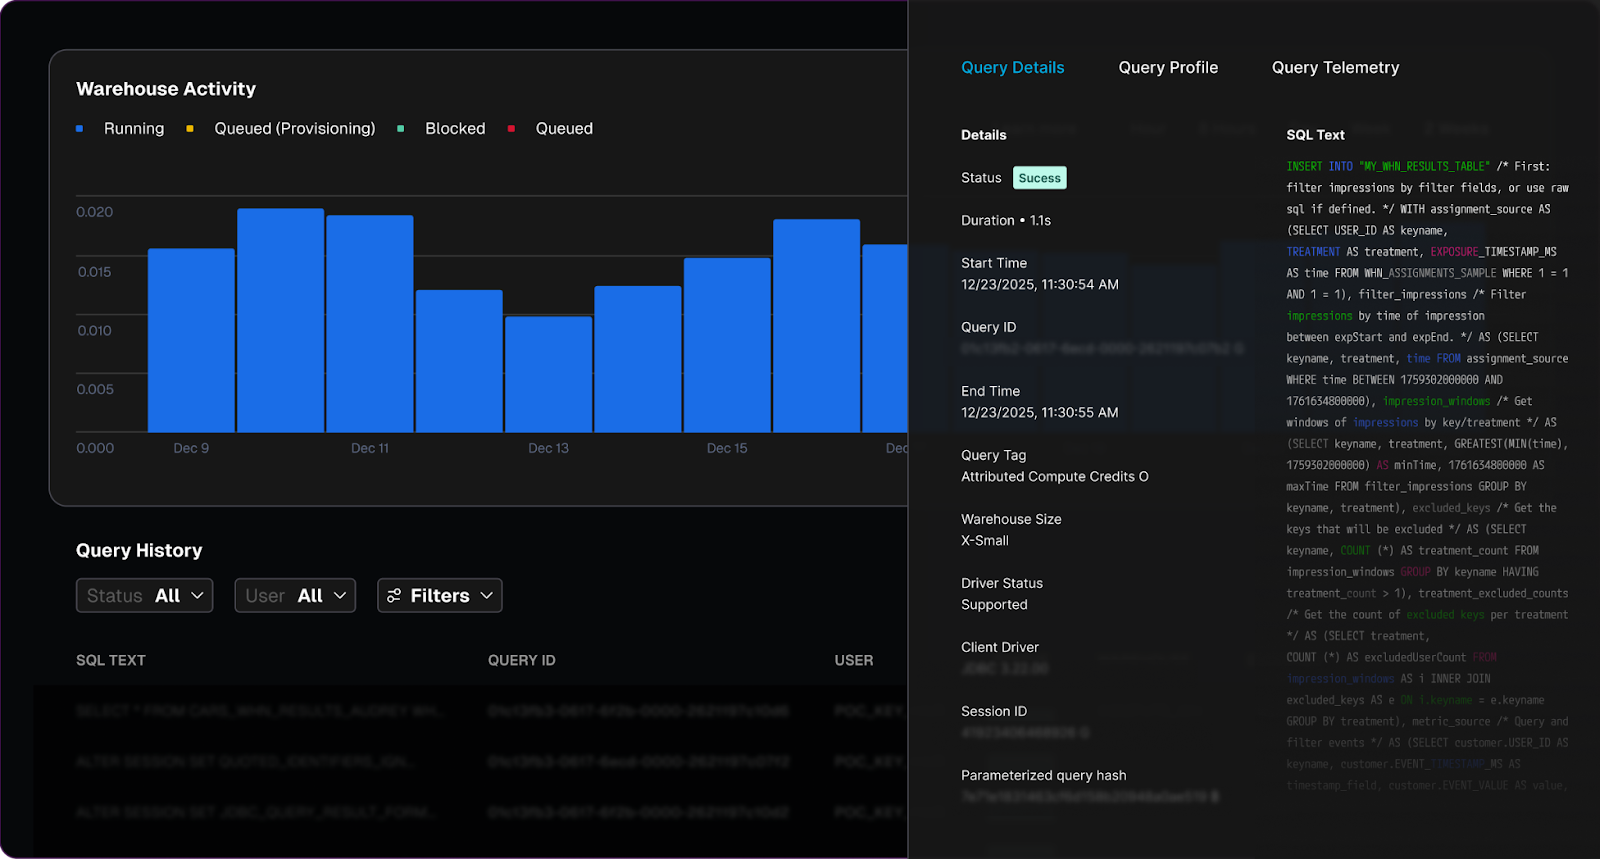

Experiment where your data lives
Warehouse Native Experimentation lets teams run analyses directly in supported data warehouses rather than exporting experiment data into an external system first.
That is a meaningful shift.
It means your experiment logic can operate where your product events, business events, and governed data models already exist. Instead of copying data out and hoping definitions stay aligned, teams can work from the warehouse as the source of truth.
For organizations already invested in platforms like Snowflake or Amazon Redshift, this reduces friction and increases confidence. It also helps avoid the shadow-data problem that shows up when experimentation becomes one more separate analytics island.
Create metrics that reflect the business
Good experimentation depends on metric quality.
Warehouse Native Experimentation lets teams define metrics from the warehouse tables they already trust. That includes product success metrics as well as guardrail metrics that help teams catch regressions before they become larger incidents.
This is a bigger capability than it may appear.
Many experimentation programs fail not because teams lack ideas, but because they cannot agree on what success actually means. When conversion, latency, revenue, or engagement are defined differently across tools, the experiment result becomes negotiable.
Harness moves that discussion in the right direction. The metric should reflect the business reality, not the reporting limitations of a separate experimentation engine.
Understand impact with transparent results
Speed matters. Trust matters more.
Warehouse Native Experimentation helps teams understand impact with results that are transparent and inspectable. That gives engineering, product, and data teams a better basis for action.
The practical benefit is simple: when a result looks surprising, teams can validate the logic instead of debating whether the tool is doing something hidden behind the scenes.
That transparency is a major part of the launch story. Release fear decreases when teams trust both the rollout controls and the data used to judge success.
Why this is a platform story, not a point feature
Warehouse Native Experimentation is valuable on its own. But its full value shows up when you look at how it fits into the Harness platform.
Pipelines standardize the release moment
In the webinar, Lena demonstrated a workflow where a pipeline controlled flag status, targeting, approvals, rollout progression, and even cleanup. I emphasized that “95% of it was run by a single pipeline.”
That is not just a demo detail. It is the operating model platform teams want.
Pipelines make releases consistent. They reduce team-to-team variation. They create auditability. They turn release behavior into a reusable system instead of a series of manual decisions.
FME controls exposure and learning
Harness FME gives teams the ability to decouple deployment from release, expose features gradually, target specific cohorts, and run experiments as part of a safer delivery motion.
That is already powerful.
It lets teams avoid full application rollback when one feature underperforms. It lets them isolate problems faster. It gives product teams a structured way to learn from real usage without treating every feature launch like an all-or-nothing event.
Warehouse-native analysis closes the loop with trusted data
Warehouse Native Experimentation completes that model.
Now the experiment does not end at exposure control. It continues into governed analysis using the data infrastructure the business already depends on. The result is a tighter loop from release to measurement to decision.
That is why this is a platform launch.
Harness is not asking teams to choose between delivery tooling and experimentation tooling and warehouse trust. The platform brings those motions together:
- Deploy the change safely with pipelines.
- Release it progressively with feature management.
- Measure it with experiments tied to trusted warehouse data.
- Standardize the workflow so teams can repeat it at scale.
That is what “release fearlessly” looks like when it extends beyond deployment.
The operating model: release, verify, learn, standardize
Engineering leaders should think about this launch as a better operating model for software change.
Release with control. Use pipelines and feature flags to separate deployment from feature exposure.
Verify with the right signals. Use guardrail metrics and rollout logic to contain risk before it spreads.
Learn from trusted data. Run experiments against the warehouse instead of recreating the truth somewhere else.
Standardize the process. Make approvals, measurement, and cleanup part of the same repeatable workflow.
This is especially important for platform teams trying to keep pace with AI-assisted development. More code generation only helps the business if the release system can safely absorb more change and turn it into measurable outcomes.
Warehouse Native Experimentation helps make that possible.
Who should care now
This feature will be especially relevant for teams that:
- already store product and business event data in a warehouse
- want to reduce the overhead of separate experimentation infrastructure
- need stronger trust and governance around experiment analysis
- are standardizing progressive delivery practices across multiple teams
- want experimentation to support release operations instead of sitting outside them
Want to see it in action?
As software teams push more change through the system, trusted experimentation can no longer sit off to the side. It has to be part of the release model itself.
Harness now gives teams a stronger path to do exactly that: deploy safely, release progressively, and measure impact where trusted data already lives. That is not just better experimentation. It is a better software delivery system.
Ready to see how Harness helps teams release fearlessly with trusted, warehouse-native experimentation? Contact Harness for a demo.
FAQ
What is Warehouse Native Experimentation?
Warehouse Native Experimentation is a capability in Harness FME that lets teams analyze experiment outcomes directly in their data warehouse. That keeps experimentation closer to governed business data and reduces the need to export data into separate analysis systems.
Why does general availability matter?
GA signals that the capability is ready for broader production adoption. For platform and product teams, that means Warehouse Native Experimentation can become part of a standardized release and experimentation workflow rather than a limited beta program.
How is warehouse-native experimentation different from traditional experimentation tools?
Traditional approaches often require moving event data into a separate system for analysis. Warehouse-native experimentation keeps analysis where the data already lives, which improves trust, reduces operational overhead, and helps align experiment metrics with business definitions.
How does this support the “release fearlessly” story?
Safer releases are not only about deployment controls. They also require trusted feedback after release. Warehouse Native Experimentation helps teams learn from production changes using governed warehouse data, making release decisions more confident and more repeatable.
How does this fit with Harness pipelines and feature flags?
Harness pipelines help standardize the release workflow, while Harness FME controls rollout and experimentation. Warehouse Native Experimentation adds trusted measurement to that same motion, closing the loop from deployment to exposure to decision.
Who benefits most from this capability?
Organizations with mature data warehouses, strong governance requirements, and a need to scale experimentation across teams will benefit most. It is especially relevant for platform teams that want experimentation to be part of a consistent software delivery model.

Harness Ships Five Capabilities to Power Confident Releases at AI Speed
Engineering teams are generating more shippable code than ever before — and today, Harness is shipping five new capabilities designed to help teams release confidently. AI coding assistants lowered the barrier to writing software, and the volume of changes moving through delivery pipelines has grown accordingly. But the release process itself hasn't kept pace.
The evidence shows up in the data. In our 2026 State of DevOps Modernization Report, we surveyed 700 engineering teams about what AI-assisted development is actually doing to their delivery. The finding stands out: while 35% of the most active AI coding users are already releasing daily or more, those same teams have the highest rate of deployments needing remediation (22%) and the longest MTTR at 7.6 hours.
This is the velocity paradox: the faster teams can write code, the more pressure accumulates at the release, where the process hasn't changed nearly as much as the tooling that feeds it.
The AI Delivery Gap
What changed is well understood. For years, the bottleneck in software delivery was writing code. Developers couldn't produce changes fast enough to stress the release process. AI coding assistants changed that. Teams are now generating more change across more services, more frequently than before — but the tools for releasing that change are largely the same.
In the past, DevSecOps vendors built entire separate products to coordinate multi-team, multi-service releases. That made sense when CD pipelines were simpler. It doesn't make sense now. At AI speed, a separate tool means another context switch, another approval flow, and another human-in-the-loop at exactly the moment you need the system to move on its own.
The tools that help developers write code faster have created a delivery gap that only widens as adoption grows.
What Harness Is Shipping
Today Harness is releasing five capabilities, all natively integrated into Continuous Delivery. Together, they cover the full arc of a modern release: coordinating changes across teams and services, verifying health in real time, managing schema changes alongside code, and progressively controlling feature exposure.
Coordinate multi-team releases without the war room
Release Orchestration replaces Slack threads, spreadsheets, and war-room calls that still coordinate most multi-team releases. Services and the teams supporting them move through shared orchestration logic with the same controls, gates, and sequence, so a release behaves like a system rather than a series of handoffs. And everything is seamlessly integrated with Harness Continuous Delivery, rather than in a separate tool.
Know when to stop — automatically
AI-Powered Verification and Rollback connects to your existing observability stack, automatically identifies which signals matter for each release, and determines in real time whether a rollout should proceed, pause, or roll back. Most teams have rollback capability in theory. In practice it's an emergency procedure, not a routine one. Ancestry.com made it routine and saw a 50% reduction in overall production outages, with deployment-related incidents dropping significantly.
Ship code and schema changes together
Database DevOps, now with Snowflake support, brings schema changes into the same pipeline as application code, so the two move together through the same controls with the same auditability. If a rollback is needed, the application and database schema can rollback together seamlessly. This matters especially for teams building AI applications on warehouse data, where schema changes are increasingly frequent and consequential.
Roll out features gradually, measure what actually happens
Improved pipeline and policy support for feature flags and experimentation enables teams to deploy safely, and release progressively to the right users even though the number of releases is increasing due to AI-generated code. They can quickly measure impact on technical and business metrics, and stop or roll back when results are off track. All of this within a familiar Harness user interface they are already using for CI/CD.
Warehouse-Native Feature Management and Experimentation lets teams test features and measure business impact directly with data warehouses like Snowflake and Redshift, without ETL pipelines or shadow infrastructure. This way they can keep PII and behavioral data inside governed environments for compliance and security.
These aren't five separate features. They're one answer to one question: can we safely keep going at AI speed?
From Deployment to Verified Outcome
Traditional CD pipelines treat deployment as the finish line. The model Harness is building around treats it as one step in a longer sequence: application and database changes move through orchestrated pipelines together, verification checks real-time signals before a rollout continues, features are exposed progressively, and experiments measure actual business outcomes against governed data.
A release isn't complete when the pipeline finishes. It's complete when the system has confirmed the change is healthy, the exposure is intentional, and the outcome is understood.
That shift from deployment to verified outcome is what Harness customers say they need most. "AI has made it much easier to generate change, but that doesn't mean organizations are automatically better at releasing it," said Marc Pearce, Head of DevOps at Intelliflo. "Capabilities like these are exactly what teams need right now. The more you can standardize and automate that release motion, the more confidently you can scale."
Release Becomes a System, Not a Scramble
The real shift here is operational. The work of coordinating a release today depends heavily on human judgment, informal communication, and organizational heroics. That worked when the volume of change was lower. As AI development accelerates, it's becoming the bottleneck.
The release process needs to become more standardized, more repeatable, and less dependent on any individual's ability to hold it together at the moment of deployment. Automation doesn't just make releases faster. It makes them more consistent, and consistency is what makes scaling safe.
For Ancestry.com, implementing Harness helped them achieve 99.9% uptime by cutting outages in half while accelerating deployment velocity threefold.
At Speedway Motors, progressive delivery and 20-second rollbacks enabled a move from biweekly releases to multiple deployments per day, with enough confidence to run five to 10 feature experiments per sprint.
AI made writing code cheap. Releasing that code safely, at scale, is still the hard part.
Harness Release Orchestration, AI-Powered Verification and Rollback, Database DevOps, Warehouse-Native Feature Management and Experimentation, and Improve Pipeline and Policy support for FME are available now. Learn more and book a demo.
When Faster Code Starts to Break the Delivery System
Over the last few years, something fundamental has changed in software development.
If the early 2020s were about adopting AI coding assistants, the next phase is about what happens after those tools accelerate development. Teams are producing code faster than ever. But what I’m hearing from engineering leaders is a different question:
What’s going to break next?
That question is exactly what led us to commission our latest research, State of DevOps Modernization 2026. The results reveal a pattern that many practitioners already sense intuitively: faster code generation is exposing weaknesses across the rest of the software delivery lifecycle.
In other words, AI is multiplying development velocity, but it’s also revealing the limits of the systems we built to ship that code safely.
The Emerging “Velocity Paradox”
One of the most striking findings in the research is something we’ve started calling the AI Velocity Paradox - a term we coined in our 2025 State of Software Engineering Report.
Teams using AI coding tools most heavily are shipping code significantly faster. In fact, 45% of developers who use AI coding tools multiple times per day deploy to production daily or faster, compared to 32% of daily users and just 15% of weekly users.
At first glance, that sounds like a huge success story. Faster iteration cycles are exactly what modern software teams want.
But the data tells a more complicated story.
Among those same heavy AI users:
- 69% report frequent deployment problems when AI-generated code is involved
- Incident recovery times average 7.6 hours, longer than for teams using AI less frequently
- 47% say manual downstream work, QA, validation, remediation has become more problematic
What this tells me is simple: AI is speeding up the front of the delivery pipeline, but the rest of the system isn’t scaling with it. It’s like we are running trains faster than the tracks they are built for. Friction builds, the ride is bumpy, and it seems we could be on the edge of disaster.
The result is friction downstream, more incidents, more manual work, and more operational stress on engineering teams.
Why the Delivery System Is Straining
To understand why this is happening, you have to step back and look at how most DevOps systems actually evolved.
Over the past 15 years, delivery pipelines have grown incrementally. Teams added tools to solve specific problems: CI servers, artifact repositories, security scanners, deployment automation, and feature management. Each step made sense at the time.
But the overall system was rarely designed as a coherent whole.
In many organizations today, quality gates, verification steps, and incident recovery still rely heavily on human coordination and manual work. In fact, 77% say teams often have to wait on other teams for routine delivery tasks.
That model worked when release cycles were slower.
It doesn’t work as well when AI dramatically increases the number of code changes moving through the system.
Think of it this way: If AI doubles the number of changes engineers can produce, your pipelines must either:
- cut the risk of each change in half, or
- detect and resolve failures much faster.
Otherwise, the system begins to crack under pressure. The burden often falls directly on developers to help deploy services safely, certify compliance checks, and keep rollouts continuously progressing. When failures happen, they have to jump in and remediate at whatever hour.
These manual tasks, naturally, inhibit innovation and cause developer burnout. That’s exactly what the research shows.
Across respondents, developers report spending roughly 36% of their time on repetitive manual tasks like chasing approvals, rerunning failed jobs, or copy-pasting configuration.
As delivery speed increases, the operational load increases. That burden often falls directly on developers.
What Organizations Should Do Next
The good news is that this problem isn’t mysterious. It’s a systems problem. And systems problems can be solved.
From our experience working with engineering organizations, we've identified a few principles that consistently help teams scale AI-driven development safely.
1. Standardize delivery foundations
When every team builds pipelines differently, scaling delivery becomes difficult.
Standardized templates (or “golden paths”) make it easier to deploy services safely and consistently. They also dramatically reduce the cognitive load for developers.
2. Automate quality and security checks earlier
Speed only works when feedback is fast.
Automating security, compliance, and quality checks earlier in the lifecycle ensures problems are caught before they reach production. That keeps pipelines moving without sacrificing safety.
3. Build guardrails into the release process
Feature flags, automated rollbacks, and progressive rollouts allow teams to decouple deployment from release. That flexibility reduces the blast radius of new changes and makes experimentation safer.
It also allows teams to move faster without increasing production risk.
4. Remember measurement, not just automation
Automation alone doesn’t solve the problem. What matters is creating a feedback loop: deploy → observe → measure → iterate.
When teams can measure the real-world impact of changes, they can learn faster and improve continuously.
The Next Phase of AI in Software Delivery
AI is already changing how software gets written. The next challenge is changing how software gets delivered.
Coding assistants have increased development teams' capacity to innovate. But to capture the full benefit, the delivery systems behind them must evolve as well.
The organizations that succeed in this new environment will be the ones that treat software delivery as a coherent system, not just a collection of tools.
Because the real goal isn’t just writing code faster. It’s learning faster, delivering safer, and turning engineering velocity into better outcomes for the business.
And that requires modernizing the entire pipeline, not just the part where code is written.
Simplify Feature Flag Management with Harness FME and OpenFeature
Feature flags are table stakes for modern software development. They allow teams to ship features safely, test new functionality, and iterate quickly, all without re-deploying their applications. As teams grow and ship across multiple services, environments, and languages, consistently managing feature flags becomes a significant challenge.
Harness Feature Management & Experimentation (FME) continues its investment in OpenFeature, building on our early support and adoption of the CNCF standard for feature flagging since 2022. OpenFeature provides a single, vendor-agnostic API that allows developers to interact with multiple feature management providers while maintaining consistent flag behavior.
With OpenFeature, you can standardize flag behavior across services and applications, and integrate feature flags across multiple languages and SDKs, including Node.js, Python, Java, .NET, Android, iOS, Angular, React, and Web.
Why OpenFeature matters today
Feature flagging may appear simple on the surface; you check a boolean, push up a branch, and move on. But as Pete Hodgson describes in his blog post about OpenFeature:
When I talk to people about adopting feature flags, I often describe feature flag management as a bit of an iceberg. On the surface, feature flagging seems really simple… However, once you get into it, there’s a fair bit of complexity lurking under the surface.
At scale, feature management is more than toggling booleans; it's about auditing configurations, controlling incremental rollouts, ensuring governance and operational best practices, tracking events, and integrating with analytics systems. OpenFeature provides a standard interface for consistent execution across SDKs and providers. Once teams hit those hidden layers of complexity, a standardized approach is no longer optional.
This need for standardization isn’t new. In fact, Harness FME (previously known as Split.io) was an early supporter of OpenFeature because teams were already running into the limits of proprietary, SDK-specific flag implementations. From a blog post about OpenFeature published in 2022:
While feature flags alone are very powerful, organizations that use flagging at scale quickly learn that additional functionality is needed for a proper, long-term feature management approach.
This post highlights challenges that are now commonplace in most organizations: maintaining several SDKs across services, inconsistent flag definitions between teams, and friction in integrating feature flags with analytics, monitoring, and CI/CD systems.
What’s changed since then isn’t the problem; it’s the urgency. Teams are now shipping faster, across more languages and environments, with higher expectations around governance, experimentation, and observability. OpenFeature is a solution that enables teams to meet those expectations without increasing complexity.
Integrate OpenFeature with Harness FME
Feature flagging with OpenFeature provides your team with a consistent API to evaluate flags across environments and SDKs. With Harness FME, you can plug OpenFeature directly into your applications to standardize flag evaluations, simplify rollouts, and track feature impact, all from your existing workflow.
The Harness FME OpenFeature Provider wraps the Harness FME SDK, bridging the OpenFeature SDK with the Harness FME service. The provider maps OpenFeature's interface to the FME SDK, which handles communication with Harness services to evaluate feature flags and retrieve configuration updates.
In the following example, we’ll use the Harness FME Node.js OpenFeature Provider to evaluate and track feature flags in a sample application.
Prerequisites
Before you begin, ensure you have the following requirements:
- A valid Harness FME SDK key for your project
- Node.js 14.x+
- Access to npm or yarn to install dependencies
Setup
- Install the Node.js OpenFeature provider and dependencies.
- Initialize and register the provider with OpenFeature using your Harness FME SDK key.
- Evaluate feature flags with context. Target specific users, accounts, or segments by passing an evaluation context.
- If you reuse the same targeting key frequently, set the context once at the client or API level:
- Optionally, track user events like user actions or conversion events to measure flag impact. Event tracking links user behavior directly to your feature flags, helping you understand the real-world impact of each rollout.
With the provider registered and your evaluation context configured, your Node.js service can now evaluate flags, track events, and access flag metadata through OpenFeature without needing custom clients or SDK rewrites. From here, you can add additional flags, expand your targeting attributes, configure rollout rules in Harness FME, and feed event data directly into your experimentation workflows.
Start using Harness FME OpenFeature providers today
Feature management at scale is a common operational challenge. Much like the feature flagging iceberg where the simple on/off switch is just the visible tip, most of the real work happens underneath the surface: consistent evaluation logic, targeting, auditing, event tracking, and rollout safety. Harness FME and OpenFeature help teams manage these hidden operational complexities in a unified, predictable way.
Looking ahead, we’re extending support to additional server-side providers such as Go and Ruby, continuing to broaden OpenFeature’s reach across your entire stack.
To learn more about supported providers and how teams use OpenFeature with Harness FME in practice, see the Harness FME OpenFeature documentation. If you’re brand new to Harness FME, sign up for a free trial today.
Get a demo switch to Harness FME

Make Data-Driven Decisions with Warehouse Native Experimentation
Product and experimentation teams need confidence in their data when making high-impact product decisions. Today, experiment results often require copying behavioral data into external systems, which creates delays, security risks, and black-box calculations that are difficult to trust or validate.
Warehouse Native Experimentation keeps experiment data directly in your data warehouse, enabling you to analyze results with full transparency and governance control.
With Warehouse Native Experimentation, you can:
- Run experiments without exporting data
- Use transparent SQL logic that you control
- Maintain alignment with internal data models
- Accelerate experimentation without depending on streaming data pipelines
Why Warehouse Native Experimentation matters today
Product velocity has become a competitive differentiator, but experimentation often lags behind. AI-accelerated development means teams are shipping code faster than ever, while maintaining confidence in data-driven decisions is becoming increasingly challenging.
Modern teams face increasing pressure to move faster while reducing operational costs, reducing risk when launching high-impact features, maintaining strict data compliance and governance, and aligning product decisions with reliable, shared business metrics.
Executives are recognizing that sustainable velocity requires trustworthy insights. According to the 2025 State of AI in Software Engineering report, 81% of engineering leaders surveyed agreed that:
“Purpose-built platforms that automate the end-to-end SDLC will be far more valuable than solutions that target just one specific task in the future.”
At the same time, investments in data warehouses such as Snowflake and Amazon Redshift have increased. These platforms have become the trusted source of truth for customer behavior, financial reporting, and operational metrics.
This shift creates a new expectation where experiments must run where data already lives, results must be fully transparent to data stakeholders, and insights must be trustworthy from the get-go.
Warehouse Native Experimentation enables teams to scale experimentation without relying on streaming data pipelines, vendor lock-in, or black-box calculations, as trust and speed are now critical to business success.
Experiment where your data lives
Warehouse Native Experimentation integrates with Snowflake and Amazon Redshift, allowing you to analyze assignments and events within your data warehouse.
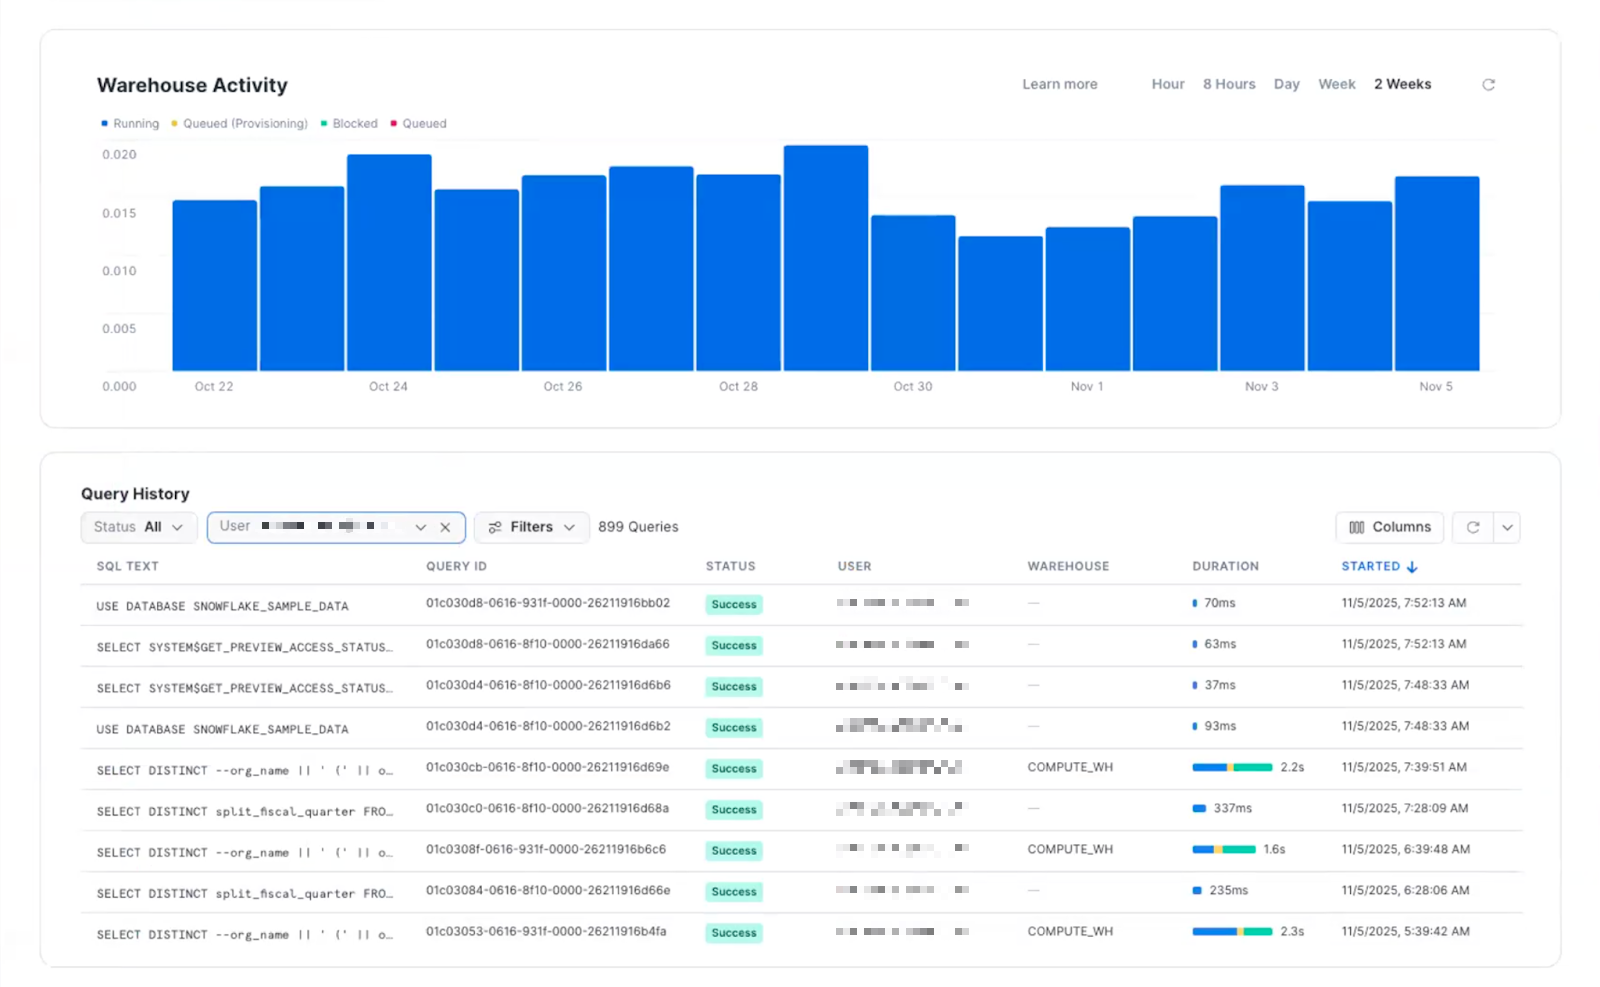
Because all queries run inside your warehouse, you benefit from full visibility into data schemas and transformation logic, higher trust in experiment outcomes, and the ability to validate, troubleshoot, and customize queries.

When Warehouse Native experiment results are generated from the same source of truth for your organization, decision-making becomes faster and more confident.
Create metrics that reflect your business
Metrics define success, and Warehouse Native Experimentation enables teams to define them using data that already adheres to internal governance rules. You can build metrics using existing warehouse tables, reuse them across multiple experiments, and include guardrail metrics (such as latency, revenue, or stability) to ensure consistency and accuracy. As experimentation needs evolve, metrics evolve with them, without duplicate data definitions.

Experiments generate value when success metrics represent business reality. By codifying business logic into metrics, you can monitor the performance of what matters to your business, such as checkout conversion based on purchase events, average page load time as a performance guardrail, and revenue per user associated with e-commerce goals.
Understand experiment impact with transparent results
Once you've defined your metrics, Warehouse Native Experimentation automatically computes results on a daily recalculation or manual refresh and provides clear statistical significance indicators.
Because every result is generated with SQL that you can view in your data warehouse, teams can validate transformations, debug anomalies, and collaborate with data stakeholders. When everyone, from product to data science, can inspect the results, everyone trusts the decision.
Set up Warehouse Native Experimentation
Warehouse Native Experimentation requires connecting your data warehouse and ensuring your experiment and event data are ready for analysis. Warehouse Native Experimentation does not require streaming or ingestion; Harness FME reads directly from assignment and metric source tables.
To get started:
- Connect your data warehouse to Harness FME. Warehouse Native Experimentation requires the ability to read behavioral event and assignment tables, write results into a dedicated Harness schema, and run scheduled query jobs.
- Prepare your data model. In your data warehouse, assignment source tables track who was exposed to which variant, ensuring that users are correctly mapped to treatments and environments. Metric source tables, on the other hand, contain event-level data used in metric definitions, ensuring that analyses are grounded in a consistent, verifiable reality.
- Configure sources in Harness FME. Assignment sources define the exposure table structure and mappings, while metric sources define the event structure and metadata context. This ensures experiment analysis aligns with your warehouse schemas.
- Define metrics and create experiments. Once your data warehouse is connected, you can add key metrics and guardrail metrics, run experiments, and view the latest results in Harness FME.
From setting up Warehouse Native Experimentation to accessing your first Warehouse Native experiment result, organizations can efficiently move from raw data to validated insights, without building data pipelines.
Start running Warehouse Native experiments today
Warehouse Native Experimentation is ideal for organizations that already capture behavioral data in their warehouse, want experimentation without data exporting, and value transparency, governance, and flexibility in metrics.
Whether you're optimizing checkout or testing a new onboarding experience, Warehouse Native Experimentation enables you to make informed decisions, powered by the data sources your business already trusts.
Looking ahead, Harness FME will extend these workflows toward a shift-left approach, bringing experimentation closer to the release process with data checks in CI/CD pipelines, Harness RBAC permissioning, and policy-as-code governance. This alignment ensures product, experimentation, and engineering teams can release faster while maintaining confidence and compliance in every change.
To start running experiments in a supported data warehouse, see the Warehouse Native Experimentation documentation. If you're brand new to Harness FME, sign up for a free trial today.
.png)
Harness FME Fast and Furious
Over the past six months, we have been hard at work building an integrated experience to take full advantage of the new platform made available after the Split.io merger with Harness. We have shipped a unified Harness UI for migrated Split customers, added enterprise-grade controls for experiments and rollouts, and doubled down on AI to help teams see impact faster and act with confidence. Highlights include OpenFeature providers, Warehouse Native Experimentation (beta), AI Experiment Summaries, rule-based segments, SDK fallback treatments, dimensional analysis support, and new FME MCP tools that connect your flags to AI-assisted IDEs.
And our efforts are being noticed. Just last month, Forrester released the 2025 Forrester Wave™ for Continuous Delivery & Release Automation where Harness was ranked as a leader in part due to our platform approach including CI/CD and FME. This helps us uniquely solve some of the most challenging problems facing DevOps teams today.
A more integrated experience: from Split UI to Harness UI
This year we completed the front-end migration path that moves customers from app.split.io to app.harness.io, giving teams a consistent, modern experience across the Harness platform with no developer code changes required. Day-to-day user flows remain familiar, while admins gain Harness-native RBAC, SSO, and API management with personal access token and service account token support.
What this means for you:
- No more switching UIs for customers who use FME and other Harness products
- No SDK or proxy changes required for production apps. Your flag evaluations continue as before.
- Harness RBAC and SSO now govern FME access. Migrations include clear before and after guides for roles, groups, and SCIM.
- Admin API parity with a documented before and after map and examples for the few endpoints that moved.
For admins, the quick confidence checklist, logging steps, and side-by-side screens make the switch straightforward. FME Settings routes you into the standard Harness RBAC screens for long-term consistency where appropriate.
Built for AI-driven workloads
Two themes shaped our AI investments: explainability and in-flow assist.
- Explainable measurement: AI Summaries help teams move faster from what happened to what should we do, without forcing deep dives into raw statistics.
- AI in the developer loop: FME MCP tools help developers inspect, compare, and adjust flag states without context switching. This shortens the loop between finding an issue and safely changing a treatment.
- Data where you need it: Warehouse Native Experimentation runs analyses where your data already lives, improving transparency and aligning with the way modern AI and analytics teams operate.
To learn more, watch this video!

Warehouse Native Experimentation (beta)
Warehouse Native Experimentation lets you run analyses directly in your own data warehouse using your assignment and event data for more transparent, flexible measurement. We are pleased to announce that this feature is now available in beta. Customers can request access through their account team and read more about it in our docs.
What else is new in Harness FME
As you can see from all the new features below, we have been running hard and we are accelerating into the turn as we head toward the end of the year. We take pride in the partnerships we have with our customers. As we listen to your concerns, our engineering teams are working hard to implement the features you need to be successful.
October 2025
- FME MCP tools connect feature flags and experiments to AI-assisted IDEs such as Claude Code, Windsurf, Cursor, and VS Code. Explore flags, compare flag definitions, and audit rules conversationally to speed up release workflows.
- OpenFeature providers for Android, iOS, Web, Java, Python, .NET, Node.js, React, and Angular help standardize evaluations and reduce lock-in across services and teams.
- Harness Proxy centralizes and secures outgoing SDK traffic with support for OAuth and mTLS, easing egress-control needs at scale. It also works with other Harness products like Database DevOps.
- Owners as metadata clarifies accountability while edit privileges remain governed by RBAC.
September 2025
- SDK Fallback treatments allow you to avoid unexpected control treatments by offering a centralized, simple and scalable way to set these across your SDKs and applications.
- Experiment entry event filter keeps analysis clean by including only users who actually hit the experiment entry point.
July 2025
- Dimensional analysis on experiments reveals effects by browser, device, region, and more so you can catch segment-level regressions early.
- AI Summarize on experiments and metrics gives fast, accurate summaries for non-technical stakeholders and busy teams.
June 2025
- Rule-based segments target users dynamically using attribute conditions, reducing static list maintenance and simplifying targeting rules reusability.
- Experiment tags improve searchability and at-scale organization.
- Client-side cache controls for Browser, iOS, and Android SDKs let you tune rollout cache expiration and initialization behavior.
Foundation laid earlier in 2025
- Experiments Dashboard for easier setup and multi-treatment analysis.
- Release Agent, rebranded from Switch, adds follow-up Q and A on metric summaries with admin-controlled AI settings.
As always, you can find details on all our new features by reading our release notes.
What customers can expect next
We are excited to add more value for our customers by continuing to integrate Split with Harness to achieve the best of both worlds. Harness CI/CD customers can expect familiar and proven methodologies to show up in FME like pipelines, RBAC, SSO support and more. To see the full roadmap and get a sneak peak at what is coming, reach out to us to schedule a call with your account representative.
Get started
- Attending AWS ReInvent? Come see us at booth #731 and get a live demo.
- Already migrated from Split? Sign in at app.harness.io. If you are an admin, review the RBAC and SSO guides to validate group mappings and SCIM.
- New to Harness FME? Explore the product page and datasheet, then try FME in your environment.
Want the full details? Read the latest FME release notes for all features, dates, and docs.
Checkout The Feature Management & Experimentation Summit
Read comparison of Harness FME with Unleash

When Cloud Providers Have an Outage, Your Feature Flags Shouldn’t
Over the past few weeks, the software industry has experienced multiple cloud outages that have caused widespread disruptions across hundreds of applications and services. When systems went down, the difference between chaos and continuity came down to architecture. In feature management, reliability is not a nice-to-have; it is designed in. When an outage occurs, it’s often not the failure itself that defines the customer experience, but how the system is designed to respond.
During the event, Harness Feature Management & Experimentation (FME) maintained 100% flag-delivery uptime across all regions—no redeploys, no configuration changes, no missed evaluations. This wasn’t luck. It’s the result of an architecture built from day one for failure resilience. FME was built from the ground up with fault tolerance and continuity in mind. From automatic fallback mechanisms to distributed decision engines and managed streaming infrastructure, every layer of our architecture is designed to ensure feature flag delivery remains resilient, even in the face of unexpected events.
Automatic Fallback: Zero-Touch Continuity
One of the most important architectural principles in FME is graceful degradation, ensuring that even when one service experiences disruption, the system continues to function seamlessly. Our SDKs are designed to automatically fall back to polling if there is any issue connecting to the streaming service. This means developers and operators never have to manually intervene or redeploy code during an outage. The fallback happens instantly and intelligently, preserving continuity and minimizing operational burden. In contrast, many legacy systems in the market rely on manual configuration changes to fallback to polling and restore flag delivery, an approach that adds risk and friction exactly when teams can least afford it.
Resilient Client-Side Decisioning: Real Evaluations, Not Stale Caches
Client-side SDKs are often the first point of impact during a network disruption. In many architectures, these SDKs can serve only cached flag values when connectivity issues arise, leaving new users or sessions without the ability to evaluate flags. Harness FME takes a different approach. Each client SDK functions as a self-contained decision engine, capable of evaluating flag rules locally and automatically switching to polling when needed. Combined with local caching and retrieval from CDN edge locations, this design ensures that even during service interruptions, both existing and new users continue to receive flag evaluations without delay or degradation.
Distributed Streaming Architecture: Built for Continuous Availability
Harness FME’s distributed streaming architecture is engineered for global reach and high availability. If a region or node experiences issues, traffic automatically reroutes to healthy endpoints. Combined with instant SDK fallback to polling, this ensures uninterrupted flag delivery and real-time responsiveness, regardless of the scale of disruption. During the recent outages, as users of our own feature flags, we served each customer their targeted experience with no disruptions.
Separation of control-plane and delivery-plane: Reliability at the Core
Even with strong backend continuity, user experience matters. Both the web console and APIs are engineered for graceful degradation. During transient internet instability, a subset of users may experience slowdowns, challenges accessing the web console, or issues posting back flag evaluation records; however, feature flag delivery and evaluation remain unaffected. This separation of control plane and delivery plane ensures that UI performance issues never impact your SDK evaluations and customer traffic. It is a key architectural decision that protects live customer experiences even in volatile network conditions.
The Outcome: Reliability as a Competitive Advantage
Reliability isn’t just about surviving outages - it’s about designing for them. Building for resilience requires intentional architectural choices such as automatic fallback mechanisms, self-sufficient SDKs, and isolation between control and delivery planes. That’s why, at Harness, we are using these opportunities to learn while following best practices to continuously improve our products, minimize the impact of outages on our customers, and deliver uninterrupted feature management at a global scale. It’s not about avoiding every failure; that’s virtually impossible. However, it's essential to ensure that when failure does happen, your product continues to work for your customers.
If you’re brand new to Harness FME, get a demo here or sign up for a free trial today.

DB Performance Testing with Harness FME
DB Performance Testing with Harness FME

Databases have been crucial to web applications since their beginning, serving as the core storage for all functional aspects. They manage user identities, profiles, activities, and application-specific data, acting as the authoritative source of truth. Without databases, the interconnected information driving functionality and personalized experiences would not exist. Their integrity, performance, and scalability are vital for application success, and their strategic importance grows with increasing data complexity. In this article we are going to show you how you can leverage feature flags to compare different databases.
Let’s say you want to test and compare two different databases against one another. A common use case could be to compare the performance of two of the most popular open source databases. MariaDB and PostgreSQL.

MariaDB and PostgreSQL logos
Let’s think about how we want to do this. We want to compare the experience of our users with these different database. In this example we will be doing a 50/50 experiment. In a production environment doing real testing in all likelihood you already use one database and would use a very small percentage based rollout to the other one, such as a 90/10 (or even 95/5) to reduce the blast radius of potential issues.
To do this experiment, first, let’s make a Harness FME feature flag that distributes users 50/50 between MariaDB and PostgreSQL
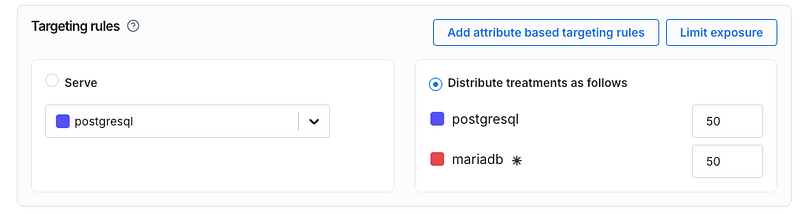
Now for this experiment we need to have a reasonable amount of sample data in the db. In this sample experiment we will actually just load the same data into both databases. In production you’d want to build something like a read replica using a CDC (change data capture) tool so that your experimental database matches with your production data
Our code will generate 100,000 rows of this data table and load it into both before the experiment. This is not too big to cause issues with db query speed but big enough to see if some kind of change between database technologies. This table also has three different data types — text (varchar), numbers, and timestamps.
Now let’s make a basic app that simulates making our queries. Using Python we will make an app that executes queries from a list and displays the result.
Below you can see the basic architecture of our design. We will run MariaDB and Postgres on Docker and the application code will connect to both, using the Harness FME feature flag to determine which one to use for the request.

The sample queries we used can be seen below. We are using 5 queries with a variety of SQL keywords. We include joins, limits, ordering, functions, and grouping.
We use the Harness FME SDK to do the decisioning here for our user id values. It will determine if the incoming user experiences the Postgres or MariaDB treatment using the get_treatment method of the SDK based upon the rules we defined in the Harness FME console above.
Afterwards within the application we will run the query and then track the query_executionevent using the SDK’s track method.
See below for some key parts of our Python based app.
This code will initialize our Split (Harness FME) client for the SDK.
We will generate a sample user ID, just with an integer from 1–10,000
Now we need to get whether our user will be using Postgres or MariaDB. We also do some defensive programming here to ensure that we have a default if it’s not either postgres or mariadb
Now let’s run the query and track the query_executionevent. From the app you can select the query you want to run, or if you don’t it’ll just run one of the five sample queries at random.
The db_manager class handles maintaining the connections to the databases as well as tracking the execution time for the query. Here we can see it using Python’s time to track how long the query took. The object that the db_manager returns includes this value
Tracking the event allows us to see the impact of which database was faster for our users. The signature for the Harness FME SDK’s track method includes both a value and properties. In this case we supply the query execution time as the value and the actual query that ran as a property of the event that can be used later on for filtering and , as we will see later, dimensional analysis.
You can see a screenshot of what the app looks like below. There’s a simple bootstrap themed frontend that does the display here.
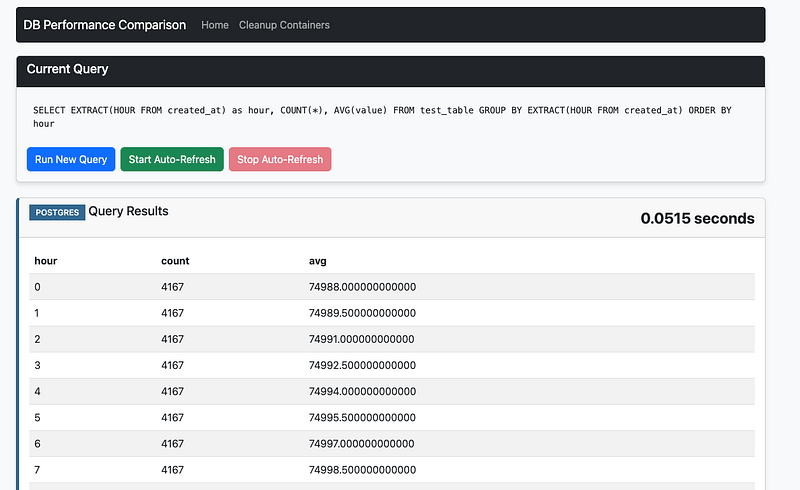
app screenshot
The last step here is that we need to build a metric to do the comparison.
Here we built a metric called db_performance_comparison . In this metric we set up our desired impact — we want the query time to decrease. Our traffic type is of user.
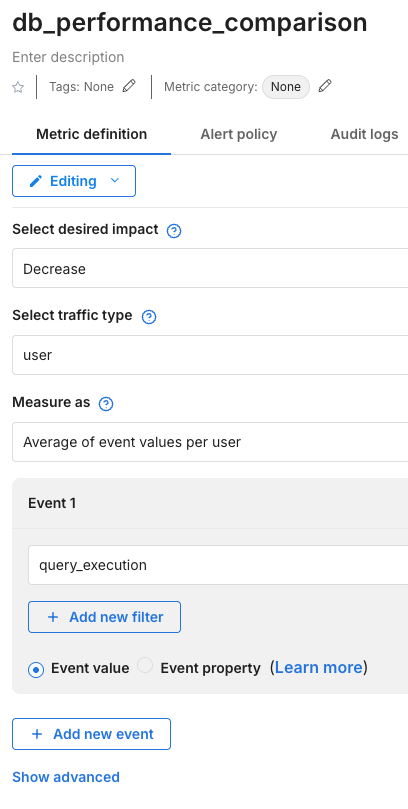
Metric configuration
One of the most important questions is what we will select for the Measure as option. Here we have a few options, as can be seen below
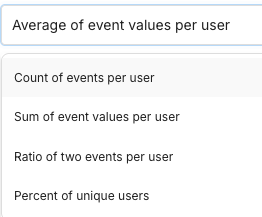
Measure as options
We want to compare across users, and are interested in faster average query execution times, so we select Average of event values per user. Count, sum, ratio, and percent don’t make sense here.
Lastly, we are measuring the query_execution event.
We added this metric as a key metric for our db_performance_comparison feature flag.

Selection of our metric as a key metric
One additional thing we will want to do is set up dimensional analysis, like we mentioned above. Dimensional analysis will let us drill down into the individual queries to see which one(s) were more or less performant on each database. We can have up to 20 values in here. If we’ve already been sending events they can simply be selected as we keep track of them internally — otherwise, we will input our queries here.
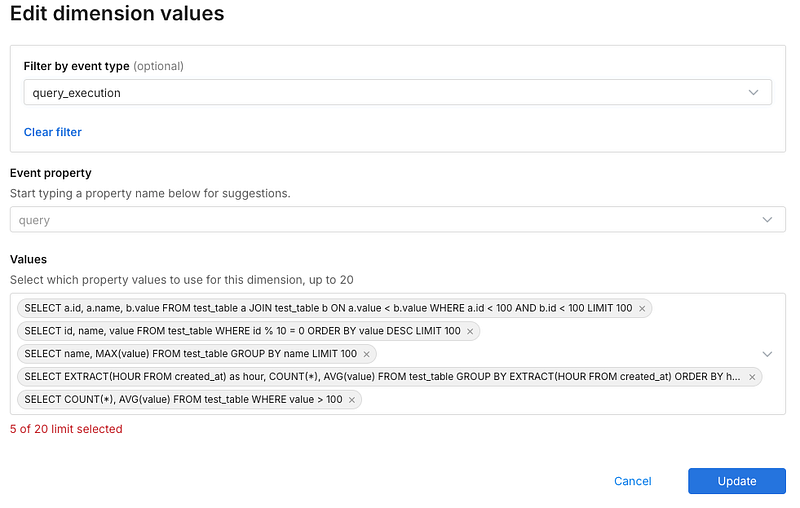
selection of values for dimensional analysis
Now that we have our dimensions, our metric, and our application set to use our feature flag, we can now send traffic to the application.
For this example, I’ve created a load testing script that uses Selenium to load up my application. This will send enough traffic so that I’ll be able to get significance on my db_performance_comparison metric.
I got some pretty interesting results, if we look at the metrics impact screen we can see that Postgres resulted in a 84% drop in query time.


Even more, if we drill down to the dimensional analysis for the metric, we can see which queries were faster and which were actually slower using Postgres.
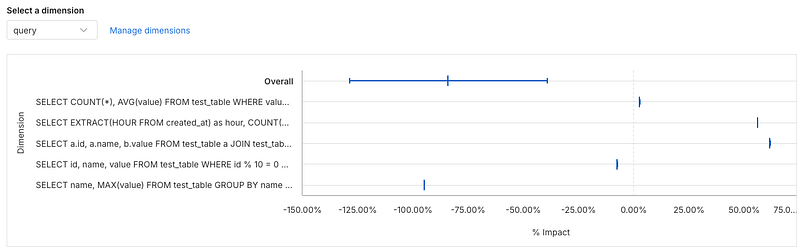
So some queries were faster and some were slower, but the faster queries were MUCH faster. This allows you to pinpoint the performance you would get by changing database engines.
You can also see the statistics in a table below — seems like the query with the most significant speedup was one that used grouping and limits.
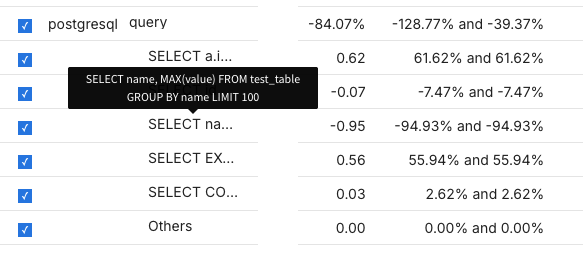
However, the query that used a join was much slower in Postgres — you can see it’s the query that starts with SELECT a.i... , since we are doing a self-join the table alias is a. Also the query that uses EXTRACT (an SQL date function) is nearly 56% slower as well.
Conclusion
In summary, running experiments on backend infrastructure like databases using Harness FME can yield significant insights and performance improvements. As demonstrated, testing MariaDB against PostgreSQL revealed an 84% drop in query time with Postgres. Furthermore, dimensional analysis allowed us to identify specific queries that benefited the most, specifically those involving grouping and limits, and which queries were slower. This level of detailed performance data enables you to make informed decisions about your database engine and infrastructure, leading to optimization, efficiency, and ultimately, better user experience. Harness FME provides a robust platform for conducting such experiments and extracting actionable insights. For example — if we had an application that used a lot of join based queries or used SQL date functions like EXTRACT it may end up showing that MariaDB would be faster than Postgres and it wouldn’t make sense to consider a migration to it.
The full code for our experiment lives here: https://github.com/Split-Community/DB-Speed-Test