
When a CI pipeline runs on cloud infrastructure, the build machine is ephemeral. It spins up, executes your build, and disappears. During that window, you have zero visibility into how much CPU and memory your pipeline actually consumes.
This blind spot creates real problems. Teams over-provision VMs "just in case," wasting compute spend. Others under-provision and deal with silent OOM-kills or CPU throttling — the only clue being a cryptic exit code 137. Without historical resource profiles, there's no data-driven way to right-size pipelines or catch regressions introduced by dependency upgrades.
We built CPU and Memory Insights to solve this. It gives you real-time and historical visibility into resource consumption during every Harness CI Cloud build — with zero configuration and zero impact on build performance.
Why Resource Visibility Matters
Consider a typical scenario: your build takes 12 minutes on a Large machine (4 vCPU, 8GB RAM). Is it CPU-bound during compilation? Memory-bound during docker build? Or is it I/O-bound pulling dependencies? Without metrics, you're guessing.
With CPU and Memory Insights, you can:
- Right-size your machines — see that a "Large" build peaks at 30% CPU and safely downgrade to "Medium," cutting your cloud spend.
- Debug failures faster — watch the memory ramp leading to an OOM kill and pinpoint which step caused it.
- Detect regressions — compare P90 CPU across builds to catch when a dependency update made things worse.
How It Works
The system collects resource metrics from inside the ephemeral VM, streams them in real-time to the Harness platform, and renders interactive charts in the execution view.
Architecture
Harness CI Cloud uses a multi-layered architecture for pipeline execution. The metrics flow is overlaid on the same path used for build orchestration:
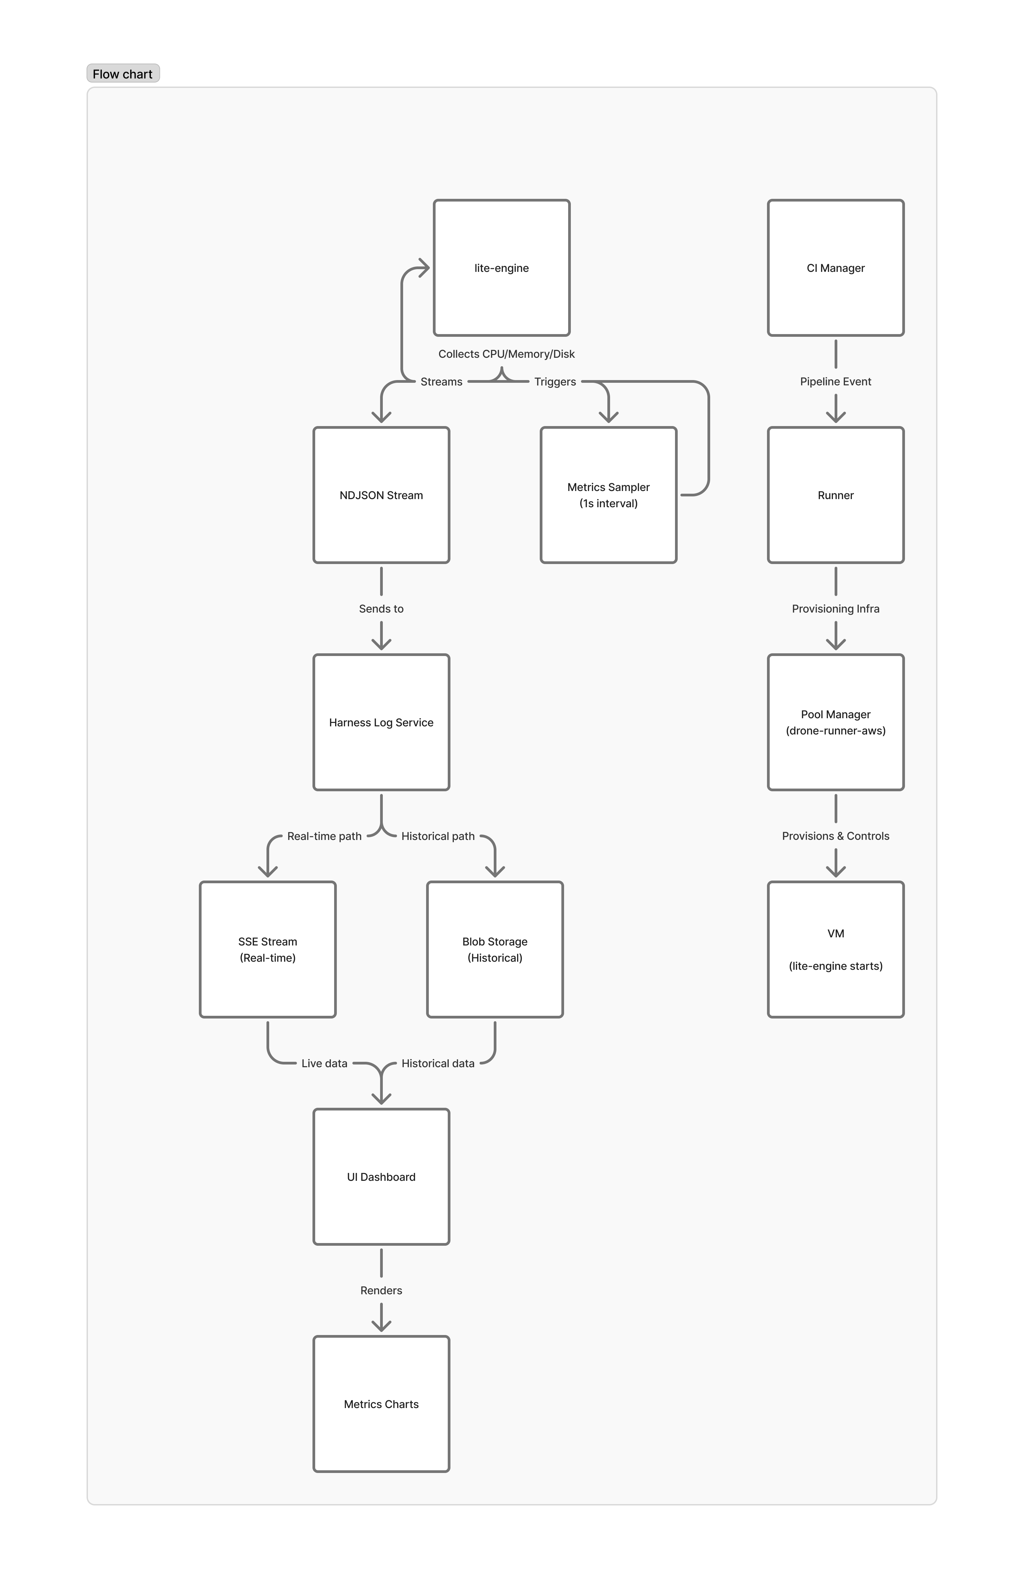
The key insight: lite-engine is the only component running inside the VM — it's the only one with access to actual resource utilization. But it has no persistent storage. Everything must be streamed out before the VM is destroyed.
Data Collection
When a VM is provisioned for your build, lite-engine starts a background process that samples system metrics every second:
- CPU utilization — aggregate percentage across all cores
- Memory usage — total and available, in GB
- Disk I/O — read and write throughput in bytes/sec
Each sample is written as a single JSON line (NDJSON format) to the Harness Log Service using a dedicated stream key. This is the same battle-tested infrastructure that powers step-level log streaming — we reuse its real-time SSE transport, blob storage, and access control. No new infrastructure needed.
Real-Time Streaming
The metrics stream opens during VM setup and closes during VM destroy, giving continuous coverage regardless of how many steps run or fail in between. The stream is independent of step execution — there are no gaps between steps.
During execution, the UI connects via Server-Sent Events (SSE) to receive metrics as they're collected. For completed builds, the same data is available from blob storage. The UI handles both transparently — same visualization whether you're watching a live build or reviewing a historical one.
Summary Statistics
When the VM is destroyed, lite-engine computes a final summary before closing the stream:
- Peak CPU — maximum utilization observed
- Average CPU — mean utilization across the entire stage
- P90 CPU — 90th percentile utilization (useful for right-sizing decisions)
- Total Disk I/O — cumulative bytes read and written
The frontend also computes P50, P90, P95, and P99 percentiles client-side, which means you get full statistics even for in-progress executions.
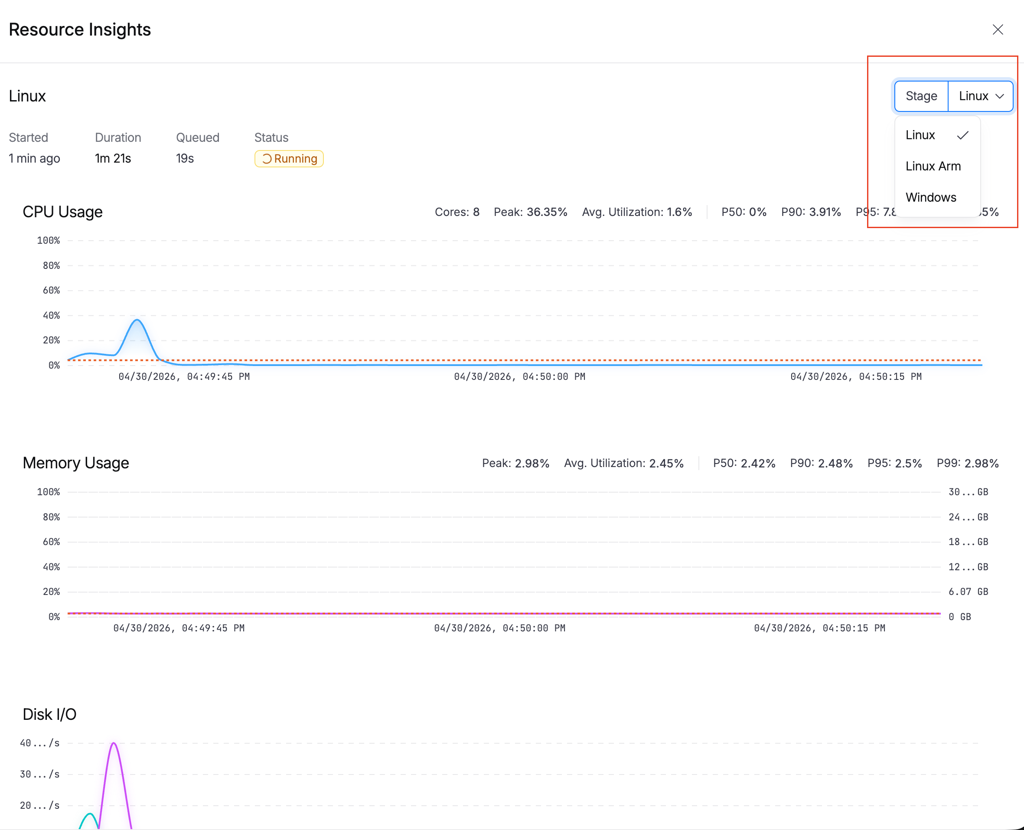
What You See in the UI
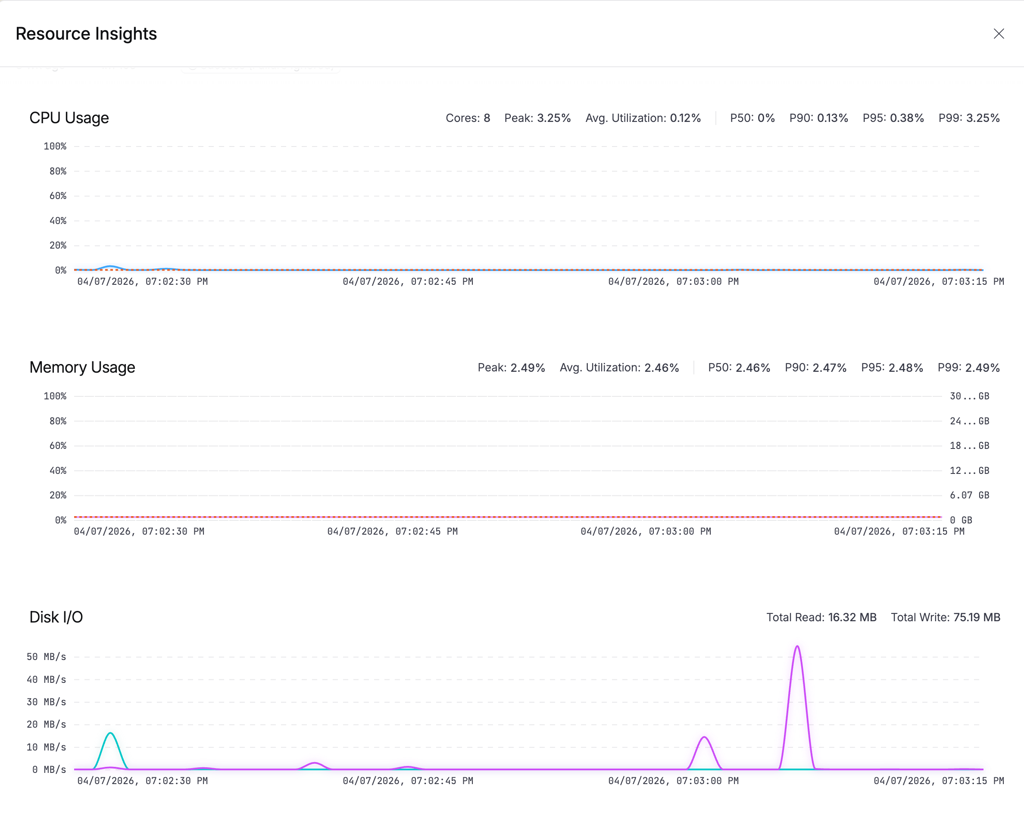
Click the resource indicator button in the execution view (it shows your platform and size, e.g., "Linux (Large)"). A drawer opens with three charts:
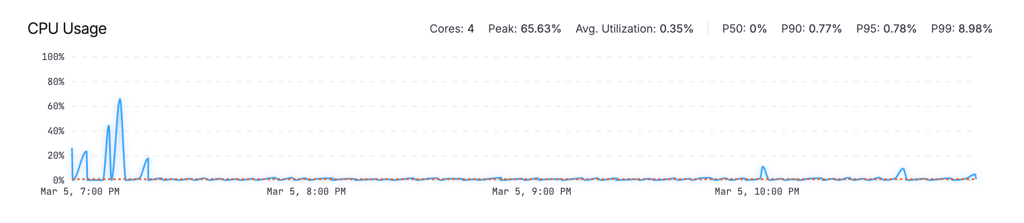
CPU Usage
An area chart showing utilization percentage over time, with a P90 reference line. The stats bar shows total cores, peak utilization, average, and percentiles (P50/P90/P95/P99).
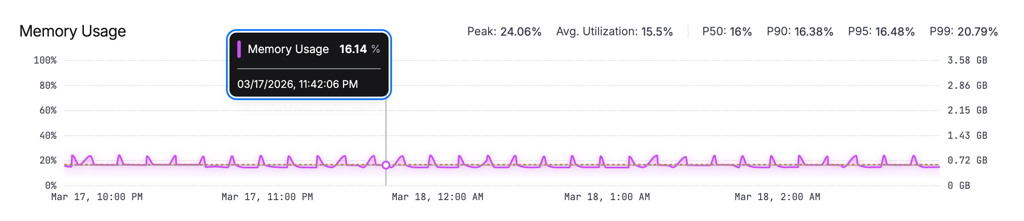
Memory Usage
An area chart with dual Y-axes: percentage on the left, GB on the right. Helps you understand both relative and absolute consumption at a glance.
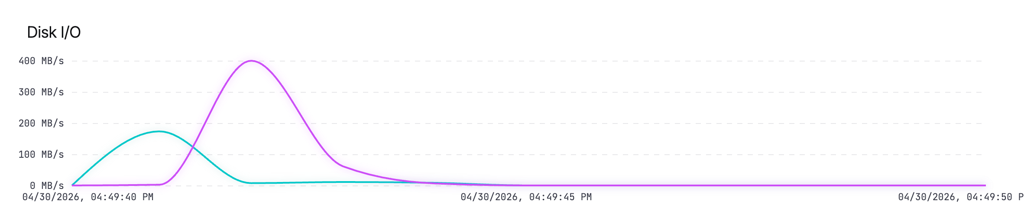
Disk I/O
A line chart showing read and write throughput in MB/s. Useful for identifying I/O-bound steps like image pulls or large file operations.
A stage selector dropdown at the top lets you switch between stages in multi-stage pipelines.
Cross-Platform Support
CPU and Memory Insights works across all Harness Cloud infrastructure:
layer normalizes platform-specific differences. Whether the underlying OS reports per-core or aggregate CPU, or uses different disk I/O naming conventions, the metrics are always presented consistently: aggregate CPU as a single percentage, memory in GB, and disk throughput as a delta rate.
Performance Impact
Resource collection runs with negligible overhead:
For long-running builds, the frontend intelligently downsamples to 120 data points for chart rendering while preserving visual accuracy — peaks and valleys are maintained using the LTTB (Largest-Triangle-Three-Buckets) algorithm.
Reliability
Builds can end in many ways: graceful completion, timeout, infrastructure failure, or force-kill. We handle all of them:
- Happy path: lite-engine writes the summary and closes the stream on VM destroy.
- Crash path: The platform-level cleanup phase independently closes the metrics stream if lite-engine didn't. This runs regardless of how the VM terminated.
This dual-closure approach ensures metrics data is never orphaned — you always get at least the raw timeline, even if the summary couldn't be computed.
What's Next
We're continuing to invest in resource intelligence for CI builds:
- Step-level attribution — correlating resource spikes with specific pipeline steps to pinpoint exactly which step is expensive.
- Automated right-sizing recommendations — using historical P90 data to suggest optimal machine sizes for your pipelines.
- Resource threshold alerts — notifying you when builds consistently approach memory limits, before they OOM-kill.
- Build-over-build comparison — overlaying metrics from the current build against previous runs to visualize the resource impact of code changes.
Get Started
CPU and Memory Insights is enabled by default for all pipelines running on Harness CI Cloud no setup required.
To explore the feature:
- Open any pipeline execution running on a Harness Cloud machine.
- Click the resource indicator in the stage execution header (for example,
Linux (Large)). - Open the insights drawer to view real-time and historical CPU and memory usage for your build.
No YAML changes. No additional agents. No configuration needed.
Use this visibility to quickly identify resource bottlenecks, right-size your build infrastructure, and improve overall CI efficiency.
Ready to optimize your builds? Try it in your next pipeline run or learn more in the Harness CI documentation.

All this author’s posts
Abhay Ganvir is a Software Developer focused on building scalable backend systems and intelligent applications.