Harness DevOps Academy

Step into DevOps: where development and operations unite for agile software delivery. Embrace collaboration, automation, and constant improvement to transform how teams manage applications in the fast-paced digital world.

Abstract graphic showing a central orb connected to integration icons

Academy Articles

All Topics
Thank you! Your submission has been received!
Oops! Something went wrong while submitting the form.
X (Twitter) icon
Thank you! Your submission has been received!
Oops! Something went wrong while submitting the form.

What Are Worker Agents in DevOps?

A worker agent is an AI agent that executes a delegated software delivery task as a step inside a delivery pipeline, rather than answering questions in a chat window. Worker agents operate in a loop: they receive a goal, plan an approach, call tools against real systems, verify their own output, and hand off a reviewable result such as a commit or a pull request. Because a worker agent runs inside existing pipeline infrastructure, it inherits that pipeline's access controls, policy enforcement, and audit trail instead of requiring a separate governance model.

8 min read

Introduction

A worker agent is an AI agent that carries out a delegated software delivery task inside a pipeline, such as fixing a failed build, remediating a Kubernetes manifest, closing a coverage gap, and producing an auditable output rather than a suggestion. This article covers what worker agents are, how they execute, how they differ from build agents and conversational AI assistants, the risks they introduce, and the controls that make them safe to run against production systems.

The reason the term is appearing now is a shift in how engineering time is allocated. AI has become genuinely good at generating code. The work between writing code and running it in production — building, testing, scanning, deploying, remediating, operating — has not changed nearly as much, and in most organizations it still consumes the larger share of the day. Worker agents are an attempt to apply reasoning models to that layer.

What is a worker agent?

A worker agent is an AI agent that autonomously executes a delegated task as a step in an automated workflow, using tools to act on real systems and producing a verifiable output. The defining characteristic is action. A worker agent does not return advice for a human to act on; it performs the work and leaves behind an artifact: a commit, a pull request, a patched manifest, a closed ticket.

Three properties separate a worker agent from adjacent things it gets confused with:

  • Delegated goal, not a fixed instruction set: A script is told exactly what commands to run. A worker agent is told what outcome to achieve and reasons about how to get there, which means it can handle inputs its author never anticipated.
  • Autonomous multi-turn execution: It can call a tool, read the result, revise its approach, and call another tool, repeating until the goal is met or it gives up. A single-shot LLM call cannot do this.
  • Verifiable output: The result is something a human or a system can inspect and accept or reject, not a paragraph of prose whose correctness is a matter of opinion.

Worker agents are sometimes described as agentic DevOps, and the underlying idea is straightforward: any step in a delivery pipeline that currently runs a fixed script could instead run a reasoning agent.

How do worker agents work?

A worker agent executes as a loop rather than a linear script. The stages below describe a typical implementation:

  1. Task intake: The agent receives a goal and its inputs. In pipeline-based implementations, this happens when the pipeline reaches the agent's step and passes its context: the repository, the branch, the failed build's logs, and the scan findings.
  2. Planning: The agent decomposes the goal into an approach. This is where reasoning models differ most from scripts; the plan is generated per run, against the actual state of the system, rather than encoded in advance.
  3. Tool and context access: The agent is granted a specific set of capabilities, which repositories it can read, which commands it can run, and which external services it can reach. Well-designed implementations grant this explicitly rather than inheriting whatever ambient credentials happen to be present in the environment.
  4. Execution: The agent acts — editing files, running builds, querying APIs — observing the result of each action before choosing the next.
  5. Verification: The agent checks its own work against a defined bar. For a code-modifying agent, this usually means re-running the test suite, the linter, and the build, and treating a failure as a reason to iterate rather than a reason to stop.
  6. Handoff: The agent produces its output and exits. Depending on how much autonomy it has been granted, that output goes straight to the target system, or into a pull request awaiting human review, or into an approval gate.

The bounded quality of step 4 is what makes the difference between a demo and something runnable against production. An agent with unbounded reasoning steps and unbounded permissions is not a delivery tool; it is an incident waiting for a trigger.

Worker agents vs. build agents, runners, and delegates

"Agent" is heavily overloaded in DevOps, and worker agents are frequently confused with infrastructure components that have carried the name for years. The distinction is decision-making.

Worker agent Build agent / runner Delegate
What it is A reasoning process that executes a delegated task A worker process that executes assigned jobs A connectivity component that runs tasks inside your network
Decides what to do Yes - plans its own approach per run No - runs the steps defined in the job No - runs instructions from the control plane
Adapts to unexpected input Yes No - fails or passes No
Output Commit, PR, patch, report Build artifact, test result Task result
Typical trigger Pipeline step, schedule, or event Queued job Control plane instruction

A build agent and a worker agent can operate on the same commit in the same pipeline. The build agent compiles it deterministically. The worker agent decides what to do when the compilation fails.

Types of worker agents in software delivery

Worker agents in production today cluster around recurring, well-scoped delivery toil.

Build repair agents

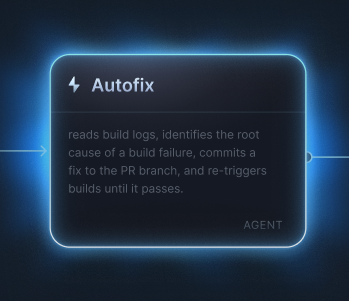
Diagnose the root cause of a failed CI build, apply a fix, and re-trigger until the pipeline passes. This is often the first agent teams deploy, because the failure signal is unambiguous and the success criterion is a green build.

Code review agents

Read a pull request and post targeted feedback on security issues, hardcoded secrets, and code quality. Value depends heavily on the agent knowing which services are production-critical, which is why context beyond the diff matters.

Test and coverage agents

Generate meaningful unit tests to close coverage gaps. The failure mode to design against is tests that raise the coverage number without testing behavior.

Configuration remediation agents

Analyze failed Kubernetes or Helm deployments, or infrastructure drift, and produce a corrected manifest or configuration change.

Security triage agents

Classify scan findings and assess which services a newly disclosed vulnerability actually affects. The bottleneck in vulnerability response is usually triage volume rather than patch availability, which makes this a natural fit — and a high-stakes one.

Cleanup agents

Retire stale feature flags, remove dead code, and handle dependency and framework upgrades, including the code migration that breaking changes require.

Benefits of worker agents

  • They absorb work that scales with code volume. Build failures, scan findings, and drift all increase as delivery accelerates. Agent capacity scales with them in a way that headcount does not.
  • They compress response time on unambiguous work. A build that fails at 2pm does not need to wait for someone to pick it up.
  • They handle the cases scripts cannot. Automation stalls where the correct action depends on context. A reasoning agent can handle that class of decision, which extends automation into work that previously required a person.
  • They make delivery knowledge reusable. An agent definition encodes how a team handles a recurring problem, in a file that other teams can read, fork, and improve.
  • They shift senior engineering time toward judgment. The work being delegated is largely work that no one was doing by choice.

Risks and limitations

Worker agents introduce failure modes that traditional automation does not have. These are the ones to plan for:

  • Non-determinism. The same inputs can produce different outputs across runs, which makes agent behavior harder to test than script behavior and means passing once does not mean evidence of correctness.
  • Scope drift. Agents tend to wander beyond their assigned task — inspecting adjacent pipeline stages, touching files outside the intended change. This is common enough in practice to assume it will happen and constrain for it structurally.
  • Over-provisioned credentials. The fastest way to get an agent working is to give it broad access. That decision is also the one most likely to turn a bad output into a production incident.
  • Cost opacity. Token spend accumulates per run and is easy to discover on an invoice rather than in a dashboard. Model choice matters more than teams expect: the same task can differ by more than an order of magnitude in cost depending on which model runs it, and the most capable model is frequently unnecessary for routine work.
  • New attack surface. Prompt injection, credential leakage through reasoning traces, and jailbreaking are agent-specific vulnerability classes with no equivalent in scripted automation.
  • Audit ambiguity. If AI-initiated actions land in the audit log under a generic system identity, incident attribution becomes guesswork and compliance reporting becomes manual.
  • Review bottlenecks. An agent that opens more pull requests than the team can review has moved the constraint rather than removed it.
  • Over-trust. Agents are frequently confidently wrong. Their output is a proposal to be evaluated, not a conclusion.

How to govern worker agents

Governing a worker agent means constraining what it can do structurally, so that a bad output cannot become a bad outcome. The controls that matter:

Give every agent its own identity. An agent should be a distinct principal in your access control system, the way an employee is — not a shared service account and not the credentials of whoever triggered it.

Scope permissions to the task, and make them ephemeral. A code review agent needs pull request access. A deployment agent needs artifact registry credentials. These should not be the same grant. The strongest available pattern mints a short-lived token per run whose scope is the intersection of the agent's declared permissions and the triggering user's own access, so a declared grant can only narrow what the invoker could already do, never widen it. The token is destroyed when the run completes.

Sandbox execution. Run the agent in an isolated container as a non-root user, with a read-only filesystem outside its workspace and network access restricted to an explicit allowlist. An agent that generates a malicious command should have nowhere to send data.

Keep secrets out of the model context. Credentials should be resolved by the execution environment, not passed to the LLM. Prompts and reasoning traces should be stripped of secrets and PII before they are persisted.

Enforce policy at multiple checkpoints, not just at configuration time. Policy evaluation when an agent definition is saved catches misconfiguration. Evaluation when the pipeline starts and again when the agent attempts a governed action catches everything else, including behavior the definition did not predict.

Attribute every action distinctly in the audit trail. AI-initiated actions need their own identity in the log, with a full provenance chain: what triggered the agent, which version of its definition ran, every action it took, and the outcome. This is what makes AI activity filterable and reportable rather than buried.

Cap cost per agent and per pipeline. Set hard spending limits at the point of execution rather than reconciling after the fact.

Gate the blast radius. Approval gates before an agent's change ships, and a rollback path if it ships badly. The same gates that protect human deployments apply.

Best practices for adopting worker agents

  1. Start with low-risk toil. Documentation generation, test result summarization, report assembly. The goal of the first agent is to learn the operational model, not to solve the hardest problem.
  2. Move to reviewable work next. Code review and triage, where the agent's output is a recommendation a human accepts or rejects, so mistakes are cheap and visible.
  3. Add human-in-the-loop approval before anything ships. Let the agent do the work and a person approve the result. Remove the approval only for agents with a track record.
  4. Right-size the model. Validate the use case with a capable model, then test whether a smaller one produces equivalent results. For routine tasks it usually does, at a fraction of the cost.
  5. Bound the reasoning. Cap the number of steps an agent may take. Unbounded loops are how cost and scope both escape.
  6. Version agent definitions in Git. Store the definition in your repository so behavior changes go through code review with the same approval gates as everything else.
  7. Keep a catalog. Track every agent in the organization with its owner, its permissions, and what it can reach. Agent sprawl is a governance problem before it is a cost problem.

Worker agents and Harness

Harness Autonomous Worker Agents, run as steps inside existing Harness pipelines. Because they execute inside that infrastructure, they inherit its governance rather than requiring a parallel one: the OPA policies that gate deployments also gate agents, the RBAC that controls who can push to production controls who can trigger an agent, and every action lands in the Harness Audit Trail under a distinct Harness AI principal with a full provenance chain.

Each run executes in a container on customer-controlled infrastructure with a scoped ephemeral token, and agents reason over the Harness Software Delivery Knowledge Graph — a connected map of services, pipelines, deployments, incidents, and security findings — so a remediation reflects the actual production blast radius rather than a generic fix. Agents are authored as a single file with YAML frontmatter and natural-language instructions, or generated through Harness AI, and Harness Managed Agents are available in the Harness Agent Marketplace to fork and customize.

Explore Worker Agents →

Frequently asked questions

What is a worker agent?

A worker agent is an AI agent that autonomously executes a delegated task as a step in an automated workflow, using tools to act on real systems and producing a verifiable output such as a commit or pull request. Unlike a chat assistant, it performs the work rather than describing how to do it.

How do worker agents work?

A worker agent receives a goal, plans an approach, calls tools to act on real systems, checks its own output against a defined bar, and iterates until it succeeds or exits. Each run generates its plan against the current state of the system rather than following pre-written steps.

What is the difference between a worker agent and an AI agent?

"AI agent" is the general category for any system that plans and takes actions toward a goal. "Worker agent" is the narrower case of an agent that executes delegated operational work as a step in an automated workflow, rather than conversing with a user.

Are worker agents the same as build agents?

No. A build agent executes the steps a job defines, deterministically. A worker agent decides what steps to take. Both can run in the same pipeline: the build agent compiles the code, the worker agent decides what to do when compilation fails.

Do worker agents replace developers?

No. Worker agents absorb recurring delivery toil — build failures, scan triage, dependency upgrades — that scales with code volume. Their output is a proposal that a human reviews, and defining what an agent should do remains an engineering judgment.

What is agentic DevOps?

Agentic DevOps is the practice of running reasoning agents in place of fixed scripts at steps in the software delivery lifecycle. Instead of a pipeline stage executing predetermined commands, it delegates a goal to an agent that determines the approach at runtime.

How do you secure a worker agent?

Give the agent its own identity with permissions scoped to its task, issue short-lived credentials per run, sandbox execution in an isolated non-root container with restricted network access, keep secrets out of the model context, enforce policy at runtime, and attribute every action distinctly in the audit trail.

Can worker agents run in a CI/CD pipeline?

Yes, and pipeline-native execution is the most common production pattern. Running the agent as a pipeline step means it inherits the access controls, policy enforcement, approval gates, and audit trail already governing that pipeline instead of needing separate governance infrastructure.

Harness Platform
What Are Worker Agents in DevOps?

How to Reduce Mean Time to Detect (MTTD) in Complex Software Environments

One of the quickest ways to protect SLOs, stop Sev-1 incidents, and cut down on developer work without hiring more people is to lower the Mean Time to Detect (MTTD). You can lower MTTD by making alerts with a lot of signals, moving detection left into CI/CD and feature flags, and using AI to make every change "change-aware." Using templates, Policy as Code and scorecards to manage things makes sure that detection quality stays the same as you grow across teams, services, and clouds.

8 min read

If incidents catch your teams off guard for more than 30 minutes, you don't have an availability problem; you have a detection problem. Most teams see automation cut their Mean Time to Detect (MTTD) and response times by a lot, but many still think their tools can't keep up with modern, often AI-driven, attacks and failure modes.

The quickest way to lower MTTR, cut down on work, and keep error budgets safe without hiring more people is to lower MTTD. Minute-level and hour-level detection can make a possible Sev-1 into a contained Sev-2. This guide tells you how to correctly figure out MTTD, make signals that bring up problems early, use AI for change-aware detection, and manage everything at the enterprise level.

With Harness Continuous Delivery, you can start reducing your MTTD right away. It uses AI-powered features that help platform teams find problems faster at deployment time.

What is Mean Time to Detect (MTTD)?

Mean Time to Detect (MTTD) tells you how long it takes for your systems or teams to notice an incident after it starts. When symptoms that affect users start, the clock starts. It stops when an engineer sends an alert, a page, or an explicit message.

MTTD isolates your detection capability. Traditional MTTR combines detection, acknowledgment, investigation, and resolution into a single number. MTTD is often the real problem if your teams can fix problems quickly once they know about them.

Why it’s important:

  • Faster detection stops small problems from turning into outages that affect multiple services.
  • Lower MTTD preserves error budgets and keeps SLOs healthy even with frequent deployments.
  • Platform teams can use MTTD trends across services to show how observability and automation investments pay off.

Pair MTTD with metrics like deployment frequency, MTTR, and change failure rate to build a credible engineering metrics program.

How to Calculate Mean Time to Detect (MTTD)

The MTTD formula is simple:

MTTD = (Sum of detection times for all incidents) ÷ (Number of incidents)

The hard part is consistent, trustworthy timestamps. Use this workflow:

  1. Define incident start: Use the moment user-impacting symptoms begin, not when a ticket is opened. Examples: SLO breach start, error-rate spike beyond threshold, or a fatal log indicating a systemic issue.
  2. Define detection time: Use the first objective signal that the incident is recognized:
  • Monitoring/observability alert fires.
  • On-call system sends a page.
  • Engineer explicitly records the incident after spotting it.
  1. Collect clean, tagged data:
    • Record both timestamps in your incident system (PagerDuty, ServiceNow, Harness SRM, etc.).
    • Exclude synthetic failures unless they mimic real user journeys.
    • Deduplicate correlated alerts from the same root cause.
    • Tag incidents by service, severity, and environment.
  1. Calculate by segment:
    • Compute MTTD by severity (P1, P2) and by service tier (critical user journeys vs. internal tools).
    • Review weekly for operational health and monthly for platform and leadership discussions.

Security teams calculate MTTD the same way, but with different signals (threat indicators rather than SLOs). The math is identical; the telemetry is not.

MTTD vs. MTTR vs. SLOs

Mean Time to Detect sets a floor under how fast you can ever resolve incidents. If detection averages 20 minutes and resolution work averages 10, your MTTR is never going below ~30 minutes.

Think of four clocks:

  • MTTD: Incident start → first awareness.
  • MTTA: First alert → human acknowledgment.
  • MTTM: Acknowledgment → partial or full mitigation.
  • MTTR: Incident start → full resolution.

Optimizing MTTR without fixing MTTD is a dead end. You’ll get diminishing returns quickly. To make improvements meaningful to users:

  • Define SLOs on real user journeys.
  • Page primarily on SLO burn rate and error budgets, not CPU or memory.
  • Count only SLO-relevant incidents in your primary MTTD statistics to avoid optimizing around noise.

Best Practices to Lower MTTD in Cloud-Native and Multi-Cloud Environments

Lowering MTTD in complex environments comes down to three moves: instrument the right signals, standardize detection, and move detection earlier in the lifecycle.

Instrument Golden Signals at Service Boundaries

Use the four golden signals: latency, traffic, errors, and saturation at service boundaries, not just at the infrastructure layer:

  • Capture success and failure latencies separately, including P95/P99.
  • Monitor error rates per endpoint or user journey, not only per cluster.
  • Tie these metrics to SLOs for your highest-value paths.

Then, page on SLO burn instead of raw thresholds.

Standardize Detection with Platform-owned Templates

Per-team alerting “snowflakes” drive up Mean Time to Detect (MTTD) because coverage and quality vary wildly:

  • Create platform-owned templates for SLOs, SLIs, and alert policies.
  • Let teams adjust thresholds and channels within guardrails, but keep core signal definitions consistent.
  • Track adoption and drift with a central metrics program, as outlined in our engineering metrics article.

This keeps new services from shipping with weak or no detection.

Optimize Detection Around Changes, Not Just Steady-State Failures

Many production incidents are triggered by change: a new deployment, a configuration update, an infrastructure modification, a dependency upgrade, or a feature flag rollout. That makes deploy time one of the highest-leverage moments to reduce MTTD. 

Instead of waiting for dashboards, support tickets, or customer reports, high-performing teams make detection explicitly change-aware.

To do that, correlate every runtime change with the service health signals that matter most:

  • SLO burn rate on critical user journeys
  • Error-rate and latency regressions by endpoint or workflow
  • Dependency failures and downstream saturation
  • Changes in behavior during canary, blue-green, or phased rollouts

This shifts detection closer to the moment risk is introduced.

Use Automated Deployment Verification to Catch Regressions Faster

Automated deployment verification helps reduce MTTD by turning deployments into structured runtime health checks. At a basic level, you can set static thresholds. This is normal in tools like Argo Rollouts.

In more advanced approaches, instead of relying solely on static thresholds, AI verification compares service behavior before and after a release and looks for statistically significant deviations in signals tied to user experience.

A strong verification workflow should:

  • Evaluate live telemetry during and immediately after rollout (or between canary and baseline versions)
  • Prioritize SLO-aligned metrics over isolated infrastructure noise
  • Surface likely regressions while blast radius is still limited

This is where AI can be useful in a concrete way. AI-assisted verification can correlate deploy events with shifts in latency, errors in logs, or saturation, highlight the most likely change-related anomalies, and reduce the time engineers spend assembling context. 

That makes detection faster and more reliable, especially in environments with frequent releases and many interdependent services.

Harness AI-assisted deployment verification automatically builds and runs these health checks for every deployment.

Tie Detection to Rollback to Reduce MTTR Too

Detection is helpful, but not enough. Once a deployment-related regression is identified, the next advantage comes from linking verification directly to automated rollback or feature-flag disablement. 

This leverages your improvements in MTTD to bring down MTTR - which is what really matters.

In practice, that means:

  • Block promotion when verification fails
  • Automatically roll back unhealthy releases
  • Disable problematic features without redeploying
  • Preserve incident context so responders can investigate quickly

When this pattern is in place, change-aware detection improves MTTD, and automated containment improves MTTR. Together, they prevent small regressions from turning into multi-service outages and reduce the operational toil that comes from discovering problems only after customers feel them.

Designing Observability That Surfaces the Right Issues Fast

Good observability is not about more dashboards. It’s about the shortest, clearest path from “something broke” to “we know what changed.”

Prioritize a Three-tier Signal Model

Organize signals by impact:

  1. SLO burn-rate alerts for direct user-impacting issues.
  2. Anomaly detection alerts for performance drift ahead of SLO breaches.
  3. Dependency health checks for upstream/downstream failures that explain symptoms.

Harness Service Reliability Management helps structure this hierarchy so that on-call engineers see user impact first.

Correlate Telemetry With Change Events

Context switching kills Mean Time to Detect. Reduce it by:

  • Putting logs, metrics, traces, and change events in one view.
  • Rendering deploys, config changes, and infrastructure events as first-class markers on timelines.
  • Making it trivial to answer: “What changed right before this started?”

Harness CD provides visual DevOps data views that make cause-and-effect far more obvious.

Control Alert Volume

Alert fatigue quietly inflates MTTD:

  • Cap alert policies per service to a reasonable band.
  • Merge overlapping alerts that describe the same symptom.
  • Use SLO-based alerts as the primary paging mechanism; route lower-level alerts as context.

Engineers respond faster to a small number of trusted alerts than to dozens they’ve learned to ignore.

MTTD Benchmarks and Metrics That Matter

Benchmarks for MTTD depend heavily on architecture and risk tolerance. Use them as directional targets, not absolutes:

  • P1/P0 critical user journeys: Aim for MTTD ≤ 5–15 minutes.
  • P2 medium impact: Aim for MTTD ≤ 30 minutes.
  • Internal/low impact: Track MTTD but optimize for noise reduction and developer experience first.

MTTD alone is not enough. Track it alongside:

  • MTTA and MTTR, to confirm that detection improvements translate into faster resolution.
  • SLO health and error budgets, to ensure improvements actually protect users.
  • Alert volume and false positive rate, to prevent “alert everything” from undermining trust.

Harness Service Reliability Management correlates these views through SLOs and error budgets.

Governance: Making Good MTTD the Default

You can’t rely on discipline alone to keep MTTD low at scale. You need guardrails.

Codify Templates and Runbooks

Stop rebuilding detection from scratch:

  • Create versioned templates for golden signals, SLOs, alert policies, and standard runbooks.
  • Require new services to start from those templates.
  • Adjust centrally as you learn from incidents.

Harness Templates and pipeline governance ensure that no service ships to production without minimum detection and rollback coverage.

Enforce Policy-as-code for Detection Guardrails

Let teams customize within safe bounds:

  • Use policy-as-code (for example, OPA) to enforce required verification steps, minimal alerting, and SLO presence.
  • Keep full audit trails and RBAC around who can change detection-related policies.
  • Adjust policies based on real MTTD and SLO trends, not opinion.

This preserves autonomy while keeping detection quality consistent.

Use Scorecards to Track MTTD Improvements

Scorecards turn Mean Time to Detect (MTTD) from a graph into a target:

  • Median MTTD by service and severity.
  • Percentage of services onboarded with platform templates.
  • Time to onboard a new service into “production-ready” detection.
  • Alert volume per service vs. agreed healthy ranges.

Shrink MTTD With Change-Aware Detection and Real SLOs

The biggest wins often come from simply correlating deployment events with service health in real time and automating detection around change. Many teams see double-digit percentage reductions in MTTD once every deployment is observable, verifiable, and rollback-ready.

Ready to implement real-time SLO tracking and automated error budgets that prevent incidents before they escalate? Harness Service Reliability Management provides the change impact analysis and proactive verification your platform team needs to shrink detection times without adding operational overhead.

Mean Time to Detect (MTTD): Frequently Asked Questions (FAQs)

This FAQ addresses the most common questions platform, SRE, and security teams have about Mean Time to Detect (MTTD), from how to calculate it correctly to how it connects with CI/CD, SLOs, and MTTR. Use it as a quick reference when you’re setting targets or explaining MTTD to stakeholders.

What is Mean Time to Detect (MTTD), and how do you calculate it?

The average time between when an incident starts and when your team first hears about it is called the Mean Time to Detect. To find it, take the detection time for each incident in a period and subtract the start time of the incident. Then add up all the detection times and divide by the number of incidents.

What is a good Mean Time to Detect (MTTD) target for complex microservice environments?

There isn't a single goal, but many teams try to find P1 incidents that affect important user journeys in less than 5 to 15 minutes and P2 incidents in less than 30 minutes. Instead of trying to reach a single benchmark, focus on making steady progress and breaking things down by their impact.

How does reducing MTTD actually reduce developer toil instead of just waking people up earlier?

Lower MTTD stops small problems from turning into big problems that affect multiple services and need a lot of firefighting. Finding problems during canary rollouts, feature-flag ramps, or CI pipelines makes it easy to quickly roll back or disable flags. This keeps most developers focused on feature work instead of having to deal with emergencies.

How can CI/CD and feature flags help reduce Mean Time to Detect (MTTD)?

With smart testing and change-aware verification, CI/CD pipelines find regressions earlier, sometimes even before the full production rollout. With feature flags and real-time monitoring, you can make changes slowly, see how they affect things with a small blast radius, and turn off flags that are causing problems right away, which lowers both MTTD and MTTR.

How often should we review MTTD and related reliability metrics?

Most teams keep an eye on MTTD all the time, but they look at trends once a week in operations reviews and once a month in broader reliability or platform reviews. You can see how detection and resolution trade off over time by putting MTTD, MTTR, SLO health, and alert volume in the same view.

What’s the difference between MTTD in reliability vs. security contexts?

In reliability/SRE, MTTD measures how quickly you spot performance or availability issues that affect users or SLOs. In security, it measures how quickly you detect threats or intrusions. The formula is the same, but the signals (for example, SLOs vs. threat indicators) and playbooks differ.

Software Delivery Agent
How to Reduce Mean Time to Detect (MTTD) in Complex Software Environments

What is Static Application Security Testing (SAST)?

Learn what Static Application Security Testing (SAST) is, how it works, and why it’s essential for secure software development.

8 min read

Security isn’t something you can afford to bolt on at the end of development anymore. With faster release cycles and increasingly complex applications, vulnerabilities can slip through the cracks long before anyone notices, often when it’s already too late.

That’s why more teams are shifting security earlier in the development process. Instead of waiting for runtime testing or external audits, they’re building security directly into how code is written and reviewed.

Static Application Security Testing (SAST) plays a key role in that shift. By analyzing code before it’s ever executed, SAST helps teams identify vulnerabilities early, reduce risk, and maintain development speed without sacrificing security.

What is Static Application Security Testing (SAST)?

SAST is a security testing method that examines an application’s source code, bytecode, or compiled code to uncover vulnerabilities, without actually running the program.

Think of it as reviewing your code with a security-first lens. Instead of waiting for something to break in production, SAST helps you catch issues before  the code is built.

Simple SAST tools use techniques like pattern matching to scan for vulnerabilities and insecure coding practices, while advanced tools can add in data flow analysis and control flow analysis. These tools can flag issues such as:

  • SQL injection vulnerabilities
  • Cross-site scripting (XSS)
  • Buffer overflows
  • Input validation errors
  • Insecure dependencies or logic flaws

Because SAST works directly on the codebase, it gives developers immediate feedback, making it easier to fix problems early, when they’re fastest and cheapest to resolve.

That said, SAST isn’t meant to work alone. It’s most effective when combined with other approaches like Dynamic Application Security Testing (DAST) to provide a more complete picture of your application’s security.

Why is Static Application Security Testing (SAST) important?

Modern development moves fast. Code is shipped daily (sometimes hourly), and security can easily fall behind if it’s treated as an afterthought.

That’s where SAST comes in.

SAST shifts security left, meaning it brings security checks earlier into the development lifecycle. Instead of discovering vulnerabilities after deployment, teams can identify and fix them during development.

Here’s why that matters:

1. It catches issues before they become expensive problems

Fixing a vulnerability in production is not just a technical issue. It’s a business risk. It can lead to downtime, data breaches, and loss of customer trust. SAST helps prevent that by catching issues early.

2. It improves developer habits over time

Good SAST tools don’t just flag issues. They explain them. Over time, developers learn what secure code looks like, which leads to better coding practices across the team.

3. It provides deep visibility into your codebase

Unlike manual reviews, SAST tools can analyze large codebases quickly and consistently. More advanced tools can trace intricate code paths and identify edge-case vulnerabilities that are easy to miss.

4. It supports compliance and security standards

Many industries require adherence to secure coding standards. Integrating SAST into your pipeline helps demonstrate compliance and builds trust with customers and stakeholders.

5. It strengthens your overall security strategy

SAST is not a silver bullet, but it’s a critical first layer. When combined with DAST, IAST, and manual testing, it helps create a well-rounded, defense-in-depth approach to application security.

Benefits of Static Application Security Testing SAST 

SAST offers numerous benefits, making it an invaluable component of a robust application security strategy. Here are some of the key advantages of incorporating SAST into your software development lifecycle:

  • Early Detection of Vulnerabilities: One of the primary benefits of SAST is its ability to identify security vulnerabilities and coding flaws at the earliest stages of development. By analyzing source code before it is compiled or deployed, SAST enables developers to proactively address potential security issues, reducing the risk of costly, disruptive incidents later in the process.
  • Cost-Effective and Efficient: Fixing security vulnerabilities during the development phase is typically more cost-effective than addressing them after deployment or in production environments. SAST enables organizations to save time and resources by catching and remediating issues early, leading to more efficient development cycles and reduced overall security costs.
  • Comprehensive Code Coverage: SAST tools analyze the entire codebase, including complex code paths and corner cases that may be difficult to uncover through manual code reviews alone. This comprehensive coverage ensures that even the most obscure vulnerabilities are detected, reducing the risk of overlooked security flaws.
  • Scalability and Automation: SAST tools can handle large and complex codebases, making them suitable for organizations with extensive software portfolios. Additionally, SAST can be integrated into the development pipeline, enabling automated, continuous security testing that further enhances efficiency and consistency.
  • Compliance and Security Standards: By incorporating SAST into their software development processes, organizations can demonstrate their commitment to secure coding practices and compliance with industry standards and regulatory requirements. SAST helps ensure that applications meet security benchmarks and guidelines, fostering trust among customers, partners, and stakeholders.
  • Developer Education and Awareness: SAST tools provide detailed feedback on coding errors and insecure practices, enabling developers to learn and improve their coding skills. This continuous learning process promotes a security-conscious mindset among developers, resulting in more secure, robust code from the outset.

How is SAST different from DAST?

Static Application Security Testing and Dynamic Application Security Testing are two distinct approaches to identifying security vulnerabilities in software applications, each with its own strengths and focus areas. While SAST analyzes the application's source code or compiled binaries without executing it, DAST examines the running application's behavior and interactions during runtime.

The primary difference between SAST and DAST lies in their respective methodologies and the types of vulnerabilities they are designed to detect:

  1. Analysis Approach:
    • SAST: Analyzes the application's source code, bytecode, or compiled version using techniques such as data flow analysis, control flow analysis, and pattern matching.
    • DAST: Interacts with the running application by simulating real-world attacks and user behavior, and observes the application's responses.
  2. Vulnerability Identification:
    • SAST excels at identifying vulnerabilities in coding flaws, insecure coding practices, and issues detectable through static code analysis, such as input validation errors, cross-site scripting (XSS), SQL injection, and buffer overflows.
    • DAST is better suited for identifying runtime vulnerabilities, such as authentication and session management issues, insecure configurations, and application-logic and business-workflow issues.
  3. Testing Phase:some text
    • SAST is typically performed early in the software development lifecycle (SDLC), allowing developers to address security issues before the application is deployed.
    • DAST is often conducted later in the SDLC, after the application has been built and running, providing a more realistic assessment of the application's security posture in a production-like environment.
  4. False Positives and False Negatives:some text
    • SAST tools may produce false positives (identifying issues that are not actual vulnerabilities) or false negatives (missing real vulnerabilities) due to the inherent limitations of static code analysis.
    • DAST tools have a lower risk of false positives because they simulate real-world attacks, but they may miss vulnerabilities that require specific user interactions or environmental conditions.

While SAST and DAST have distinct focuses, they are often used in combination to provide a comprehensive and multi-layered approach to application security testing. By leveraging the strengths of both techniques, organizations can achieve a more thorough and effective security assessment, identifying a broader range of vulnerabilities throughout the software development lifecycle.

It is important to note that neither SAST nor DAST is a complete solution on its own, but organizations should consider both as part of a robust and comprehensive application security strategy.

Why You Need Both SAST and DAST

SAST and DAST aren’t competing tools. They’re complementary.

SAST gives you early visibility into code-level issues. DAST shows how your application behaves in the real world. When used together, they provide a much more complete security picture.

For even stronger coverage, many teams also incorporate:

Manual penetration testingThe goal isn’t to rely on one tool. It’s to build layered security into your development process.

Shift Security Left and Scale Faster with Harness SAST

SAST is no longer a “nice-to-have.” It’s a critical part of building secure, high-quality software at scale. By catching vulnerabilities early in the development lifecycle, teams can reduce risk, avoid costly fixes, and keep delivery moving without unnecessary friction.

But the real advantage comes when SAST isn’t treated as a standalone tool. When it’s fully integrated into your CI/CD pipeline, security becomes seamless, happening automatically with every commit, build, and deployment.

That’s where Harness comes in.

With Harness, teams can embed SAST directly into their delivery workflows, automate security checks, and get real-time feedback without slowing down developers. Instead of juggling disconnected tools, you get a unified platform that helps you scale both speed and security.

If you’re looking to build more secure applications without sacrificing velocity, it’s time to make SAST a core part of your pipeline, and Harness makes that easier than ever. Sign up for a SAST demo today and see it for yourself.

Static Application Security Testing (SAST) is a type of security testing that analyzes the source code, bytecode, or compiled version of an application to identify potential security vulnerabilities and coding flaws. Unlike dynamic testing, which involves running the application and observing its behavior, SAST examines the code itself without executing it.

SAST tools employ various techniques, such as data flow analysis, control flow analysis, and pattern matching, to scan the codebase for known vulnerabilities, coding errors, and insecure coding practices. These tools can detect a wide range of security issues, including input validation errors, cross-site scripting (XSS) vulnerabilities, SQL injection flaws, buffer overflows, and more.

While SAST is a powerful security testing technique, it is often complemented by other testing methods, such as dynamic application security testing (DAST) and interactive application security testing (IAST), to provide a comprehensive security assessment of the application. Additionally, SAST tools may produce false positives or miss certain types of vulnerabilities, necessitating human review and validation by security experts.

Why is Static Application Security Testing (SAST) important?

Static Application Security Testing (SAST) is an essential practice in modern software development because it addresses security issues at the earliest stage. By analyzing the application's code without executing it, SAST tools can identify potential vulnerabilities and coding flaws that could lead to security breaches if left unaddressed. The importance of SAST lies in its ability to catch security issues early, enabling developers to fix them before the application is deployed, ultimately reducing the risk of costly and disruptive incidents.

Moreover, SAST plays a crucial role in promoting secure coding practices and fostering a security-conscious mindset among developers. By providing detailed feedback on coding errors and insecure practices, SAST empowers developers to write more secure and robust code from the outset. This proactive approach to security not only strengthens the overall application security posture but also contributes to a more efficient and cost-effective software development lifecycle.

Another significant advantage of SAST is its comprehensive coverage and scalability. SAST tools can analyze complex codebases, including intricate code paths and corner cases that might be challenging to identify through manual code reviews or dynamic testing alone. This thorough analysis ensures that even the most obscure vulnerabilities are detected, reducing the risk of overlooking critical security flaws.

SAST also plays a pivotal role in helping organizations meet regulatory requirements and industry standards related to secure coding practices and application security. By incorporating SAST into their software development processes, organizations can demonstrate their commitment to security and compliance, fostering trust among customers, partners, and stakeholders.

While SAST is not a panacea for all security concerns, it serves as a crucial foundation for a comprehensive and robust application security strategy. When combined with other testing techniques, such as dynamic application security testing (DAST) and interactive application security testing (IAST), SAST provides a multi-layered approach to identifying and mitigating security risks throughout the software development lifecycle.

Benefits of Static Application Security Testing (SAST) 

Static Application Security Testing (SAST) offers numerous benefits that make it an invaluable component of a robust application security strategy. Here are some of the key advantages of incorporating SAST into your software development lifecycle:

Early Detection of Vulnerabilities: One of the primary benefits of SAST is its ability to identify security vulnerabilities and coding flaws at the earliest stages of development. By analyzing the source code before it is compiled or deployed, SAST allows developers to address potential security issues proactively, reducing the risk of costly and disruptive incidents later in the process.

Cost-Effective and Efficient: Fixing security vulnerabilities during the development phase is typically more cost-effective than addressing them after deployment or in production environments. SAST enables organizations to save time and resources by catching and remediating issues early, leading to more efficient development cycles and reduced overall security costs.

Comprehensive Code Coverage: SAST tools are designed to analyze the entire codebase, including complex code paths and corner cases that might be difficult to uncover through manual code reviews or dynamic testing alone. This comprehensive coverage ensures that even the most obscure vulnerabilities are detected, reducing the risk of overlooked security flaws.

Scalability and Automation: SAST tools can handle large and complex codebases, making them suitable for organizations with extensive software portfolios. Additionally, SAST can be integrated into the development pipeline, enabling automated and continuous security testing, which further enhances efficiency and consistency.

Compliance and Security Standards: By incorporating SAST into their software development processes, organizations can demonstrate their commitment to secure coding practices and compliance with industry standards and regulatory requirements. SAST helps ensure that applications meet security benchmarks and guidelines, fostering trust among customers, partners, and stakeholders.

Developer Education and Awareness: SAST tools provide detailed feedback on coding errors and insecure practices, enabling developers to learn and improve their coding skills. This continuous learning process promotes a security-conscious mindset among developers, leading to more secure and robust code from the outset.

How is SAST different from DAST?

Static Application Security Testing (SAST) and Dynamic Application Security Testing (DAST) are two distinct approaches to identifying security vulnerabilities in software applications, each with its own strengths and focus areas. While SAST analyzes the application's source code or compiled binaries without executing it, DAST examines the running application's behavior and interactions during runtime.

The primary difference between SAST and DAST lies in their respective methodologies and the types of vulnerabilities they are designed to detect:

  1. Analysis Approach:some text
    • SAST: Analyzes the application's source code, bytecode, or compiled version using techniques such as data flow analysis, control flow analysis, and pattern matching.
    • DAST: Interacts with the running application by simulating real-world attacks and user behavior, and observes the application's responses.
  2. Vulnerability Identification:some text
    • SAST excels at identifying vulnerabilities related to coding flaws, insecure coding practices, and issues that can be detected through static code analysis, such as input validation errors, cross-site scripting (XSS), SQL injection, and buffer overflows.
    • DAST is better suited for identifying vulnerabilities that manifest during runtime, such as authentication and session management issues, insecure configurations, and vulnerabilities related to application logic and business workflows.
  3. Testing Phase:some text
    • SAST is typically performed early in the software development lifecycle (SDLC), allowing developers to address security issues before the application is deployed.
    • DAST is often conducted later in the SDLC, after the application has been built and deployed, providing a more realistic assessment of the application's security posture in a production-like environment.
  4. False Positives and False Negatives:some text
    • SAST tools may produce false positives (identifying issues that are not actual vulnerabilities) or false negatives (missing real vulnerabilities) due to the inherent limitations of static code analysis.
    • DAST tools have a lower risk of false positives because they simulate real-world attacks, but they may miss vulnerabilities that require specific user interactions or environmental conditions.

While SAST and DAST have distinct focuses, they are often used in combination to provide a comprehensive and multi-layered approach to application security testing. By leveraging the strengths of both techniques, organizations can achieve a more thorough and effective security assessment, identifying a broader range of vulnerabilities throughout the software development lifecycle.

Runtime Protection Agent
What is Static Application Security Testing (SAST)?

How to Integrate OpenTofu with Your CI/CD Pipeline for Scalable Deployments

Standardizing OpenTofu CI/CD integration with reusable templates and GitOps workflows eliminates deployment bottlenecks and accelerates infrastructure automation at scale. Centralized governance, policy-as-code, and AI-powered verification are essential for maintaining security, compliance, and operational efficiency across hundreds of services. Harness Continuous Delivery & GitOps provides an enterprise control plane that unifies visibility, governance, and automated rollbacks, enabling teams to scale OpenTofu deployments safely and efficiently.

8 min read

AI coding assistants have dramatically accelerated development velocity, but most teams still create bespoke deployment pipelines for each new service. This mismatch creates a dangerous bottleneck where infrastructure changes pile up behind manual approvals and custom pipeline scripts. Deployment bottlenecks worsen with each new service across hundreds of microservices.

The solution lies in standardizing OpenTofu pipelines integrated with continuous integration and continuous delivery (CI/CD) with reusable templates and GitOps workflows. You can achieve compliant, streamlined deployments without rebuilding pipelines from scratch for every service. This guide provides a reference architecture, a practical 7-step checklist, security guardrails for regulated environments, and answers to the most common implementation challenges about operationalizing infrastructure as code at scale.

Transform your deployment process and accelerate your infrastructure automation with Harness, featuring AI-powered pipeline generation, centralized GitOps management, and policy-driven governance.

OpenTofu CI/CD Integration Architecture That Scales

Managing OpenTofu across hundreds of microservices creates operational bottlenecks that manual processes can't solve. When you integrate OpenTofu into enterprise-scale CI/CD pipelines, the architecture decisions you make today determine whether you'll manage infrastructure changes smoothly or face operational complexity that constrains delivery speed.

Adopt a GitOps-First Model for Consistent, Auditable Deployments

When you integrate OpenTofu with CI/CD pipelines, position OpenTofu as the infrastructure provisioning layer within your broader GitOps workflow. Use your version control system as the single source of truth, triggering the tofu plan on pull requests and tofu apply only after merge approval. 

Configure environment variables like TF_IN_AUTOMATION=true to optimize CLI output for automated parsing. Your CD engine then handles progressive delivery patterns and application deployments, while OpenTofu handles infrastructure provisioning. This separation ensures infrastructure changes follow the same review processes as application code, creating an immutable audit trail for compliance.

Design for Multi-Tenancy and Isolation at Scale

Separate state backends by environment and service boundaries to prevent cross-team conflicts and meet regulatory requirements. Use dedicated S3 buckets with DynamoDB locking per environment, and configure workspace selection via TF_WORKSPACE environment variables in your pipelines. 

Implement policy gates using OPA with specific rules for financial services: enforce encryption-at-rest, validate CIDR allowlists, require specific resource tagging, and block non-compliant IAM permissions. Apply these policy checks between plan and apply phases to catch violations before they reach production, ensuring teams move independently while maintaining security boundaries.

Control Argo Sprawl With an Enterprise Control Plane

Rather than managing dozens of individual Argo CD instances, implement Harness GitOps as an enterprise control plane that provides centralized visibility and orchestration. Keep Argo CD handling the sync operations, it excels at. Meanwhile, Harness coordinates release orchestration, enforces Policy as Code governance, and provides AI-powered verification with automated rollback capabilities. 

This architecture eliminates the operational overhead of managing multiple GitOps controllers while giving you a single pane of glass for monitoring deployments across all environments and services.

A 7-Step Checklist To Wire OpenTofu Into Existing Pipelines

Moving from ad-hoc OpenTofu runs to production-ready automation requires standardizing your OpenTofu pipeline steps around a proven workflow. This 7-step checklist transforms the core Write-Plan-Apply cycle into a scalable, governed process that works across hundreds of services.

  • Template your infrastructure pipeline jobs for the OpenTofu workflow - Create reusable pipeline templates that codify tofu init, tofu validate, and tofu plan stages with standardized flags like -input=false and -compact-warnings for consistent, non-interactive execution. Use a control layer like Harness Infrastructure as Code Management.
  • Persist plan artifacts between stages - Save plan output files and JSON summaries to enable plan review in pull requests and ensure the same planned changes get applied, preventing inconsistencies that occur when plans are regenerated between stages.
  • Insert policy gates before apply - Add OPA policy checks and security scans between plan and apply stages to automatically block non-compliant changes rather than relying on manual reviews that slow teams down.
  • Require approvals for production applies - Configure manual approval gates with integrations to Jira or ServiceNow for production environments, while allowing automated applies in development to maintain velocity.
  • Centralize state and secrets management - Use remote backends with encryption and configure runtime secret injection via vault systems or managed identities to eliminate sensitive data from pipeline variables and OpenTofu code.
  • Implement automated rollback triggers - Pair OpenTofu applies with AI-powered verification that monitors metrics and logs post-deployment, automatically rolling back infrastructure changes when anomalies are detected.
  • Add continuous drift detection - Schedule regular plan runs against your live infrastructure to catch configuration drift early and trigger remediation workflows before manual changes create larger configuration inconsistencies.

Security, Compliance, and Policy as Code For Regulated Teams

Securing OpenTofu in CI/CD starts with applying zero-trust principles to secrets management. Never embed cloud credentials in pipeline variables or commit them to IaC repositories. Instead, integrate with central secret managers to generate short-lived tokens that expire within hours. 

This approach reduces your exposure window when credentials are compromised and aligns with OWASP CI/CD security recommendations for zero-trust pipeline architecture.

Beyond secrets management, policy enforcement becomes manageable at scale when you codify at least 14 baseline OPA policies covering naming conventions, resource tagging, CIDR allowlists, encryption requirements, and IAM boundaries. 

Instead of maintaining bespoke policies per service, centralize policy management through Harness Policy as Code to propagate updates across all pipelines automatically. This ensures your secure OpenTofu CI/CD workflows maintain consistent guardrails without manual intervention across hundreds of services.

Compliance becomes automatic when your pipelines generate immutable audit trails by default. Capture evidence for every approval, maintain detailed logs of who changed what and when, and standardize change windows across services to meet regulatory requirements. 

Harness Continuous Delivery provides audit trails that store up to two years of change history, while deployment freeze capabilities block changes during compliance windows, turning compliance from a manual burden into an automated advantage.

OpenTofu CI/CD: FAQs For Enterprise Delivery

Enterprise teams managing hundreds of microservices often struggle with pipeline proliferation and Argo sprawl when scaling OpenTofu deployments. The questions below address the most common integration patterns, security controls, and automation strategies that help platform engineering teams maintain governance without slowing development velocity.

How do you integrate OpenTofu with existing CI tools like GitHub Actions, Jenkins, or GitLab CI for enterprise scale?

Start with standardized pipeline templates that include tofu init, tofu plan, and approval gates before tofu apply. Use remote state backends with locking and store credentials in your CI platform's secret management. Create reusable workflow components for validation, security scanning, and plan output formatting. GitLab's official integration guide provides concrete implementation examples.

What are best practices for securing state, secrets, and approvals in regulated industries?

Enable state encryption with KMS providers and never store state locally in CI environments. Use ephemeral credentials with short-lived tokens and implement policy-as-code with OPA to enforce compliance rules. Require human approvals for production changes and maintain audit trails for all state modifications and access attempts.

How do you handle drift detection and remediation across multiple environments?

Configure automated drift detection pipelines that execute the tofu plan to detect configuration drift without applying changes. These OpenTofu CI/CD best practices help maintain infrastructure consistency while enhancing existing GitOps investments. Use centralized visibility to identify drift patterns and automatically create pull requests with required corrections when deviations are detected.

What's the best way to manage OpenTofu modules and dependencies at enterprise scale?

Create a centralized module registry using tools like Terraform Registry or private registries with semantic versioning and automated testing for shared infrastructure components. Use flexible templates that allow teams to specify module versions while enforcing organizational standards. Implement dependency management processes that automatically propagate security updates and policy changes across all consuming services.

From Prototype to Scale: Operationalize OpenTofu With Harness

Moving from prototype OpenTofu deployments to enterprise-grade infrastructure requires more than just CI/CD integration. You need central templates, OPA policy enforcement, and AI-powered verification that automatically detects regressions and triggers rollbacks. This combination of templates, policies, and AI verification transforms OpenTofu into a governed, scalable platform.

The path forward starts with a focused pilot across seven services over 14 days. This validates your golden-path templates, tests developer experience with GitOps workflows, and measures time-to-recover with automated rollback capabilities. This GitOps-driven approach to harnessing CD GitOps for OpenTofu enables you to prove the model before broader rollout across hundreds of services.

Ready to accelerate your OpenTofu adoption with enterprise-grade governance and AI-powered safety nets? Harness provides the control plane you need to scale OpenTofu deployments while maintaining compliance and reducing operational toil. Sign up for your continuous delivery & GitOps demo today!

Software Delivery Agent
How to Integrate OpenTofu with Your CI/CD Pipeline for Scalable Deployments

Artifact Registry Developer Experience: The Complete Guide

This guide explores how modern Artifact Registries like Harness AR enhance developer productivity by streamlining artifact management, accelerating CI/CD pipelines, and strengthening software supply chain security. Learn practical strategies to optimize your development workflow with efficient binary repository management.

8 min read

Why does Artifact Registry developer experience matter when a single missing dependency can cascade into hours of blocked builds across twenty teams?

Last Tuesday at 2 PM, your CI pipeline pulled a Python package from PyPI. This morning at 9 AM, that exact same package version disappeared from the upstream registry. Your build now fails. Your team scrambles. Your release date slips. This scenario plays out daily in engineering organizations that treat artifact management as an afterthought rather than a foundational pillar of DevOps developer productivity.

Artifacts—the versioned, immutable outputs of your CI/CD pipelines including container images, application binaries, libraries, Helm charts, and configuration files—are the building blocks of modern software delivery. When these artifacts become unavailable or unreliable, the entire development workflow grinds to a halt.

The problem extends beyond availability. Without proper artifact versioning best practices, teams cannot reproduce builds from six months ago. Without container registry performance optimization, developers wait minutes for layers that should take seconds. Without CI/CD artifact management guardrails, anyone can publish anything, introducing supply chain risks that security teams discover only after production deployment.

Developer experience suffers most when artifact workflows create friction at every step: publishing requires manual approval processes, consuming means navigating inconsistent package formats across different repositories, and debugging dependency issues becomes archaeological work through scattered logs and undocumented version changes.

The Real Cost of Poor Artifact Management

Consider a typical mid-sized engineering team:

  • 150 developers across 8 teams
  • 300 microservices deployed daily
  • 1,200 builds executed per day
  • 5 different artifact types (containers, npm, Maven, Python, Helm)

If each developer loses just 15 minutes daily to artifact-related friction:

  • 37.5 hours lost per day across the team
  • 187.5 hours lost per week
  • 9,750 hours lost annually (equivalent to 5 full-time engineers)

At an average engineering cost of $150/hour, that's $1.46 million annually in lost productivity. And this doesn't account for delayed releases, security incidents, or infrastructure waste.

Why Artifact Management Directly Shapes Developer Productivity

Artifact management in DevOps is the practice of systematically storing, versioning, securing, and distributing software artifacts across the entire software delivery pipeline. It ensures that the same tested artifact moves through development, staging, and production environments without modification, enabling reproducible builds and reliable deployments.

Traditional binary repository management approaches assume artifacts are commodities. Store them. Retrieve them. Move on. This model collapses under modern development velocity where a single application might consume hundreds of dependencies from dozens of sources, rebuild multiple times daily, and deploy across hybrid cloud environments.

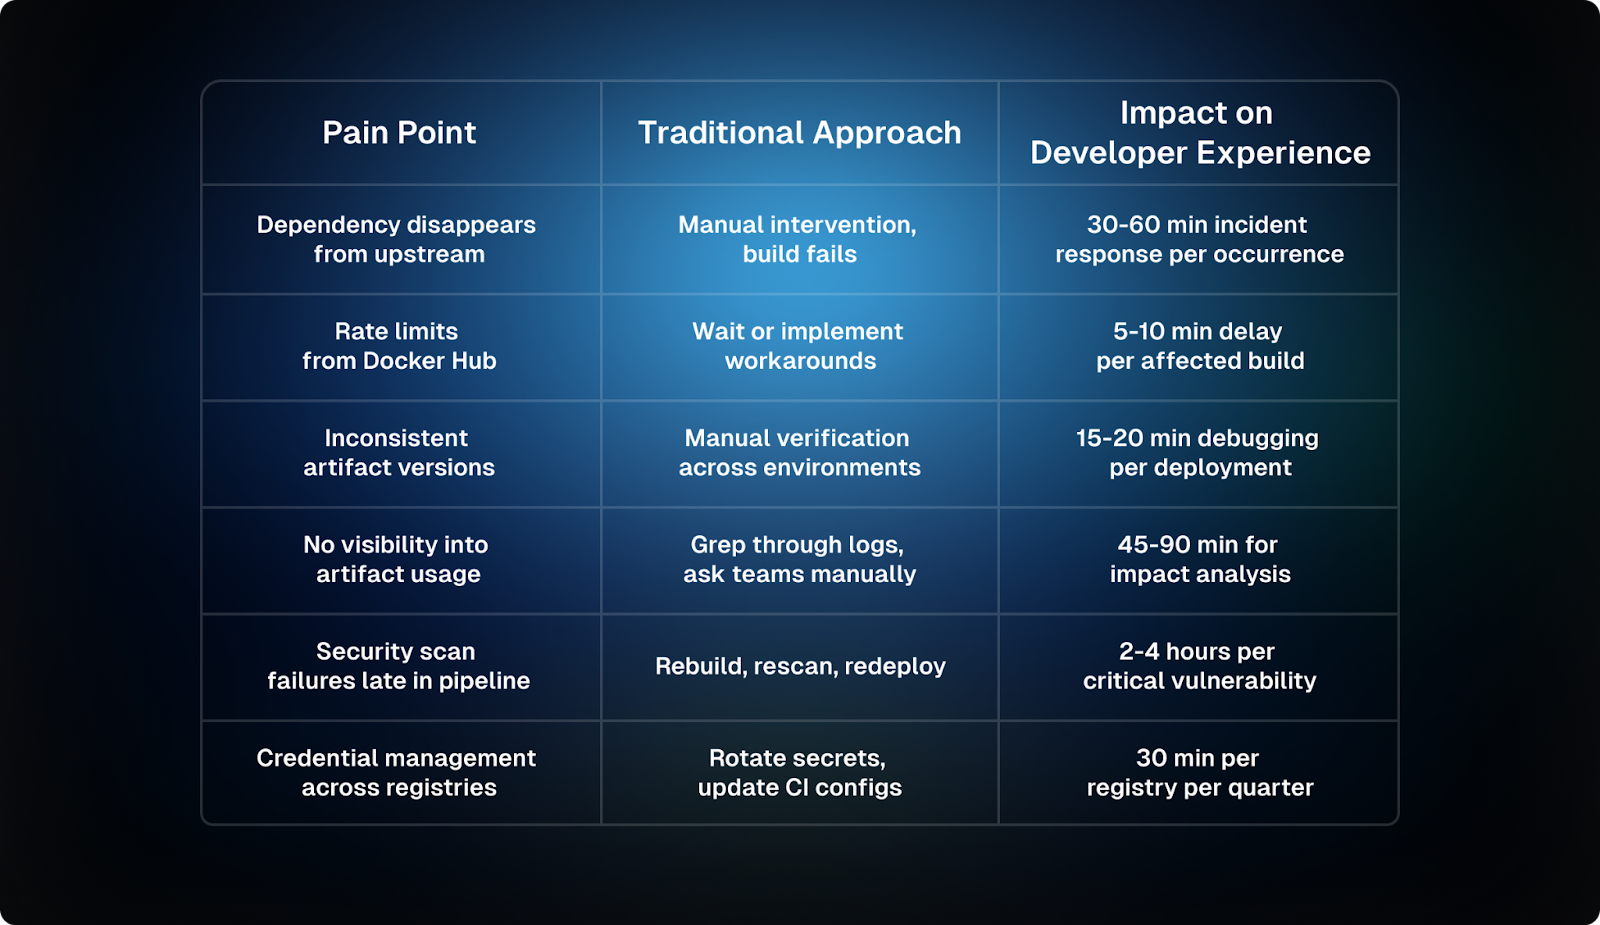
Developers lose time to predictable friction points. Builds fail because upstream registries rate-limit requests during peak hours. Deployments break because someone accidentally overwrote an artifact tag. Security scans block releases because nobody enforced immutability rules earlier in the pipeline. Each friction point compounds. A three-minute delay per build becomes thirty minutes daily when multiplied across a team. That scales to hours monthly, days annually.

The cognitive load matters as much as the time cost. When developers cannot trust that artifact dependencies remain stable, they build workarounds: local caches that drift from production, manual verification steps that slow automation, shadow repositories that bypass governance. These workarounds create technical debt that platform teams inherit.

Common Developer Pain Points

The Hidden Costs of Fragmented Artifact Registry Developer Experience

Software supply chain security begins at artifact ingestion, not during deployment scanning. Every external dependency represents a potential compromise vector. Without unified visibility across all artifact sources, security teams cannot answer basic questions: which teams consume this library, which versions exist in production, when did this artifact first appear in our systems.

Fragmentation creates operational blind spots. Development teams pull containers from Docker Hub. Data science teams install packages from PyPI. Infrastructure teams consume Terraform modules from GitHub. Platform teams manage Helm charts in separate registries. Each silo requires different access patterns, monitoring configurations, and compliance controls. The artifact management platform becomes fifteen disconnected tools rather than one cohesive system.

Performance degradation follows fragmentation. Developers in distributed teams pull the same multi-gigabyte container layers repeatedly because no caching layer exists between remote workers and upstream registries. CI runners download identical Maven artifacts hundreds of times daily because build isolation prevents cache sharing. These inefficiencies compound at scale, translating to measurable infrastructure costs and developer frustration.

The Infrastructure Cost of Fragmentation

Real-world example: A company with 500 daily builds pulling a 2GB base image:

This doesn't include:

  • Reduced build times (faster developer feedback)
  • Lower CI runner costs (less compute time)
  • Decreased storage costs (layer deduplication)

The Security and Governance Gap

Beyond performance and cost, fragmented artifact management creates serious security vulnerabilities:

"One of the most overlooked aspects of DevSecOps is ensuring that artifact storage itself remains tamper-proof. When artifacts are stored insecurely or exposed to unauthorized access, various risks arise: supply chain attacks, data exfiltration, regulatory and compliance issues, and operational disruptions."
Secure Artifact Storage Practices

The stakes are real:

Supply Chain Attacks: Attackers inject malicious code into legitimate artifacts within the registry, compromising downstream software components. The SolarWinds breach demonstrated how a single compromised artifact can cascade across thousands of organizations.

Regulatory Consequences: Organizations bound by HIPAA, PCI-DSS, SOC 2, or GDPR must protect artifacts containing sensitive data. A breach leads to legal consequences, financial penalties, and reputational damage.

Operational Disruptions: Even minor registry compromises or service downtime significantly disrupt CI/CD pipelines, hampering release cycles and impacting business continuity.

What Modern Artifact Management Requires

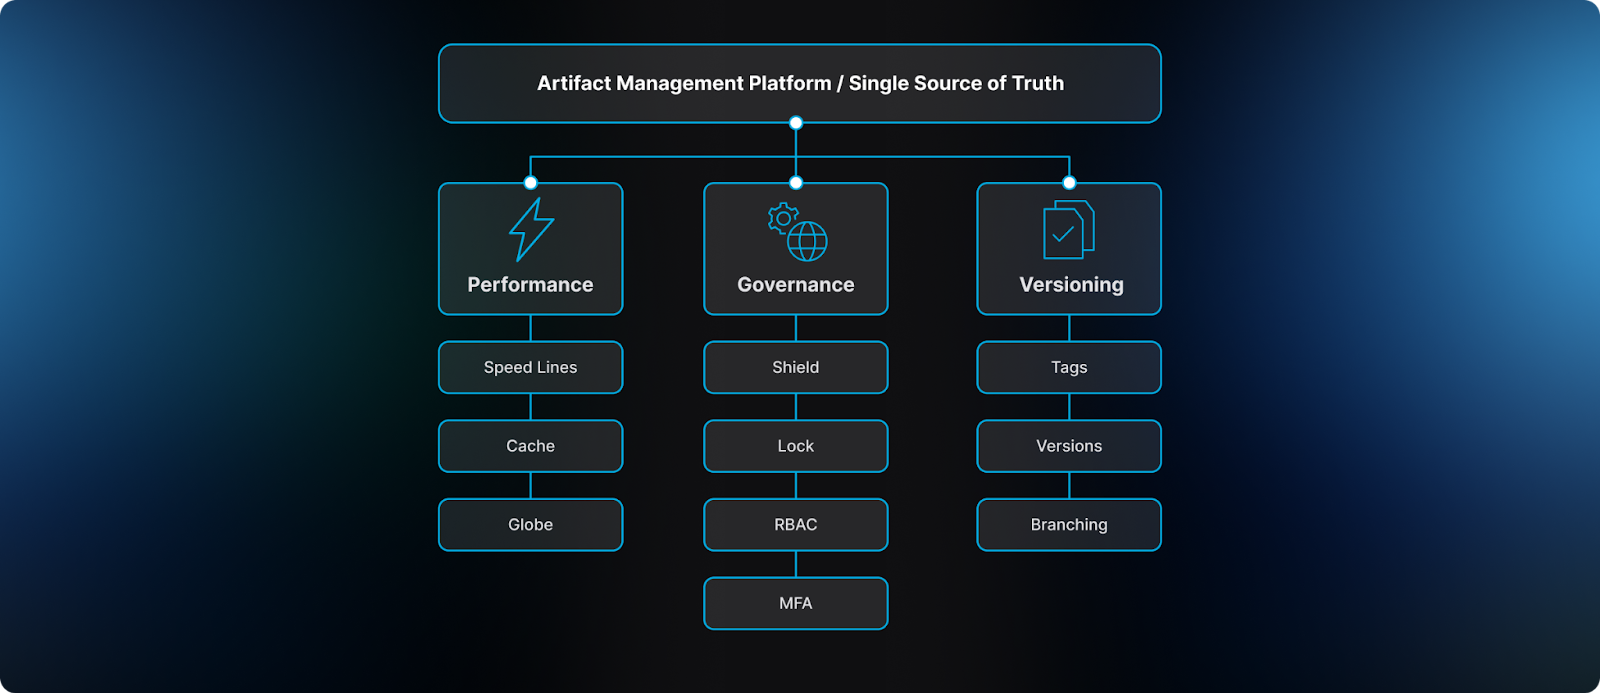
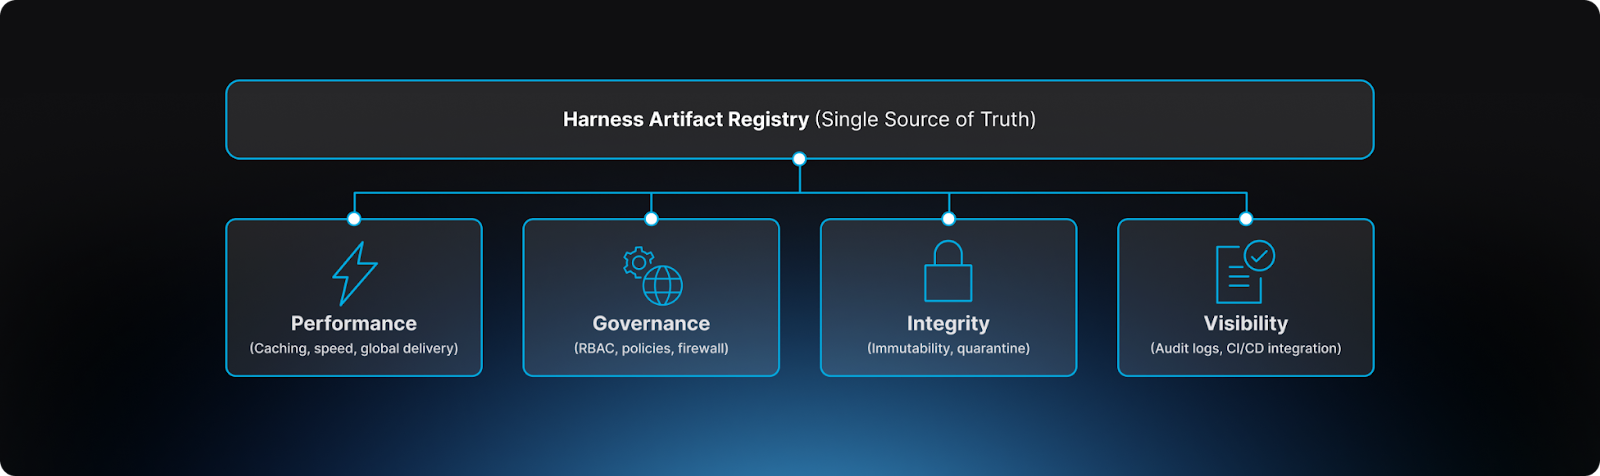
To solve these challenges, organizations need artifact management platforms—centralized systems that store, organize, and distribute software artifacts throughout the development lifecycle. These platforms act as a single source of truth for all build outputs, providing version control, access management, and security scanning for artifacts before they reach production.

Modern artifact management systems must provide:

1. High-Performance Artifact Operations

Container registry performance determines whether developers iterate quickly or wait. Layer caching strategies matter more than raw storage throughput. A well-designed Artifact Registry should deliver:

  • Fast container layer pulls (seconds, not minutes)
  • Efficient dependency resolution for Maven, npm, and Python packages
  • Intelligent caching that reduces network costs
  • Geographic distribution for global teams

2. Automated Governance Without Friction

Industry best practices recommend a "defense-in-depth" strategy, incorporating multiple layers of security controls:

Access Control and Authentication

"Access control is the cornerstone of secure artifact storage. Organizations should implement Role-Based Access Control (RBAC), mapping each user or service account to the minimal privileges required for their roles."
Secure Artifact Storage Practices

Key principles:

  • Least Privilege: Grant only minimal necessary permissions
  • Federated Identity: Leverage existing identity providers (LDAP, Active Directory, SSO)
  • Multi-Factor Authentication (MFA): Required for accessing critical artifacts
  • Token Rotation: Short-lived tokens reduce the window for credential exploitation

Immutability and Artifact Integrity

Immutable artifacts prevent the category of bugs where "it worked yesterday" becomes an unsolvable mystery because someone silently updated a production artifact. Once published, artifacts should never change.

Encryption at Rest and in Transit

"Organizations should ensure that data remains encrypted not only when it is stored (encryption at rest) but also while it traverses networks (encryption in transit)."
Secure Artifact Storage Practices

  • TLS/SSL for data in transit: Protects against eavesdropping and tampering
  • Encryption at rest: Stores artifacts on encrypted volumes
  • Key management: Secure vaults, periodic rotation, limited access

Proactive Vulnerability Scanning

Security scans should happen before artifacts enter pipelines, not after they're already cached and consumed by builds.

3. Disciplined Artifact Versioning

Semantic versioning provides structure, but real-world artifact versioning requires additional discipline. Version management complexity grows with organization size. Microservices architectures generate hundreds of artifacts daily. Monorepo strategies create interdependencies between artifact versions. Without systematic artifact versioning best practices, teams lose the ability to reason about which artifact versions are compatible, which are production-eligible, and which should be deprecated.

How Harness Artifact Registry Delivers Complete Developer Experience

Harness Artifact Registry addresses every challenge discussed above through a unified platform designed to centralize artifact storage, enforce governance, and secure the software supply chain across engineering teams.

Unified Platform: One Registry for All Artifact Types

While organizations traditionally use various tools for artifact management—including JFrog Artifactory, Sonatype Nexus, AWS ECR, Google Artifact Registry, and Azure Container Registry—these solutions often require multiple separate registries for different artifact types or lack advanced security features like dependency firewall and automated quarantine.

Harness AR provides unified artifact management across:

  • Container images (Docker, OCI-compliant)
  • Helm charts for Kubernetes deployments
  • Maven artifacts for Java applications
  • npm packages for JavaScript projects
  • Python packages (PyPI)
  • Generic binaries and files

One platform. One authentication model. One security policy engine. One audit trail. This eliminates the complexity of managing multiple disconnected tools while providing enterprise-grade security and governance.

Performance: Intelligent Caching and Upstream Proxying

The platform's upstream proxy support solves the external dependency problem directly. When developers request a package from PyPI or npm, Harness AR caches it locally while maintaining the original metadata. This caching layer:

  • Protects against upstream availability issues
  • Eliminates Docker Hub rate limits
  • Reduces network costs by 95%+
  • Provides audit trail for all external dependencies
  • Scans dependencies before they enter your environment
  • Accelerates build times through intelligent caching
  • Enables artifact lineage tracking for supply chain security

Platform teams gain visibility into all external dependencies without forcing developers to change their workflow.

Governance: Registry-Native Controls That Enable Velocity

Harness Artifact Registry transforms governance from a bottleneck into an enabler through registry-native controls that enforce policy at the artifact boundary—before dependencies enter builds, before vulnerable images reach production, before compliance violations propagate downstream.

1. Role-Based Access Control (RBAC)

Harness AR implements granular RBAC with three predefined roles:

Role
Permissions
Use Case
Registry Admin
Full access + user management
Platform teams managing registry infrastructure
Contributor
Push/pull access
Developers publishing and consuming artifacts
Viewer
Read-only access
Auditors, security teams, read-only CI jobs

This role-based approach enables developer workflow optimization by providing self-service capabilities while maintaining security boundaries.

2. Dependency Firewall: Blocking Risk at Ingest

"Rather than relying on downstream CI scans after a package has already entered a build, Dependency Firewall evaluates dependency requests in real time as artifacts enter the registry."
Harness Artifact Registry GA Announcement

When a developer or CI pipeline requests an external dependency (from npm, PyPI, Maven Central, Docker Hub), Harness AR:

  1. Intercepts the request at the registry boundary
  2. Evaluates against configured policies (CVEs, license violations, severity thresholds)
  3. Blocks or allows based on policy results
  4. Caches approved dependencies for future use
  5. Logs all decisions for audit trails

This shifts security left without adding friction—developers get immediate feedback, security teams get enforcement guarantees, and platform teams eliminate manual review bottlenecks.

3. Immutable Repositories: Preventing Artifact Tampering

Harness AR enforces immutability at the repository level. Once an artifact is published with a specific tag or version, it cannot be modified, overwritten, or deleted outside of defined retention policies.

Benefits:

  • Prevents accidental overwrites that break production
  • Ensures build reproducibility (same tag = same artifact forever)
  • Supports compliance requirements for artifact traceability

4. Artifact Quarantine: Automated Isolation and Remediation

When artifacts fail security or compliance checks, Harness automatically quarantines them:

"Artifact quarantine extends this model by automatically isolating artifacts that fail vulnerability or compliance checks. If an artifact does not meet defined policy requirements, it cannot be downloaded, promoted, or deployed until the issue is addressed."
Harness Artifact Registry GA Announcement

Benefits:

  • Unsafe artifacts cannot reach production
  • Developers get clear remediation guidance
  • Security team maintains oversight without manual gates
  • Complete audit trail for compliance

5. Comprehensive Auditing and Compliance

Harness AR provides complete audit trails for every artifact operation:

Audit log captures:

  • Who published which artifact, when, from which IP
  • Who downloaded which artifact, when, for which deployment
  • Which policies were evaluated, with what results
  • Which artifacts were quarantined, by whom, and why
  • Which exceptions were granted, with justification

Compliance support:

  • SOC 2: Complete audit trails, access controls, encryption
  • HIPAA: Data protection, access logging, retention policies
  • PCI-DSS: Secure artifact storage, vulnerability management
  • GDPR: Data encryption, access controls, audit trails

Native CI/CD Integration

Integration with CI/CD pipelines transforms Harness AR from a passive storage layer into an active participant in delivery workflows. Pipelines can publish artifacts to AR automatically after successful builds, consume artifacts as deployment inputs, and trigger downstream actions based on artifact availability. This integration pattern reduces manual coordination while maintaining the governance boundaries that platform teams require.

Conclusion: Artifact Management as a Competitive Advantage

Developer experience improves when infrastructure removes friction rather than adding process. Artifact Registries succeed when developers barely notice them: artifacts are always available, builds are consistently fast, dependencies are trustworthy, and workflows remain predictable. This invisibility requires deliberate platform engineering that prioritizes reliability, performance, and governance from the start.

The investment in proper binary repository management pays dividends across the development lifecycle. Faster builds mean faster feedback loops. Secure artifact pipelines mean fewer production incidents. Reproducible deployments mean confident releases. These benefits compound as teams scale, transforming artifact management from an operational cost center into a productivity multiplier.

Organizations that treat Artifact Registry developer experience as a strategic concern gain measurable advantages: reduced time to deployment, improved software supply chain security posture, lower infrastructure costs, and higher DevOps developer productivity. Those who treat it as a solved problem inherit the accumulated technical debt of fragmented tooling, manual processes, and preventable incidents. The choice determines whether artifact management enables velocity or constrains it.

Get Started with Harness Artifact Registry

Ready to transform your artifact management and reclaim $1.46 million in lost developer productivity?

Start your free trial: Get Started with Harness Artifact Registry

See it in action: Watch Demo

Talk to an expert: Schedule a Personalized Demo

Software Delivery Agent
Artifact Registry Developer Experience: The Complete Guide

What Is DevOps? Definition, Principles, Lifecycle & Benefits

The simple definition of DevOps is that it’s a cultural and professional movement, supported by practices and tools, that breaks down the traditional silos between software development and IT operations teams. The goal is to build, test, and release software faster and more reliably.

8 min read

DevOps is a cultural and technical approach to software delivery that unifies development and operations teams to ship software faster, more reliably, and with greater security. It combines automation, continuous integration and delivery (CI/CD), and shared ownership to improve both speed and stability.

Software powers nearly every modern business, but delivering it quickly, securely, and reliably is more complex than ever. As customer expectations rise and release cycles shrink, organizations can no longer afford siloed teams, slow deployments, or fragile infrastructure. That’s where DevOps comes in. 

DevOps represents a cultural and operational shift that brings development and operations teams together to accelerate delivery while maintaining stability and quality.

In this guide, we’ll break down what DevOps really means, how it works in practice, and why it has become essential for high-performing engineering teams. We’ll also explore how platforms like Harness help organizations implement DevOps principles through intelligent automation, streamlined CI/CD, and greater visibility across the software delivery lifecycle.

What is DevOps?

At its core, DevOps is a cultural and operational philosophy that unifies software development (Dev) and IT operations (Ops) teams to deliver software faster, more reliably, and with greater alignment to business goals.

Historically, development and operations worked in isolation:

  • Developers focused on building new features and pushing code changes.
  • Operations teams focused on stability, uptime, and infrastructure control.

These goals often conflicted. Developers wanted speed and innovation. Operations wanted control and risk reduction. The result? Delays, friction, and software that was difficult to maintain.

DevOps resolves this tension by aligning incentives, improving collaboration, and automating processes across the entire software lifecycle. Instead of handing off code between departments, DevOps promotes shared ownership, from planning all the way to production monitoring.

It’s not just about shipping faster. It’s about shipping better.

Why DevOps Emerged

To understand DevOps, you have to understand the problem it was designed to solve.

Traditional software delivery models relied on long release cycles. Teams would spend months developing features before deploying them all at once. This created several issues:

  • Large releases were risky and hard to roll back.
  • Communication breakdowns slowed progress.
  • Production failures were difficult to diagnose.
  • Customers waited too long for improvements.

As businesses became increasingly digital, this slow model became unsustainable. Companies needed to:

  • Respond to customer feedback faster
  • Deploy updates continuously
  • Maintain 24/7 reliability
  • Scale systems dynamically

DevOps emerged as a response to these pressures. It enabled organizations to move from “big batch releases” to continuous, incremental delivery, dramatically improving both speed and stability.

In short, DevOps evolved because the market demanded agility without sacrificing reliability.

The Core Principles of DevOps

DevOps is guided by foundational principles that shape how teams operate.

1. Culture Comes First

Before tools, before automation, before pipelines. DevOps begins with culture.

This means:

  • Shared accountability between development and operations
  • Transparency in processes and performance
  • Open communication across teams
  • A blameless approach to failure

When incidents occur, DevOps organizations focus on learning and system improvement rather than assigning blame. This creates psychological safety, which fosters innovation and experimentation.

Without cultural alignment, even the most advanced tools won’t deliver DevOps benefits.

2. Automation as a Force Multiplier

Manual processes introduce delays and errors. DevOps emphasizes automating repetitive tasks across the entire lifecycle:

Automation ensures consistency, repeatability, and speed. It allows teams to deploy changes frequently without increasing risk.

The goal is simple: remove friction so teams can focus on solving meaningful problems rather than managing manual steps.

3. Continuous Integration and Continuous Delivery (CI/CD)

CI/CD is one of the most recognizable aspects of DevOps.

In Continuous Integration (CI), developers frequently merge code changes into a shared repository, sometimes multiple times per day. Automated tests validate each change to prevent integration conflicts.

On the other hand, Continuous Delivery (CD) ensures that code changes can be automatically prepared for release at any time. Continuous Deployment goes one step further by automatically releasing validated changes to production.

Together, CI/CD creates a predictable, low-risk delivery pipeline that reduces bottlenecks and shortens feedback loops.

4. Measurement and Observability

DevOps teams rely heavily on metrics to guide decisions.

Key areas of measurement include:

Beyond metrics, observability tools help teams understand system behavior in real time. Logs, traces, and performance monitoring provide insights that help diagnose issues quickly.

In DevOps, feedback is constant and data drives improvement.

5. Shared Ownership and End-to-End Responsibility

In traditional models, developers “finished” their job once code was deployed. DevOps eliminates that boundary.

Teams are responsible for:

  • Designing features
  • Writing code
  • Deploying updates
  • Monitoring production
  • Responding to incidents

This end-to-end ownership improves quality because the same people who build the system must maintain it. When teams feel the operational impact of their design

 The DevOps Lifecycle

A modern lifecycle, which includes DevOps, isn't a linear process but an infinite loop, representing the continuous nature of software innovation. It consists of several key stages:

  1. Plan: Teams define features and capabilities for the upcoming release.
  2. Code: Developers write and commit code to a shared repository.
  3. Build: The code is compiled into a runnable artifact. This is the first step in Continuous Integration (CI).
  4. Test: Automated tests run against the build to check for bugs and performance issues.
  5. Release: If tests pass, the artifact is versioned and stored, ready for deployment.
  6. Deploy: The build is pushed to production environments. This is the heart of Continuous Deployment/Delivery (CD).
  7. Operate: The application is managed and maintained in production.
  8. Monitor: Teams watch application performance and user behavior, generating feedback that flows back into the "Plan" stage for the next iteration.

The engine driving this lifecycle is CI/CD. Continuous Integration is the practice of frequently merging all developer code into a central repository, after which automated builds and tests are run. 

Continuous Deployment takes this a step further, automatically deploying every change that passes the full test suite to production. These practices, enabled by strong feedback loops, ensure that what gets built is high-quality and ready for release at any time.

Benefits of Adopting DevOps

Moving to a DevOps model isn't just about changing how teams work; it's about driving tangible business outcomes.

  • Faster Delivery of Software Products: By automating the build, test, and deployment pipeline, teams can release features much more frequently. This improves time-to-market and allows the business to respond more quickly to customer needs.
  • Improved Collaboration Between Teams: When development and operations share ownership of the entire lifecycle, the "us vs. them" mentality disappears. Communication improves, and teams work together to solve problems instead of assigning blame. In some DevOps shops, Development and Operations cease to be separate functions and fold into product or “stream-aligned” teams, which both build and run their applications.

Enhanced Product Quality and Reliability: Integrating testing and monitoring throughout the lifecycle means bugs are caught earlier. Automated, repeatable deployment processes reduce the risk of human error, leading to more stable and reliable systems in production.

Traditional IT
DevOps
Siloed teams
Shared ownership
Infrequent releases
Continuous delivery
Manual processes
Automated pipelines
Reactive incident response
Observability & proactive monitoring

Challenges in Implementing DevOps

Adopting DevOps is a journey, and it comes with its share of hurdles. It's not as simple as buying a new tool.

  • Cultural Resistance: This is the biggest challenge. Changing ingrained habits and dismantling organizational silos requires strong leadership and buy-in from all levels. People are often resistant to changing the way they've always worked.
  • Integration with Legacy Systems: Many organizations aren't starting with a clean slate. Integrating modern DevOps practices and tools with brittle, legacy architectures can be incredibly complex.
  • Skill Gaps and Training: DevOps requires a broader skill set. Developers need to understand infrastructure, and operations engineers need to learn to code. This often requires significant investment in training and hiring.

Key DevOps Practices

While DevOps is cultural, it relies on practical techniques to succeed.

  • Infrastructure as Code (IaC): Infrastructure configurations are written and managed as code, which allows environments to be version-controlled, reproducible, and scalable.
  • Containerization and Orchestration: Containers bundle applications together with everything they need to run, so they work consistently across different environments. Orchestration tools then help manage those containers by handling scaling, availability, and system reliability automatically.
  • Shift-Left Testing: Testing begins earlier in the development cycle rather than waiting until the end. Early validation reduces costly rework and improves software quality.
  • Continuous Security Integration (DevSecOps): Security is embedded throughout the pipeline instead of added at the final stage. Automated vulnerability scanning and compliance checks help prevent risks before deployment.

DevOps vs. DevSecOps: What's the Difference?

DevSecOps is the logical evolution of DevOps. While DevOps broke down the wall between developers and operations, DevSecOps tears down the wall with security teams. 

The goal is to integrate security into every stage of the software lifecycle, a practice known as "shifting left." Instead of security being a final gate before release, it becomes an automated, continuous part of the development process.

In reality, modern DevOps already implies cross-functional collaboration across planning, building, testing, security, release, deployment, monitoring, and even cost optimization (FinOps). If we tried to name every discipline involved, we might end up with something like DevPlanBuildTestSecReleaseDeployMonitorFinOpsOps.

For simplicity, we continue to use “DevOps” as an umbrella term, but in practice, high-performing teams understand that security, compliance, and operational efficiency are all integral parts of the same continuous delivery ecosystem.

How Does DevOps Relate to Agile?

Agile and DevOps are two sides of the same coin. They are highly complementary and work best together.

Agile methodologies (like Scrum or Kanban) focus on the planning and development part of the cycle. They help teams break down large projects into smaller, manageable increments. Agile answers what to build and why.

DevOps provides the practices and automation to deliver the software that Agile teams produce. It's the engine that takes the small, iterative changes from Agile development and gets them to production quickly and reliably. DevOps answers how to deliver it.

DevOps Tools and Technologies

While DevOps is a cultural movement first, it's enabled by a robust ecosystem of tools. The goal of these tools is automation—to make the entire delivery workflow as seamless and efficient as possible.

Key tool categories include:

  • Source Code Management: Storing and versioning code (e.g., Git, GitHub, GitLab).
  • Build Automation: Compiling source code (e.g., Maven, Gradle).
  • Continuous Integration/Delivery Platforms: Orchestrating the entire CI/CD pipeline (e.g., Jenkins, Harness, CircleCI, GitLab). The Harness Software Delivery Platform, for example, unifies CI and CD with modules for feature flags, cloud cost management, and service reliability, providing an end-to-end solution.
  • Infrastructure as Code (IaC): Provisioning and managing infrastructure through code (e.g., Terraform, Ansible, Pulumi).
  • Monitoring & Observability: Tracking application performance and system health (e.g., Prometheus, Datadog, Splunk).

A successful DevOps toolchain involves integrating these tools to create a smooth, automated flow from code commit to production deployment.

The Future of DevOps

The DevOps movement continues to evolve. We're seeing several emerging trends that are shaping its future.

  • Platform Engineering: As DevOps practices mature, many organizations are building internal platforms to provide developers with a self-service, automated path to production. This abstracts away the complexity of the underlying toolchain.
  • The Impact of AI and Machine Learning: AI is being integrated into DevOps practices to make them smarter. This includes AI-powered test generation, intelligent canary deployments that automatically roll back on failure, and AIOps for predicting and preventing production incidents.‍
  • The Evolving Role of the DevOps Engineer: The idea of a single "DevOps engineer" is giving way to a more specialized landscape. Roles like Platform Engineer, Site Reliability Engineer (SRE), and Software Engineer with a focus on delivery are becoming more common as the practice matures. The focus remains on enabling developers to deliver value safely and quickly.

Frequently Asked Questions (FAQ)

What does DevOps actually mean?

DevOps is a cultural and operational approach that brings development and operations teams together to improve collaboration, automate workflows, and deliver software faster and more reliably.

Is DevOps a job title or a methodology?

DevOps is not a single role or tool. It’s a mindset and set of practices. While some organizations hire “DevOps Engineers,” the true goal of DevOps is shared ownership across teams rather than assigning responsibility to one person.

What are the key benefits of DevOps?

DevOps helps organizations increase deployment frequency, reduce change failure rates, improve recovery times, and enhance overall system stability, all while accelerating innovation and improving customer satisfaction.

How does DevOps differ from Agile?

Agile focuses primarily on iterative software development and collaboration within development teams, while DevOps extends those principles to include operations, infrastructure, deployment, and monitoring.

Do small teams need DevOps?

Yes. In fact, small teams often benefit the most from DevOps practices because automation and shared responsibility allow them to move quickly without sacrificing reliability.

What tools are required to implement DevOps?

There is no single required toolset. DevOps relies on automation tools for CI/CD, infrastructure management, monitoring, and collaboration, but the success of DevOps depends more on culture and process alignment than on any specific platform.

Ready to Modernize Your Software Delivery?

DevOps is no longer optional for organizations that want to compete in a digital-first world. It’s the foundation for faster innovation, stronger reliability, and continuous improvement. By breaking down silos, embedding automation across the lifecycle, and embracing shared ownership, teams can deliver high-quality software at the speed modern customers expect.

But cultural alignment alone isn’t enough. To truly operationalize DevOps at scale, teams need intelligent automation, end-to-end visibility, and built-in governance that reduces risk without slowing delivery. That’s where platforms like Harness make a measurable difference, helping organizations streamline CI/CD, strengthen security practices, and gain real-time insight into every stage of the software delivery lifecycle.

The future belongs to teams that can ship faster and operate smarter. With the right mindset and the right platform, DevOps becomes more than a practice. It becomes a strategic advantage.

Software Delivery Agent
What Is DevOps? Definition, Principles, Lifecycle & Benefits

What is a Blue Green Deployment?

Run two production-capable environments (blue live, green standby) so you can deploy and validate the new version without disrupting users. Treat release exposure as a controlled traffic-routing change (load balancer/ingress/service switch or DNS), which minimizes downtime and makes cutover predictable. Get a fast rollback path by switching traffic back to the previous environment—especially effective when paired with strong verification and data-safe migration practices.

8 min read

Modern software delivery is headed in one direction: ship more often without betting production on every release. Blue-green deployment supports that goal by keeping two production-capable environments, blue (live) and green (standby), so you can deploy to green, verify it under production-like conditions, then switch traffic in a controlled cutover.

When you pair blue-green with automation, releases become repeatable: pre-traffic checks, health and metric validation, and a clear rollback path if signals degrade. That’s where Harness CD fits; standardizing deployment workflows with built-in verification and rollback guardrails so teams can move fast without flying blind.

What is a Blue-Green Deployment?

A blue-green deployment is a way to make changes to an application by keeping two production-capable stacks and only sending traffic to one of them at a time.

Blue-green moves risk to places where you have more control:

  • Verification (automated tests + real signals)
  • Routing (a deliberate, auditable traffic shift)
  • Rollback (a well-practiced switch back)

That's why blue-green is often used with automation: the more consistent your verification and promotion steps are, the more predictable your releases will be. Organizations with less mature observability will also benefit from Blue-Green due to having the spare environment available. This allows for longer “testing in production” cycles and, should a customer-impacting incident occur, near-instantaneous rollback.

How Blue-Green Deployments Work

Blue-green has three phases:

  1. Deploy to green (without impacting users)
  2. Verify green (prove it’s ready for real traffic)
  3. Switch traffic (cut over from blue to green)

Let’s review the step-by-step process that production teams use.

Step 1: Keep Blue Serving Production

Your blue environment is stable and serving users. Before you touch anything, get a baseline.

Some useful baselines include:

  • Error rate and latency (p50/p95/p99)
  • Resource utilization (CPU, memory, saturation)
  • Key business metrics (if you have them): sign-ins, checkout success, API success rates

Baselines turn “does this look okay?” into “did we regress?” It’s a small discipline that saves time during every release.

Step 2: Deploy the New Version to Green

Deploy your new build (and any configuration changes) to the green environment. Your goal is parity.

Parity usually means:

  • Same infrastructure shape (or intentionally equivalent)
  • Same runtime configuration patterns
  • Same security settings and network policies
  • Same dependency endpoints and access

This is where consistent config management and Infrastructure as Code (IaC) really shine. If green is "almost" like blue, you'll be fixing environment drift instead of testing your app on release day.

Step 3: Verify the Green Environment

Verification is the difference between “blue-green reduces risk” and “blue-green ships outages faster.”

A practical verification set typically includes:

  • Smoke tests: Fast checks for critical paths (health endpoints, auth, core read/write flows).
  • Integration tests: Calls across services, databases, queues, storage, and external APIs.
  • Synthetic checks: Automated requests that mimic real user behavior.
  • Performance sanity checks: Not a full load test, but enough to catch obvious regressions.

​​As a general rule, if your verification wouldn't have caught the last few incidents you had, you shouldn't trust it until you make it better.

Step 4: Prepare for Cutover

Even a release passing tests can fail if it’s not ready to accept production traffic.

Pre-cutover tasks often include:

  • Get the application ready: Prime caches, initialize connection pools, reduce cold-start impact.
  • Readiness checks: Confirm the service can accept requests (not just “running”).
  • Dependency validation: Confirm green can reach the same downstream services as blue.
  • Feature flag posture: Decide what ships “off by default” and what’s safe to enable later.

This step is where teams remove surprises. The goal is to make cutover boring.

Step 5: Switch Traffic from Blue to Green

Traffic switching is usually done through one of these mechanisms:

  • Load balancer or ingress routing: Update target groups or routing rules to send requests to green.
  • Service discovery / routing layer: Switch which service instance is registered as active.
  • DNS change: Update a domain record to point to green.

In many modern environments, load balancer or ingress switching is preferred because it’s typically immediate and observable. DNS can work, but caching and propagation can create a mixed state that makes “instant cutover” and “instant rollback” less predictable.

Step 6: Monitor Closely and Keep Blue Available

After the cutover, treat the first window as a high-signal period.

Focus on:

  • Error rate, latency, saturation, and logs
  • Differences from your baseline
  • Any known high-risk workflows (e.g., checkout, auth, payments)

Many teams keep blue “warm” for a fixed period (30–60 minutes, a few hours, or a business day) before decommissioning. The point is not to run duplicates forever. It’s to keep a clean escape hatch until you’re confident.

Step 7: Decommission or Repurpose Blue

Once the release is stable:

  • Scale down the old environment, or
  • Repurpose it as the next green for the following release

The longer you wait to scale down or decommission your environment, the more costly the Blue-Green approach is. However, you maintain the instant rollback option longer. The better your observability and understanding of the dynamics of your application, the less costly this approach is. A common pattern is to switch colors every day: blue becomes green today, and green becomes blue tomorrow.

What You Need Before You Start

There isn't just one blue-green button. There are a few things that need to be in place for this strategy to work. Your releases will be faster and less stressful if you invest here.

Environment Parity

Your two environments should be functionally equivalent in the ways that matter:

  • Same network policies and access controls
  • Same secrets and configuration patterns
  • Same dependency endpoints
  • Same observability instrumentation

Parity does not always mean that the instance types or autoscaling settings are the same. It means that the environment acts the same way when it's in production.

Reliable Configuration Management

Blue-green often fails because configuration changes are treated like afterthoughts.

If you deploy to green but miss a critical environment variable, you might not notice until real users hit the new version.

Strong practices include:

  • Versioning config where possible
  • Using consistent config templates
  • Validating required variables at startup
  • Treating secrets as first-class deployment inputs

Strong Health Checks and Readiness Signals

A health check should let you know if an instance can handle traffic.

A lot of teams start with "/health returns 200 if the process is alive." That's a good start, but it doesn't protect cutovers.

A meaningful readiness check usually includes:

  • Ability to connect to critical dependencies
  • Ability to process a basic request path
  • Evidence initialization is complete (migrations, caches, config load)

Automated Testing and Verification

Blue-green makes it easier to test an environment that is similar to production, but it doesn't do the testing for you. While Blue-Green deployments are more compatible with manual testing techniques than an automated canary deployment, automated testing is better.

At minimum, you want automated checks that run every time you deploy to green. Over time, you’ll mature those checks into promotion gates based on metrics and error budgets.

A Rollback Plan That Includes Data

Rolling back traffic is easy. Rolling back data is not.

Before adopting blue-green, decide how you’ll handle:

  • Schema migrations
  • Backward compatibility
  • Data transformations

If your release requires a migration that the previous version can’t tolerate, switching traffic back may not restore functionality. Data safety is where most “instant rollback” stories fall apart. Database DevOps tools can help automate the schema migrations in a controlled fashion, but approaches like the Expand-Contract pattern can be appropriate for preserving instant rollback.

Benefits of a Blue-Green Deployment

When teams adopt blue-green intentionally, the benefits are practical and measurable.

Minimized Downtime

Because you set up the new environment before switching traffic, the only time you have to wait is for the routing change. Users don't see you "install" a new version; they just see the traffic change.

Reduced Deployment Risk

Blue-green separates deployment from exposure.

You can deploy the new version to green and check it without affecting users. This lowers the risk that a bad build will bring down production.

Fast Rollback

If something goes wrong right after cutover, you can usually fix it by sending traffic back to blue.

That speed is important. When problems are found early, it changes "major incident" to "short disruption." As one SRE Manager described it, “My CEO was next to me when an update brought our whole service down. He was shocked at how calm I was. Using Harness, we had everything back up in a couple of minutes. No harm done.” 

Cleaner Release Validation

Because green is production-capable, your validation is more realistic than a staging environment that doesn’t match production traffic patterns, scale, or dependency behavior. Your staging environment is your production environment.

Supports Continuous Delivery

Blue-green helps teams ship smaller changes more frequently because the mechanics of releasing become repeatable.

The goal isn’t “deploy faster at all costs.” It’s “deploy predictably and recover quickly.”

Better Control Over Capacity

You can scale green correctly before exposure. You can also use automation to ensure that routing changes occur only after readiness and verification pass.

Risks and Pitfalls of a Blue-Green Deployment

On paper, blue-green is easy. These are the real-world problems that cause most problems in production.

Database Migrations and Schema Compatibility

This is the most common stumbling block.

When blue and green both talk to the same database, that database is a shared dependency. There may be a time during the cutover when both versions are still in use (for example, because some traffic stays, connections drain slowly, or you keep blue online for rollback).

That means your database changes should usually be backward and forward compatible:

  • Backward compatible: The new schema still works with the old application version.
  • Forward compatible: The old schema changes don’t break the new application version.

Patterns teams rely on:

  • Expand/contract migrations: Add new columns first, deploy, migrate usage, then remove old columns later.
  • Avoid destructive changes during cutover: Delay dropping columns or constraints until you’re confident.
  • Backfills as async jobs: Keep the release path fast and safe.

If your change requires a hard break (removing a required field, changing semantics, rewriting data formats), plan a multi-step release instead of a single big switch.

Stateful Traffic, Sessions, and Caches

If your application stores session state in memory, switching environments can log users out or break workflows.

Mitigations include:

  • Store sessions in a shared external store (e.g., Redis, database)
  • Use stateless auth tokens when appropriate
  • Warm caches so users don’t take the hit right after cutover

Also, keep an eye on sticky sessions. If a load balancer keeps users on old targets, you could end up in a mixed-version state by accident.

DNS Propagation Delays

As caches expire (TTL), DNS changes are made. This means that cutover and rollback can happen slowly instead of all at once. Some users may hit blue while others hit green, which can cause a mixed cutover.

If you need tight control, you should route at the load balancer or ingress layer.

Environment Drift

If green isn’t equivalent to blue, you'll see problems that have nothing to do with your code:

  • Different network rules
  • Missing secrets
  • Different autoscaling behavior
  • Different dependency endpoints

This is why teams often pair blue-green with IaC and immutable infrastructure practices.

Cost and Capacity

It costs more to run two production environments.

Sometimes that’s a smart trade: the extra space is an investment in reliability. If it's a problem, think about:

  • Keeping green smaller until verification passes
  • Scaling up right before cutover
  • Using canary deployments when full parallel capacity isn’t feasible

“Green Passed Tests” Isn’t the Same as “Green Is Safe”

Tests are necessary, but production failures can involve traffic patterns, unusual inputs, or dependency behavior.

Treat tests as a gate, not a guarantee. Pair them with strong monitoring after cutover and a clear rollback plan.

Best Practices for Safe Cutovers

To make blue-green feel like a normal part of your routine, pay attention to the times when it is risky, like when you switch traffic or verify.

Use Progressive Exposure When You Can

Classic blue-green is a full cutover. Many teams use it with progressive rollout methods:

  • Start with internal users
  • Route a small percentage of traffic to green first
  • Increase gradually based on signals

If you can’t do progressive exposure, compensate with stronger pre-cutover verification and clearer rollback criteria.

Define Go/No-Go Criteria Before You Deploy

Don’t invent thresholds during an incident.

Examples:

  • Error rate must not exceed baseline by more than X%
  • p95 latency must stay under Y ms
  • No increase in critical error codes
  • Business flow success rate remains stable

Automate Verification and Keep It Consistent

If verification depends on manual checks or “someone’s gut feel,” it won’t scale.

Automate:

  • Smoke tests
  • Synthetic checks
  • Metric-based validations
  • Security/compliance gates where required

Make Rollback a Practiced Action

Rollback should not be a one-time plan for saving someone.

Practice it:

  • Rehearse rollback in non-production
  • Document what triggers it
  • Automate traffic reversion when possible

Keep Observability in the Workflow

“Deploy succeeded” is not the same as “release succeeded.”

Build post-cutover checks into your process:

  • Health/readiness confirmation
  • Metric checks after cutover
  • Log and trace sampling
  • Alerts aligned with go/no-go criteria

Plan Data Changes as Multi-Step Releases

If your application requires schema changes:

  • Prefer expand/contract
  • Keep both versions compatible during the cutover window
  • Run backfills separately

Think: deploy code, shift traffic, validate, then finalize cleanup.

Blue-Green vs. Rolling vs. Canary vs. Red/Black

Different strategies lower risk in different ways. Pick the method that works best with your routing skills, level of observability, and budget.

Blue-Green vs Rolling Deployments

In a rolling deployment, instances are updated in place, with older versions gradually replaced by newer ones.

  • Pros: Lower infrastructure cost; no parallel environment required.
  • Cons: Rollback can be slower because you may have a mixed fleet; debugging can be harder when multiple versions run at once.

Choose rolling when you want simplicity and lower cost.

Choose blue-green when you want a clean separation between versions and a fast, routing-based rollback.

Blue-Green vs Canary Deployments

A canary deployment routes a small percentage of traffic to the new version first, then increases exposure if metrics look good.

  • Pros: Smaller blast radius; catches issues before full rollout.
  • Cons: Requires strong observability and traffic management.

Choose canary when you can route by percentage or segment and you’re ready to promote based on metrics.

Choose blue-green when you prefer a straightforward “validate, then switch” model and can run parallel capacity.

Red/Black vs Blue/Green

“Red/black” is often used interchangeably with blue-green. In most contexts, it describes the same pattern: one environment is live, one is idle, and traffic is switched between them.

If a source uses red/black, treat it as a naming variant unless it defines a specific implementation detail.

Blue-Green Deployment in Kubernetes

Kubernetes can make blue-green simpler because traffic routing is a first-class concept through Services and Ingress. The key is deciding what “two environments” means for your setup.

Pattern 1: Two Deployments, One Service (Selector Switch)

  • Two Deployments (blue and green) with different labels
  • One Service
  • Switch traffic by updating the Service selector

Pros: Simple, fast, immediate cutover.

Cons: Requires care with readiness and connection draining. Label mistakes can drop traffic.

Pattern 2: Two Services, One Ingress (Route Switch)

  • Blue and green each have their own Service
  • Ingress (or gateway) routes to the active Service

Pros: Clear separation; supports advanced routing.

Cons: More objects to manage.

Pattern 3: Two Namespaces (Environment Isolation)

  • Namespace “blue” and namespace “green,” each with the full stack

Pros: Strong isolation; easier parity validation.

Cons: More overhead; shared dependencies still need careful planning.

Readiness, Liveness, and Pre-Traffic Validation

In Kubernetes, probes matter:

  • Liveness probe: Is the process alive?
  • Readiness probe: Is it safe to receive traffic?

A readiness gate determines whether the Service sends traffic to a Pod. If readiness flips to true before dependencies are available, your deployment can look healthy while cutover fails.

Helpful pre-traffic steps:

  • Run smoke tests against the green endpoint
  • Warm caches and connection pools
  • Validate config and secret injection

Connection Draining and Graceful Termination

To avoid dropping in-flight requests:

  • Set terminationGracePeriodSeconds appropriately
  • Ensure your load balancer respects readiness and removes targets cleanly
  • Implement graceful shutdown in the application

Automating Blue-Green in CI/CD Pipelines

Blue-green is most effective when it’s repeatable. That’s where automation is key.

Automation reduces:

  1. Manual steps during cutover (which increases human error)
  2. Inconsistent verification (which increases release risk)

A strong blue-green pipeline typically includes:

1. Build and Package

  • Build artifacts (container images, packages)
  • Run unit tests and security scans
  • Produce a versioned, traceable output

2. Deploy & Test in QA

  • Deploy your build to a test environment
  • Run automated and manual checks
  • Perform Dynamic Application Security Scans
  • Approve for Production release

3. Deploy to Green

  • Provision or update green infrastructure
  • Deploy the application version
  • Apply configuration and secrets

4. Verify

  • Run smoke tests and integration tests
  • Perform automated checks on key metrics
  • Validate health and readiness

5. Switch Traffic

  • Update routing (load balancer, ingress, service selector)
  • Confirm traffic is flowing to green

6. Post-Deploy Monitoring and Rollback Guardrails

  • Observe key signals for a defined window
  • Roll back traffic automatically or semi-automatically if thresholds are exceeded

This is also where teams increasingly rely on intelligent signal analysis to reduce noise and spot regressions faster. You don’t need “perfect AI” to benefit, just consistent data and clear thresholds.

Automation should not hide what’s happening. It should make the workflow reliable, auditable, and observable.

How to Choose Your Traffic Switching Mechanism

Cutovers don't all work the same way. Pick the mechanism that fits how quickly you need the switch to happen and how much control you need when you rollback.

Load Balancer / Ingress Switch

Often the cleanest option:

  • Fast and controllable
  • Supports health-aware routing
  • Works well with connection draining

DNS Cutover

DNS can work, but understand the tradeoffs:

  • Propagation can be unpredictable
  • Caching behaviors vary across clients and resolvers
  • Rollback may not be immediate

If you use DNS:

  • Set TTL thoughtfully and validate real behavior
  • Monitor traffic distribution during cutover
  • Expect a mixed state during the transition

Service Discovery / Registry Switching

Some service meshes or discovery layers can change the active endpoints.

This can be very useful if you already have a good routing layer and good visibility. If your team is still working on that discipline, keep things simple.

Security and Compliance Considerations

Blue-green changes how you show control and traceability.

If you work in regulated environments, you should plan for:

  • Audit trails: Who approved the deployment and the traffic switch?
  • Separation of duties: Are build, deploy, and promotion roles clearly defined?
  • Change management: Can you link a release to a ticket, PR, or change request?
  • Policy enforcement: Are scan/sign/approval gates enforced consistently?

A mature deployment workflow makes releases faster because it removes uncertainty—not because it cuts corners. 

Blue-Green Deployments Make Releases Predictable

Blue-green deployment reduces release risk by separating “deploy” from “expose.” You validate the new version in a production-capable green environment, cut traffic over when it’s ready, and keep blue available for a fast switch-back if something breaks, especially when your data changes are designed for compatibility.

To make that workflow consistent at scale, invest in automation around verification, promotion, and rollback criteria. Harness CD helps teams standardize these steps with pipelines and deployment safeguards, so blue-green becomes a routine, measurable part of delivery.

Blue-green Deployment: Frequently Asked Questions (FAQs)

Here are quick answers to the blue-green questions teams ask most when planning (or troubleshooting) real deployments. 

Is blue-green deployment truly zero downtime?

Blue-green can be near-zero downtime, but it depends on your cutover method and how your app handles state if you have long-lived connections, in-memory sessions, or heavy cache warm-up, plan for graceful handoff and validate with real traffic signals.

How long should you keep the blue environment after a blue-green cutover?

You should keep blue long enough to be confident that green is stable under real user load, then scale it down intentionally. Many teams use a fixed observation window (for example, 30–60 minutes) and extend it for higher-risk releases or business-critical periods.

Can you use blue-green deployment with database migrations?

Yes, as long as your database changes are compatible with both versions during the cutover window. Favor expand/contract patterns and avoid destructive changes until you’ve confirmed green is stable and rollback is no longer needed.

What metrics should you monitor during a blue-green deployment cutover?

Watch error rate, latency (especially p95/p99), and saturation signals (CPU, memory, queue depth) alongside key dependency health like database and cache performance. If you have them, add business metrics such as sign-in, checkout, or payment success to catch user-impacting regressions fast.

Blue-green vs canary deployment: which is better?

Blue-green is a strong fit when you want a clean before/after environment and a fast routing-based rollback. Canary is better when you can shift traffic gradually and promote based on metrics, reducing blast radius at the cost of added routing and observability complexity.

Do you need two Kubernetes clusters for a blue-green deployment?

No, many teams implement blue-green in a single Kubernetes cluster using separate Deployments, Services, or namespaces and switching traffic via Service selectors or Ingress routing. Two clusters can add isolation, but they also add operational overhead, so it’s typically a tradeoff rather than a requirement.

Software Delivery Agent
What is a Blue Green Deployment?

What is Continuous Integration? A Comprehensive Overview

CI is frequent integration + automated verification, so teams merge small changes into a shared repository and validate every change automatically to catch issues early. Fast, trustworthy feedback is the goal, which means optimizing pipelines for speed and signal quality with small PRs, reliable tests, safe caching, and clear failure reports. CI is the foundation for modern delivery, because consistent builds, tests, artifacts, and traceability make it easier to scale governance, strengthen security, and move toward continuous delivery.

8 min read

Software delivery keeps getting faster, with more services, more releases, and higher expectations for security and compliance. The biggest risk in that situation is making sure that change happens safely.

Continuous integration (CI) makes integration predictable by combining a simple habit of merging small changes often with automation that builds, tests, and validates every change. This way, problems come up early, and the main branch is always ready for the next release.

Harness CI is meant to keep pipelines fast, steady, and able to grow with the teams that use them. As AI and automation improve, CI is moving away from just "running a set of steps" toward faster, smarter feedback that tells you what went wrong, why, and what to do next.

What is Continuous Integration?

Continuous integration (CI) is a software development practice that keeps your codebase healthy by validating changes continuously.

CI tells developers to integrate early and often instead of letting work build up in long-lived branches and then paying the price during a painful "integration week." Automation does the same checks over and over again: it builds the code, runs tests, runs checks, and sends the results back to the team.

At a high level, CI has two main parts:

  1. A collaboration habit: Developers merge small, incremental changes into a shared repository frequently.
  2. An automated verification loop: Every change triggers an automated workflow that builds the code, runs tests, and reports results quickly.

When teams do CI right, integration stops being a fire drill. It becomes a regular, dependable part of daily growth.

Benefits of Continuous Integration

CI changes the economics of software delivery by finding problems early, when they’re cheaper to fix and easier to understand.

1. Earlier Detection of Integration Problems

Without CI, teams often find conflicts and regressions late, after working in parallel for weeks.

CI finds problems as they happen, such as:

  • Builds that don't work
  • Conflicts between dependencies
  • Test regressions
  • Integration mismatches between services

Timing is important. When CI flags an issue a few minutes after a commit, the developer still knows everything that was going on.

2. Faster Feedback Loops That Keep Developers in Flow

Fast feedback reduces context switching. Instead of waiting for nightly builds or discovering issues after a merge, developers get results while they’re still thinking about the change.

Over time, that improves:

  • Confidence in changes
  • Review quality
  • Speed of delivery

3. More Consistent Quality

By nature, manual validation is inconsistent. CI makes sure that checks are standardized so that quality doesn't depend on who remembers what.

CI helps with:

  • Consistent build and test execution
  • Standardized quality gates
  • Repeatable, auditable outcomes

4. Better Collaboration and Clearer Ownership

Frequent integration encourages frequent communication. Smaller PRs are easier to understand, and failures are easier to triage.

CI also improves shared ownership because:

  • Code review becomes a daily rhythm
  • Teams learn from failures quickly
  • Standards are enforced consistently

5. A Stronger Foundation for Delivery and Deployment

CI is the first step to automating more tasks down the line.

If you can’t reliably build, test, and produce artifacts in CI, continuous delivery and continuous deployment will be weak. If you can, those practices become much more achievable.

Common Challenges of Continuous Integration (CI)

The idea behind CI is simple. In practice, teams often deal with issues like slow feedback, noisy feedback, or environments that aren't always the same.

Here’s how to recognize and fix them:

Challenge 1: Merge Conflicts and Painful Integration

PRs can stay open for days, and when they finally land, merges can be dangerous and take a long time. Developers put off integration because they don't want to deal with conflicts or builds that don't work. Integration can become a stressful event instead of just a normal part of the day.

How to solve:

  • Keep PRs small and short-lived
  • Integrate frequently (daily or more)
  • Use trunk-based development where it makes sense
  • Use feature flags to safely merge incomplete work 

Challenge 2: Slow Pipelines and Delayed Feedback

CI takes so long that developers give up on waiting for results and switch to other tasks. When builds start, they may sit in a queue for a while, then run for 30 to 60 minutes. This slows down reviews and merges. Over time, CI stops teams from moving forward instead of keeping them on track.

How to solve:

  • Run independent steps (tests, linting, builds) at the same time (in parallel)
  • Cache dependencies and build outputs safely
  • Run only tests that are affected by code changes
  • Make PR checks fast; run deeper suites after a merge or on a schedule
  • Monitor and reduce queue time (it’s often the real bottleneck)

Challenge 3: Flaky Tests (Unreliable Signal)

The same test fails from time to time, even when the code hasn't had any meaningful changes. Developers run pipelines over and over again "until it passes," which teaches the team to ignore failures. When CI stops being reliable, it stops helping people make decisions and starts making noise.

How to solve:

  • Use AI to detect flaky tests
  • Treat flakiness as a flaw, not “normal”
  • Quarantine flaky tests while fixing root causes
  • Use retries sparingly and track a flaky-rate metric
  • Isolate tests and control setup/teardown

Challenge 4: “Works on My Machine” (Environment Drift)

A change works in one place but not in CI, or it works in CI but acts differently in later environments. Instead of making the change, developers spend time fixing differences in the toolchain. As time goes on, teams start to doubt that their pipelines show the truth.

How to solve:

  • Standardize build environments (containers are common)
  • Pin tool and runtime versions
  • Move toward reproducible builds

Challenge 5: Scaling CI as Teams and Codebases Grow

As more engineers and services use the same CI capacity, the wait times go up. Costs become harder to predict, and fixing and changing things in the pipeline becomes a full-time job. In the end, CI makes it harder for the company to ship.

How to solve:

  • Adopt reusable pipeline templates
  • Centralize governance (RBAC, policies, standardized steps)
  • Scale runners elastically and monitor capacity

Track utilization and cost so you can right-size resources

CI vs. Continuous Deployment vs. Continuous Delivery

CI, Continuous Delivery, and Continuous Deployment are closely connected practices in modern software delivery. They share the same foundation, automation, and fast feedback, but each one optimizes a different part of the lifecycle, from integrating code safely to releasing changes reliably.

Practice Primary Focus How It Works Typical Outcome
Continuous Integration (CI) Integrate changes safely and early. Developers merge small changes frequently, and every change triggers automated builds, tests, and checks that report results quickly. Fewer merge surprises, faster feedback, and a main branch that stays stable and releasable.
Continuous Delivery Keep software always releasable. CI validates changes, and the pipeline adds the automation, testing depth, and monitoring needed so a release can happen on demand. Teams can deploy to production whenever they choose, with lower risk and more predictable releases.
Continuous Deployment Ship validated changes automatically. Every change that passes the CI pipeline (and required quality/security gates) is deployed to production without manual intervention. The fastest release cycle, when confidence is high and rollback/observability practices are mature.

If you’re modernizing delivery, start with CI and build confidence step-by-step, then decide whether “always releasable” (delivery) or “always shipping” (deployment) matches your organization’s goals.

CI Best Practices (What High-Performing Teams Do Consistently)

Great CI requires consistent habits and a pipeline that developers trust.

1. Keep the Main Branch Healthy

Make it hard to merge broken code.

  • Require green CI checks before merge
  • Protect the main with branch rules
  • Keep failure output actionable (clear logs and links to reports)

2. Commit Small and Integrate Often

Small changes reduce risk and make reviews faster.

  • Encourage “vertical slices” instead of large batches
  • Set a PR size guideline if needed
  • Use feature flags to merge safely without exposing incomplete work

3. Make PR Pipelines Fast by Default

Your default PR pipeline should be the fastest path to confident feedback.

Common PR checks include:

  • Linting and formatting
  • Unit tests
  • Lightweight static analysis and security signals

Run deeper suites at the right stage:

  • On merge to main
  • Nightly
  • Before release

4. Parallelize What You Can

Many CI steps don’t depend on each other.

  • Shard unit tests
  • Run linting in parallel with builds
  • Execute service-level pipelines concurrently in monorepos

5. Use Caching Carefully and Measure Outcomes

Caching should reduce time without changing results.

  • Cache immutable dependencies
  • Bust caches intentionally when inputs change
  • Track cache hit rate and pipeline duration trends

6. Store and Version Artifacts

Artifacts are the bridge between CI and the rest of the delivery.

  • Version artifacts with commit SHA or semantic versions
  • Store artifacts in a trusted registry
  • Record provenance: what commit built it, what pipeline ran, what checks passed

7. Bring Security Earlier, with Clear Developer Feedback

CI is a strong place for early security signals, including:

  • Dependency vulnerability scanning
  • Secret scanning
  • Static analysis for common issues

The goal is clarity. Developers should understand what failed and how to fix it.

8. Treat CI as a Product

CI affects every developer. Treat it like a platform.

  • Define ownership for templates and runner infrastructure
  • Set targets (queue time, build time, broken-build MTTR)

Create a feedback loop to continuously improve CI

Where CI Is Going Next

CI started as automation for builds and tests. Today, it’s becoming a control plane for modern delivery: governance, security, traceability, and increasingly, smarter automation.

Here are the trends shaping what “good CI” will look like next:

AI-Powered Pipeline Creation

Engineering teams can build pipelines using AI and procing “golden” templates as the context to AI. This will help create secure and compliant CI pipelines much more efficiently.

AI-Assisted Troubleshooting and Optimization

As pipelines get more complex, the bottleneck often isn’t compute—it’s diagnosing failures and understanding systemic slowdowns. The next generation of CI will focus on helping teams reduce toil by surfacing likely root causes, highlighting recurring failure patterns, and recommending practical optimizations.

Policy and Guardrails That Scale with the Org

As more teams ship more often, standardization matters. Expect more pipeline guardrails that are expressed as policy: who can run what, where workloads can execute, what data can be accessed, and what needs approval, without slowing developers down.

Software Supply Chain Security Built into CI

Security teams are increasingly asking for provenance, audit trails, and clear artifact lineage. CI is the natural place to generate and attach that context, because it’s where artifacts are created and validated.

You don’t need to adopt every trend at once. But strengthening CI fundamentals now makes these capabilities far easier to roll out later.

CI That Scales With Your Team

CI is one of the most practical ways to increase delivery confidence without slowing teams down. It reduces integration risk, improves quality signals, and keeps the main branch in a releasable state.

If you want a strong next step, focus on two outcomes: faster feedback and a more trustworthy signal. Smaller PRs, reliable tests, consistent environments, and clear reporting will get you there and set you up for the next wave of automation in software delivery.

Harness CI directly tackles the foremost challenges in software development: cost, speed, security, and developer satisfaction. It delivers end-to-end ownership of the build process, incorporating both hardware and software optimizations to revolutionize build speeds at a fraction of the cost.

Continuous Integration: Frequently Asked Questions (FAQs)

What is continuous integration (CI) in simple terms?

CI is the habit of merging small code changes frequently and automatically checking each change with builds and tests. It helps teams find integration problems early on so that the main branch stays stable and ready to be released.

What’s the difference between CI, Continuous Delivery, and Continuous Deployment?

CI checks changes automatically, which keeps integration safe. Continuous Delivery makes it possible to release software whenever you want, and Continuous Deployment automatically ships every change that passes the pipeline when your testing and rollback maturity can handle it.

Should CI run on pull requests, on merges to main, or both?

Both are great: PR checks keep broken code from getting into the mainline, and merge-to-main pipelines make sure that what actually ships into the mainline is correct. A lot of teams keep their PR pipelines quick and run more tests after a merge or on a set schedule.

What tests belong in a CI pipeline?

Begin with quick, predictable checks, linting, unit tests, and basic static checks so that you get feedback quickly. Add integration and end-to-end tests only when they are needed, and put the slowest suites where they won't slow down every PR.

How can we speed up a slow CI pipeline?

Add parallelism and cut down on queue time first, because those usually give the biggest benefits. Next, add safe caching for dependencies and build outputs, and go back to test selection to make sure the heaviest suites run at the right time.

How do we keep CI secure?

Use access controls that give users the least amount of access they need, keep builds separate when you can, and use secure secrets workflows to keep secrets out of code and logs. Add early security signals like scanning for dependencies and secrets so that problems are found before they get too big.

Software Delivery Agent
What is Continuous Integration? A Comprehensive Overview

Integrating Smoke Testing into Your CI/CD Pipeline: What DevOps Needs to Know

Smoke tests are quick, automated checks that find release-breaking problems immediately after deployment and prevent unstable builds from progressing. Strong smoke testing stays small and dependable: a few important checks, clear assertions, and a predictable runtime so that teams can trust the gate. Automation and smoke tests go well together because they make sure that the pipeline is always gated, create rich failure artifacts, and (when needed) verify the deployment using real health signals (metrics/logs) to help make safe rollout decisions.

8 min read

AI coding tools can increase code velocity, but how well they work still depends on keeping both throughput and stability. Smoke tests help keep things stable by finding "this deploy is fundamentally broken" failures early, before deeper suites and promotions make the problem worse.

The goal isn’t to test everything. It’s to add a fast “go/no-go” gate that validates the essentials in the environment you just deployed to.

Harness can help you operationalize that gate with consistent pipeline enforcement, standardized failure handling, and optional post-deploy verification. With Continuous Delivery and Continuous Integration, you can turn smoke tests from slow, manual steps into smart deployment gates.

What Is Smoke Testing?

Smoke testing in CI/CD is a short set of checks that answers one question: “Is this build healthy enough to keep moving through the pipeline?” It’s sometimes called build verification testing because it validates the essentials, fast.

Teams typically run smoke tests after a deployment (for example, to a staging environment) to confirm:

  • The application starts successfully
  • The service is reachable
  • The most critical workflows still work
  • Dependencies (like databases or downstream services) are available

They are a first-pass check that gives quick feedback and finds problems with deployment and configuration that other tests might miss.

The Purpose of Smoke Testing in DevOps and CI/CD

Smoke tests help protect your delivery process, especially when you deploy often and your environments change a lot.

What Smoke Tests Protect You From

Smoke tests are meant to catch problems that are costly if found too late:

  • Broken startup and routing: The service doesn’t boot, readiness never goes green, or key routes return 404/500.
  • Configuration and secrets issues: Missing env vars, invalid flags, expired credentials, or incorrect secret wiring.
  • Dependency access problems: The app can’t reach the database, cache, queue, or a required downstream API.
  • Unexpected packaging/runtime mismatches: The build is “green” but the runtime image is missing a dependency, migration, or asset.

Why This Matters In A CI/CD Pipeline

Smoke tests speed up delivery by stopping wasted effort.

  • Block broken builds early. Stop unstable releases from advancing into QA, performance testing, or production.
  • Smoke tests find problems at deployment that build-time tests can’t catch. They check the deployed system, like settings, secrets, routing, and connections, not just the code.
  • Failing early saves time and resources. Running smoke tests right after deployment lets you find problems before spending more time in the pipeline.

The Outcomes Teams Get When Smoke Tests Are A Real Gate

When teams trust and always use smoke tests, they usually see these results:

  • Cleaner promotions: Fewer “staging looked fine, prod fell over” moments because core paths are validated before promotion.
  • Faster recovery: Failures surface earlier, with a smaller blast radius and a clearer rollback decision.
  • More predictable pipelines: Less noise from downstream suites triggered by fundamentally broken deploys.

Smoke Testing Key Characteristics: What Makes a Smoke Suite "Good"?

A good smoke test suite is kept small on purpose. The goal is to get clear signals, not to cover everything.

Fast By Design (Minutes, Not Hours)

As a rule of thumb, smoke tests should be fast enough to run as a promotion gate, ideally in minutes, not hours. If they slow down delivery, they’ll stop being used (or stop being trusted).

To keep speed predictable:

  • Keep the suite small (often 5–10 checks)
  • Prefer API-level assertions over complex UI flows
  • Run smoke tests in parallel when it doesn’t reduce determinism

Focused On Critical Paths

Smoke tests should focus on the most important parts:

  • Auth / login
  • A core API endpoint (read + write, if applicable)
  • A core page or workflow that reflects real value (dashboard, checkout, search)
  • Dependency connectivity (DB/cache/queue) when those are frequent sources of failure

Reliable And Repeatable

Smoke tests only work as gates if teams trust them. Make sure reliability is a top priority:

  • Use deterministic assertions and stable test data
  • Avoid brittle UI selectors when an API check will do
  • Keep timeouts reasonable and error messages specific

Smoke Testing vs. Sanity Testing: Which One Do You Need (and When)?

Both smoke tests and sanity tests are "quick checks," but teams don't always use the same words to describe them. Microsoft says that people sometimes call smoke tests "sanity tests," "acceptance tests," or "build/release verification tests."

A practical way to separate intent (even if your team uses different labels):

  • Smoke testing: “Is this build stable enough to keep moving?” Broad and shallow, meant to act as a gate after deploy.
  • Sanity testing: “Did this specific change work?” Narrow and targeted, focused on recent edits or a hotfix.

Simple rule:

  • Run smoke tests after deploy (staging, canary, or pre-promotion).
  • Run sanity tests after targeted fixes when you want confidence in a specific area.

Types of Smoke Testing (What DevOps Teams Actually Use)

Most teams use a mix, then converge on what’s easiest to run reliably in CI/CD.

  • Automated post-deploy smoke tests: Run right after a deploy to confirm the service is reachable and core paths work.
  • API smoke tests: Fast HTTP checks with clear assertions (often the most stable signal).
  • Minimal UI smoke tests: 1–2 high-value journeys where UI breakage is a real risk and can’t be validated via API.
  • Pre-promotion smoke tests: A gate between environments (staging → prod).
  • Production smoke tests (optional): Read-only checks that validate critical functionality without impacting users.

If you’re moving to progressive delivery, smoke tests are especially useful during canary steps; run them on the canary before increasing traffic.

And if you want deeper automated confidence, Harness Continuous Verification can validate post-deploy health signals (metrics/logs) using ML-based analysis.

When Should You Run Smoke Tests in Your CI/CD Pipeline?

Putting smoke tests in the right places at key pipeline gates gets the most value out of them while keeping costs low. If you run them too soon, you're testing an incomplete deployment. If you run them too late, you're wasting time and computing power on a release that was never possible.

Here are the placements that work well across most teams:

  • Right after a deployment to staging (the default baseline). As soon as the release is in staging, run smoke tests. This catches problems with configuration, secrets, routing, and dependencies in the same place you make decisions about promotions.
  • Before moving on to production, which is your "go/no-go" gate. Before you release something, think of smoke tests as the last test you need to pass. As part of the release flow, Microsoft's baseline architecture guidance says to run smoke tests and use failures to stop the pipeline and roll back when necessary.
  • As part of either canary or progressive delivery. If you roll out slowly, do smoke tests on the canary first, and then do a slimmed-down version again when traffic picks up. The goal is to make sure that important paths work when routing, authentication, and dependencies are set up correctly.
  • On temporary PR environments (optional, high-signal). If you create preview environments for each pull request, smoke tests are a quick way to check things before merging. Keep them small so they don't slow down the process of developers changing things.
  • In production (with careful planning). Production smoke tests can be useful, but make sure they are read-only and don't cause any problems. Microsoft's basic architecture also talks about running smoke tests in production and going back to the last known good state if they fail.

How to Perform Smoke Testing

You don't need to completely change your pipeline to add useful smoke tests. Begin with a small, dependable set and let automation take care of the work.

Microsoft’s Engineering Fundamentals Playbook puts it well: smoke tests should cover only the most critical path and keep execution time and complexity to a minimum—because they’re meant to act as a gate.

Step 1: Choose 5–10 Checks That Represent “Success”

Pick checks that tell you whether the service is fundamentally alive in the environment you deployed to. A good starter set usually includes:

  • Readiness: A readiness endpoint returns success (or Kubernetes readiness is true)
  • Auth: A basic auth/token flow works (if your product requires login)
  • One core read: The most-used API or page loads expected data
  • One core write (optional): Only if you can do it safely with idempotent test data
  • Dependency confidence: Database/cache/queue connectivity, when these are frequent failure points

If you’re not sure where to start, look at the last few incidents and ask, “What would have caught this within two minutes?”

Step 2: Pick the Right Level: HTTP, API, Minimal UI

Start with the lightest checks that still give you a trustworthy signal:

  • HTTP reachability and status checks (seconds): Confirm the service responds and key routes aren’t broken.
  • API assertions (minutes): Validate auth + a couple of core endpoints with clear assertions.
  • Minimal UI checks (only when needed): 1–2 revenue- or mission-critical journeys that you can’t validate at the API layer.

A practical guideline: if a UI step is flaky, it doesn’t belong in smoke. Move it to a broader suite and keep smoke deterministic.

Step 3: Make Smoke Tests a Real Gate (Not a “Nice-to-Have”)

Smoke tests only help if failures actually stop the build from moving forward.

A clean pattern looks like this:

  1. Deploy to staging
  2. Run smoke tests
  3. If smoke passes → continue to deeper suites or promote
  4. If smoke fails → stop, capture artifacts, decide fix-forward vs rollback

You can enforce this gate with failure strategies (for example, abort, rollback, or mark failure) and control what happens when a step fails.

For CD pipelines, Harness also supports pipeline rollback strategies so teams can standardize what “safe failure” looks like when a gate fails.

Step 4: Make Failures Debuggable and Actionable

When smoke tests fail, speed matters. Your goal is to help someone fix the issue without having to re-run the entire deployment just to gain context.

Build these into your smoke stage:

  • Capture request/response details (with secrets redacted)
  • Upload artifacts on failure (logs, test output, screenshots for UI checks)
  • Include “what to check next” in the assertion message (service logs, rollout status, dependency endpoints)
  • Add correlation IDs so you can trace a single failing request across logs and traces

Best Practices for Smoke Testing That Won't Slow Releases

Smoke testing is most effective when it remains small, reliable, and focused.

  • Keep smoke tests small and focused only on the most important paths. They are not meant to be a mini regression suite. Microsoft also recommends keeping smoke tests simple and focused on the critical path.
  • Set a time limit for your smoke tests, such as 3–7 minutes, and stick to it. If tests take longer, treat it as a problem, since slow smoke tests can slow down delivery.
  • Choose reliable checks instead of fragile UI automation. API-level checks are usually faster and more dependable.
  • Make sure your tests are safe to run more than once. Use actions and test data that won’t cause problems if you need to retry.
  • Treat flaky tests like production bugs. Test flakiness can become a big problem as it slows teams down with unreliable results.
  • Don’t keep retrying tests until they pass. If you allow retries, keep them limited and make them visible. Flaky tests add confusion because failures may not be caused by code changes.
  • Build in good security practices. Hide secrets, don’t log tokens, and keep production smoke tests read-only.
  • Improve your process with automated verification. Use smoke tests as a quick gate, then check deeper health signals after deployment.

Smoke Test in Action: Real-World Examples for Your Software Product

It’s easiest to build smoke tests by starting with real user workflows and past failures your team has experienced.

Example 1: Web Application (Critical User Path)

Goal: confirm the app is usable end-to-end after deploy.

Minimal smoke checks:

  • GET /health returns success and expected version metadata
  • Login succeeds (via API if possible)
  • A core page loads (dashboard, search, checkout start)
  • A static asset or API call required by the page returns success

If you add UI checks, keep them minimal:

  • Login → load dashboard → perform one primary action → logout

Example 2: API Service (Auth + Core Endpoints)

Goal: confirm the most important API surfaces are working.

Starter smoke checks:

  • POST /auth/token returns a valid token
  • GET /v1/me returns expected fields
  • GET /v1/<core-resource> returns a 200 and a non-empty payload
  • Optional safe write: POST /v1/<resource> with idempotency key → 200/201

Example 3: Kubernetes Deploy (Rollout + Readiness + Endpoint)

Goal: confirm the platform and workload are actually ready.

Common checks:

  • kubectl rollout status deployment/<name> confirms rollout completes
  • Pods are Ready and not crash-looping
  • Service endpoint returns success

Kubernetes documents kubectl rollout status and other rollout commands as standard ways to check deployment progress.

For readiness/liveness configuration, Kubernetes provides guidance on readiness and startup probes (helpful in avoiding “it’s up but not ready” failures).

Example 4: Microservices (One End-To-End Path + Dependencies)

Goal: validate a single critical transaction across services.

Pick one path that matters (for example: create order → reserve inventory → charge payment → emit event). Then add just enough checks to prove:

  • Each service in the path is reachable
  • Dependencies are available
  • The transaction completes with expected output

A Simple Smoke Testing Plan You Can Start This Week

You don’t need months to build a good smoke testing plan for CI/CD. Start by picking 5–10 checks that cover your most important user flows and API endpoints. Run these automated tests right after deploying to staging and before promoting to production. Your smoke suite should finish in under 5 minutes and stop the pipeline if it finds problems.

Make sure someone is responsible for maintaining the suite and set strict time limits to keep it focused. When you’re ready to add smoke testing with strong gates, look into how smart verification can improve your delivery pipeline.

TL;DR: Smoke tests aren’t about catching every bug — they’re about quickly answering one question: is this deployment safe to promote?

Explore Harness Continuous Delivery and Continuous Integration to start releasing with confidence.

CI/CD Smoke Testing: Frequently Asked Questions (FAQs)

These practical answers address the most common CI/CD smoke testing FAQ topics that come up when scaling deployment pipelines across enterprise environments.

How many smoke tests should we run?

Start with 5 to 10 important checks that show the service is working after it has been deployed. Add more only if they clearly help, and keep the suite small so it stays fast and works.

How long should a smoke suite take?

Aim for smoke tests that run in minutes, not hours. They should be fast enough to work as a gate without slowing down releases. Teams might skip them or stop trusting the results if they take too long.

Smoke tests vs. health checks: what’s the difference?

Health checks show that the service is working. Smoke tests show that the service works for key tasks right after it is set up.

Should smoke tests run in production?

You can run smoke tests in production, but make sure they are read-only, focused, and safe to run more than once. Microsoft says that the release process should include production smoke tests and a plan for rolling back if they fail.

Should smoke tests be API or UI?

Start with checks at the API level because they are quick and dependable. Add simple UI smoke tests only for cases where you can't use the API.

What causes flaky smoke tests (and how do we fix them)?

Timing problems, unstable environments, or outside dependencies are common causes of flaky tests. This makes the results hard to understand, which teams might ignore. To fix flakiness, use clear waits instead of sleeps, make sure your test data is stable, and keep your smoke tests small and reliable.

Where should smoke tests live (app repo vs separate repo)?

It's best to keep smoke tests in the same repo as the code they check so that they change with the code. If you use shared tools, put the framework in one place, but let each service team run their own tests.

Are smoke tests the same as end-to-end tests?

No. Smoke tests are intentionally small and fast, designed to validate that a deployment is fundamentally healthy. End-to-end tests are broader, slower, and validate full workflows across systems.

Software Delivery Agent
Integrating Smoke Testing into Your CI/CD Pipeline: What DevOps Needs to Know
No articles in this category yet.
Clear filters

Get Started

Get Started with Harness AI

Try the full platform free. No module restrictions, no credit card.