Featured Blogs

At Harness, we know developer velocity depends on everyday workflow. That is why we reimagined Harness Code with a faster, cleaner, and more intuitive experience that helps engineers stay in flow from the first clone to the final merge.
Why Developers Love the New Experience
Smarter Pull Request Reviews
Review diffs and conversations without constant context switching. Inline comments, keyboard shortcuts, and faster file rendering help you focus on the code instead of the clicks.
Faster File Tree and Change Listing
The new file browser is optimized for large repositories. You can search, jump, and scan changes instantly even when working with thousands of files.
Seamless Repo Navigation
Move between branches, commits, and repositories without losing your scroll position or comment state.

Unified Harness Design System
The entire interface now uses the same design system as the rest of the Harness platform, which reduces the learning curve and makes navigation feel natural.
Why Leaders Should Care
Every inefficiency in the developer experience is a hidden tax on velocity. Harness Code removes those blockers so your teams:
- Ship faster by reducing wasted time in code reviews.
- Collaborate better with a clear, intuitive UI that scales across teams.
- Standardize workflows with a design system that unifies the Harness platform.
All 500-plus Harness engineers are already using the new experience, proving it scales in real enterprise environments.
Seamless Rollout, Zero Migration
Adopting the new experience is effortless:
- Beginning of October 2025: Available for all users (opt-in).
- End of December 2025: Legacy UI deprecated.
- Beginning of January 2026: New experience becomes default.
There is nothing to migrate. Simply click 'Opt In', and your repositories, permissions, and integrations will continue to work as before.
What’s Next
The new Harness Code experience is only the beginning. Coming soon:
- Even faster repo load times.
- More native AI support for PR reviews and commit insights.
We’re continuing to invest in developer-first features that make Harness Code not just a repository, but the heartbeat of your software delivery pipeline.
Try It Today
If you have been looking for a modern, developer-first alternative to GitHub or GitLab that integrates directly with your CI/CD pipelines, now is the time to try it.
👉 Start your Harness Code trial today and experience a repo that helps you move faster and deliver more.
Learn more: Workflow Management, What Is a Developer Platform
.webp)
Harness Cloud is a fully managed Continuous Integration (CI) platform that allows teams to run builds on Harness-managed virtual machines (VMs) pre-configured with tools, packages, and settings typically used in CI pipelines. In this blog, we'll dive into the four core pillars of Harness Cloud: Speed, Governance, Reliability, and Security. By the end of this post, you'll understand how Harness Cloud streamlines your CI process, saves time, ensures better governance, and provides reliable, secure builds for your development teams.
Faster Builds
Harness Cloud delivers blazing-fast builds on multiple platforms, including Linux, macOS, Windows, and mobile operating systems. With Harness Cloud, your builds run in isolation on pre-configured VMs managed by Harness. This means you don’t have to waste time setting up or maintaining your infrastructure. Harness handles the heavy lifting, allowing you to focus on writing code instead of waiting for builds to complete.
The speed of your CI pipeline is crucial for agile development, and Harness Cloud gives you just that—quick, efficient builds that scale according to your needs. With starter pipelines available for various programming languages, you can get up and running quickly without having to customize your environment.
Streamlined Governance
One of the most critical aspects of any enterprise CI/CD process is governance. With Harness Cloud, you can rest assured that your builds are running in a controlled environment. Harness Cloud makes it easier to manage your build infrastructure with centralized configurations and a clear, auditable process. This improves visibility and reduces the complexity of managing your CI pipelines.
Harness also gives you access to the latest features as soon as they’re rolled out. This early access enables teams to stay ahead of the curve, trying out new functionality without worrying about maintaining the underlying infrastructure. By using Harness Cloud, you're ensuring that your team is always using the latest CI innovations.
Reliable and Scalable Infrastructure
Reliability is paramount when it comes to build systems. With Harness Cloud, you can trust that your builds are running smoothly and consistently. Harness manages, maintains, and updates the virtual machines (VMs), so you don't have to worry about patching, system failures, or hardware-related issues. This hands-off approach reduces the risk of downtime and builds interruptions, ensuring that your development process is as seamless as possible.
By using Harness-managed infrastructure, you gain the peace of mind that comes with a fully supported, reliable platform. Whether you're running a handful of builds or thousands, Harness ensures they’re executed with the same level of reliability and uptime.
Robust Security
Security is at the forefront of Harness Cloud. With Harness managing your build infrastructure, you don't need to worry about the complexities of securing your own build machines. Harness ensures that all the necessary security protocols are in place to protect your code and the environment in which it runs.
Harness Cloud's commitment to security includes achieving SLSA Level 3 compliance, which ensures the integrity of the software supply chain by generating and verifying provenance for build artifacts. This compliance is achieved through features like isolated build environments and strict access controls, ensuring each build runs in a secure, tamper-proof environment.
For details, read the blog An In-depth Look at Achieving SLSA Level-3 Compliance with Harness.
Harness Cloud also enables secure connectivity to on-prem services and tools, allowing teams to safely integrate with self-hosted artifact repositories, source control systems, and other critical infrastructure. By leveraging Secure Connect, Harness ensures that these connections are encrypted and controlled, eliminating the need to expose internal resources to the public internet. This provides a seamless and secure way to incorporate on-prem dependencies into your CI workflows without compromising security.
Next Steps
Harness Cloud makes it easy to run and scale your CI pipelines without the headache of managing infrastructure. By focusing on the four pillars—speed, governance, reliability, and security—Harness ensures that your development pipeline runs efficiently and securely.
Harness CI and Harness Cloud give you:
✅ Blazing-fast builds—8X faster than traditional CI solutions
✅ A unified platform—Run builds on any language, any OS, including mobile
✅ Native SCM—Harness Code Repository is free and comes packed with built-in governance & security
If you're ready to experience a fully managed, high-performance CI environment, give Harness Cloud a try today.
.webp)
As software projects scale, build times often become a major bottleneck, especially when using tools like Bazel. Bazel is known for its speed and scalability, handling large codebases with ease. However, even the most optimized build tools can be slowed down by inefficient CI pipelines. In this blog, we’ll dive into how Bazel’s build capabilities can be taken to the next level with Harness CI. By leveraging features like Build Intelligence and caching, Harness CI helps maximize Bazel's performance, ensuring faster builds and a more efficient development cycle.
How Harness CI Enhances Bazel Builds
Harness CI integrates seamlessly with Bazel, taking full advantage of its strengths and enhancing performance. The best part? As a user, you don’t have to provide any additional configuration to leverage the build intelligence feature. Harness CI automatically configures the remote cache for your Bazel builds, optimizing the process from day one.
Build Intelligence: Speeding Up Bazel Builds
Harness CI’s Build Intelligence ensures that Bazel builds are as fast and efficient as possible. While Bazel has its own caching mechanisms, Harness CI takes this a step further by automatically configuring and optimizing the remote cache, reducing build times without any manual setup.
This automatic configuration means that you can benefit from faster, more efficient builds right away—without having to tweak cache settings or worry about how to handle build artifacts across multiple machines.
How It Works with Bazel
Harness CI seamlessly integrates with Bazel’s caching system, automatically handling the configuration of remote caches. So, when you run a build, Harness CI makes sure that any unchanged files are skipped, and only the necessary tasks are executed. If there are any changes, only those parts of the project are rebuilt, making the process significantly faster.
For example, when building the bazel-gazelle project, Harness CI ensures that any unchanged files are cached and reused in subsequent builds, reducing the need for unnecessary recompilation. All this happens automatically in the background without requiring any special configuration from the user.
Benefits for Bazel Projects
- Automatic Remote Caching: No manual configuration needed—Harness CI configures the remote cache for you.
- Faster Builds: Builds run faster by reusing previously built outputs and skipping redundant tasks.
- Optimized Resource Usage: Reduces the use of CPU and memory by only running the tasks that are necessary.
Sample Pipeline: Harness CI with Bazel
Benchmarking: Harness CI vs. GitHub Actions with Bazel
We compared the performance of Bazel builds using Harness CI and GitHub Actions, and the results were clear: Harness CI, with its automatic configuration and optimized caching, delivered up to 4x faster builds than GitHub Actions. The automatic configuration of the remote cache made a significant difference, helping Bazel avoid redundant tasks and speeding up the build process.
Results:

- Harness CI with Bazel: Builds were up to 4x faster, thanks to automatic remote cache configuration and build optimization.
- GitHub Actions with Bazel: Slower builds due to less efficient caching and redundant task execution.
Next Steps
Bazel is an excellent tool for large-scale builds, but it becomes even more powerful when combined with Harness CI and Harness Cloud. By automatically configuring remote caches and applying build intelligence, Harness CI ensures that your Bazel builds are as fast and efficient as possible, without requiring any additional configuration from you.
By combining other Harness CI intelligence features like Cache Intelligence, Docker Layer Caching, and Test Intelligence, you can speed up your Bazel projects by up to 8x.With the hyper optimized build infrastructure, you can experience lightning-fast builds on Harness Cloud at reasonable costs. This seamless integration allows you to spend less time waiting for builds and more time focusing on delivering quality code.
If you're looking to speed up your Bazel builds, give Harness CI a try today and experience the difference!
Latest Blogs

Real-Time CPU and Memory Insights for Harness CI Cloud Builds
When a CI pipeline runs on cloud infrastructure, the build machine is ephemeral. It spins up, executes your build, and disappears. During that window, you have zero visibility into how much CPU and memory your pipeline actually consumes.
This blind spot creates real problems. Teams over-provision VMs "just in case," wasting compute spend. Others under-provision and deal with silent OOM-kills or CPU throttling — the only clue being a cryptic exit code 137. Without historical resource profiles, there's no data-driven way to right-size pipelines or catch regressions introduced by dependency upgrades.
We built CPU and Memory Insights to solve this. It gives you real-time and historical visibility into resource consumption during every Harness CI Cloud build — with zero configuration and zero impact on build performance.
Why Resource Visibility Matters
Consider a typical scenario: your build takes 12 minutes on a Large machine (4 vCPU, 8GB RAM). Is it CPU-bound during compilation? Memory-bound during docker build? Or is it I/O-bound pulling dependencies? Without metrics, you're guessing.
With CPU and Memory Insights, you can:
- Right-size your machines — see that a "Large" build peaks at 30% CPU and safely downgrade to "Medium," cutting your cloud spend.
- Debug failures faster — watch the memory ramp leading to an OOM kill and pinpoint which step caused it.
- Detect regressions — compare P90 CPU across builds to catch when a dependency update made things worse.
How It Works
The system collects resource metrics from inside the ephemeral VM, streams them in real-time to the Harness platform, and renders interactive charts in the execution view.
Architecture
Harness CI Cloud uses a multi-layered architecture for pipeline execution. The metrics flow is overlaid on the same path used for build orchestration:
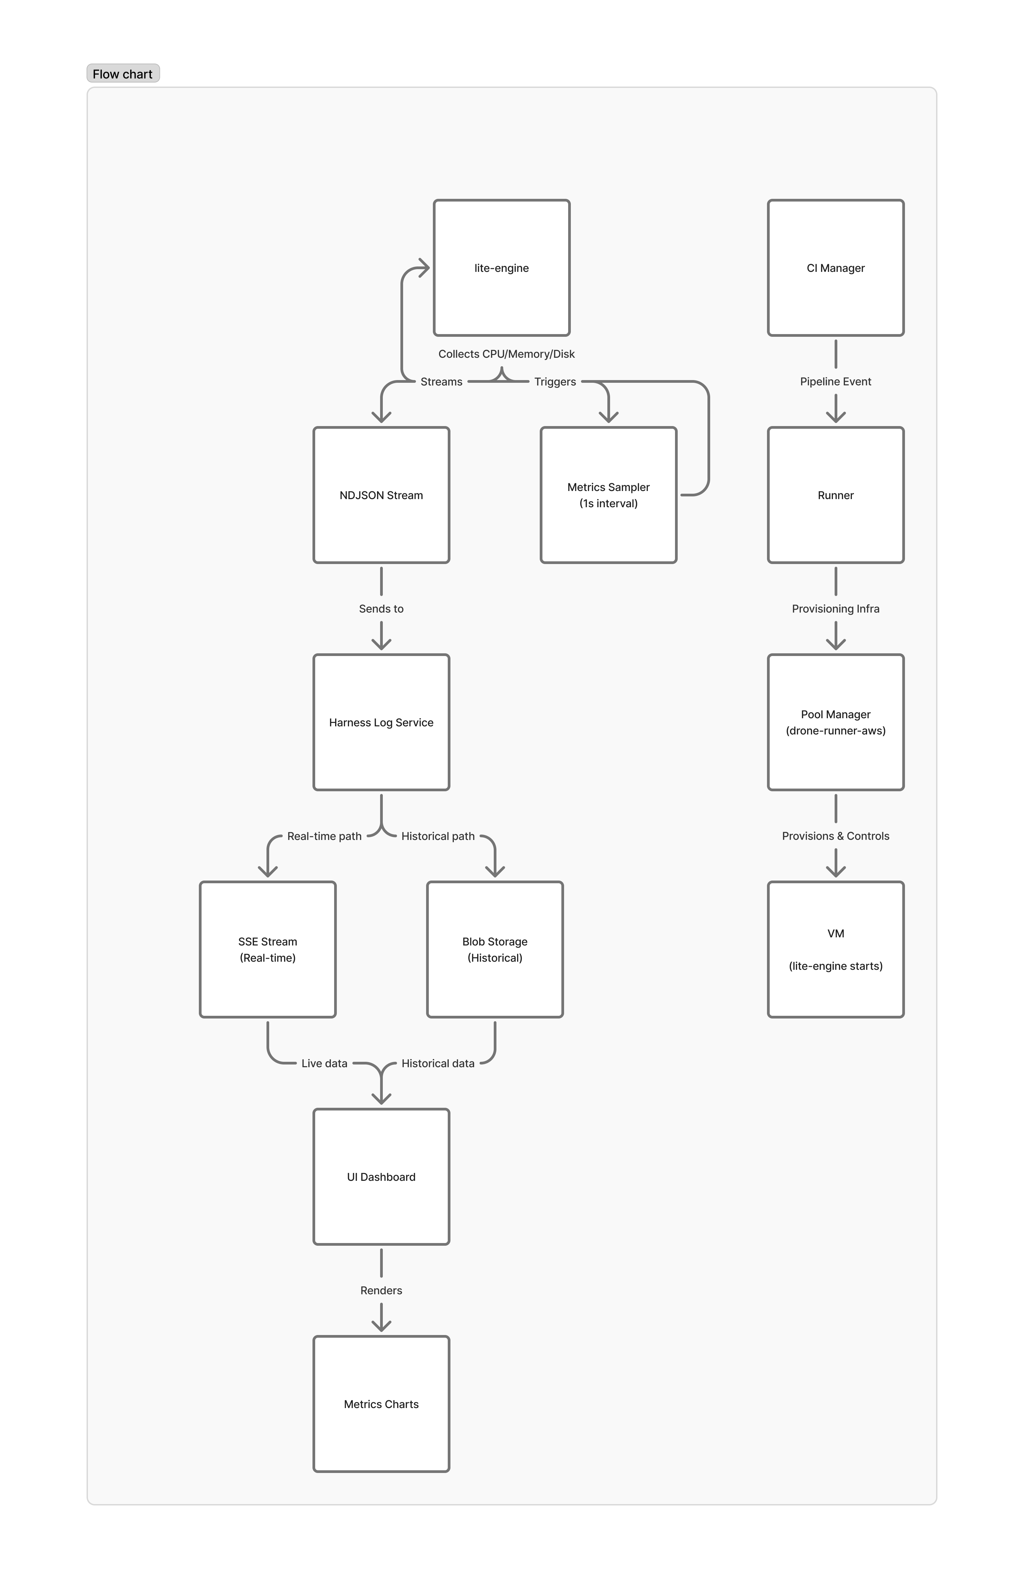
The key insight: lite-engine is the only component running inside the VM — it's the only one with access to actual resource utilization. But it has no persistent storage. Everything must be streamed out before the VM is destroyed.
Data Collection
When a VM is provisioned for your build, lite-engine starts a background process that samples system metrics every second:
- CPU utilization — aggregate percentage across all cores
- Memory usage — total and available, in GB
- Disk I/O — read and write throughput in bytes/sec
Each sample is written as a single JSON line (NDJSON format) to the Harness Log Service using a dedicated stream key. This is the same battle-tested infrastructure that powers step-level log streaming — we reuse its real-time SSE transport, blob storage, and access control. No new infrastructure needed.
Real-Time Streaming
The metrics stream opens during VM setup and closes during VM destroy, giving continuous coverage regardless of how many steps run or fail in between. The stream is independent of step execution — there are no gaps between steps.
During execution, the UI connects via Server-Sent Events (SSE) to receive metrics as they're collected. For completed builds, the same data is available from blob storage. The UI handles both transparently — same visualization whether you're watching a live build or reviewing a historical one.
Summary Statistics
When the VM is destroyed, lite-engine computes a final summary before closing the stream:
- Peak CPU — maximum utilization observed
- Average CPU — mean utilization across the entire stage
- P90 CPU — 90th percentile utilization (useful for right-sizing decisions)
- Total Disk I/O — cumulative bytes read and written
The frontend also computes P50, P90, P95, and P99 percentiles client-side, which means you get full statistics even for in-progress executions.
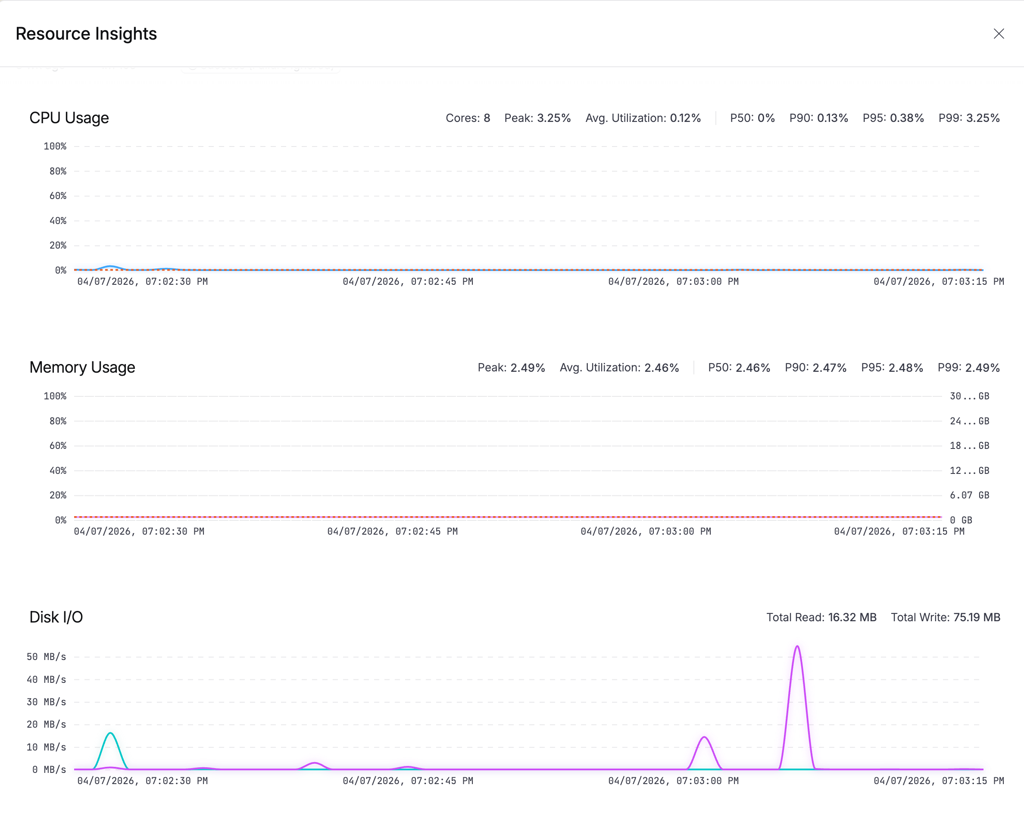
What You See in the UI
Click the resource indicator button in the execution view (it shows your platform and size, e.g., "Linux (Large)"). A drawer opens with three charts:
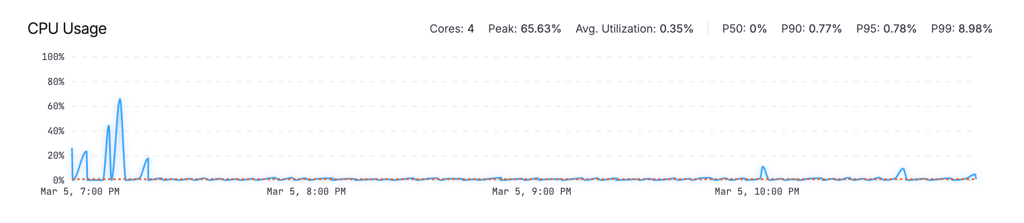
CPU Usage
An area chart showing utilization percentage over time, with a P90 reference line. The stats bar shows total cores, peak utilization, average, and percentiles (P50/P90/P95/P99).
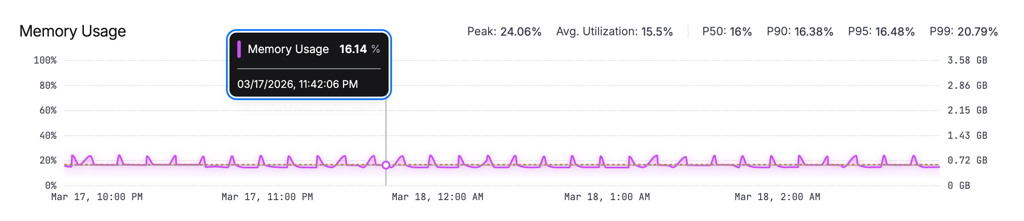
Memory Usage
An area chart with dual Y-axes: percentage on the left, GB on the right. Helps you understand both relative and absolute consumption at a glance.
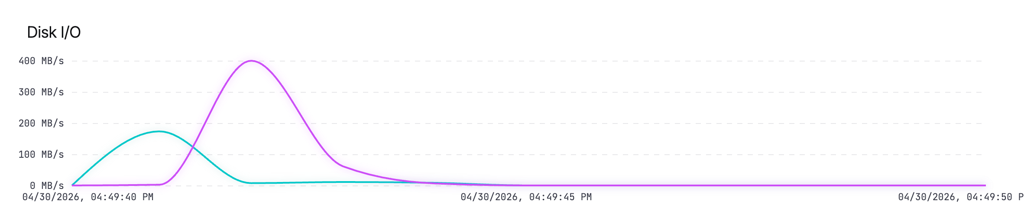
Disk I/O
A line chart showing read and write throughput in MB/s. Useful for identifying I/O-bound steps like image pulls or large file operations.
A stage selector dropdown at the top lets you switch between stages in multi-stage pipelines.
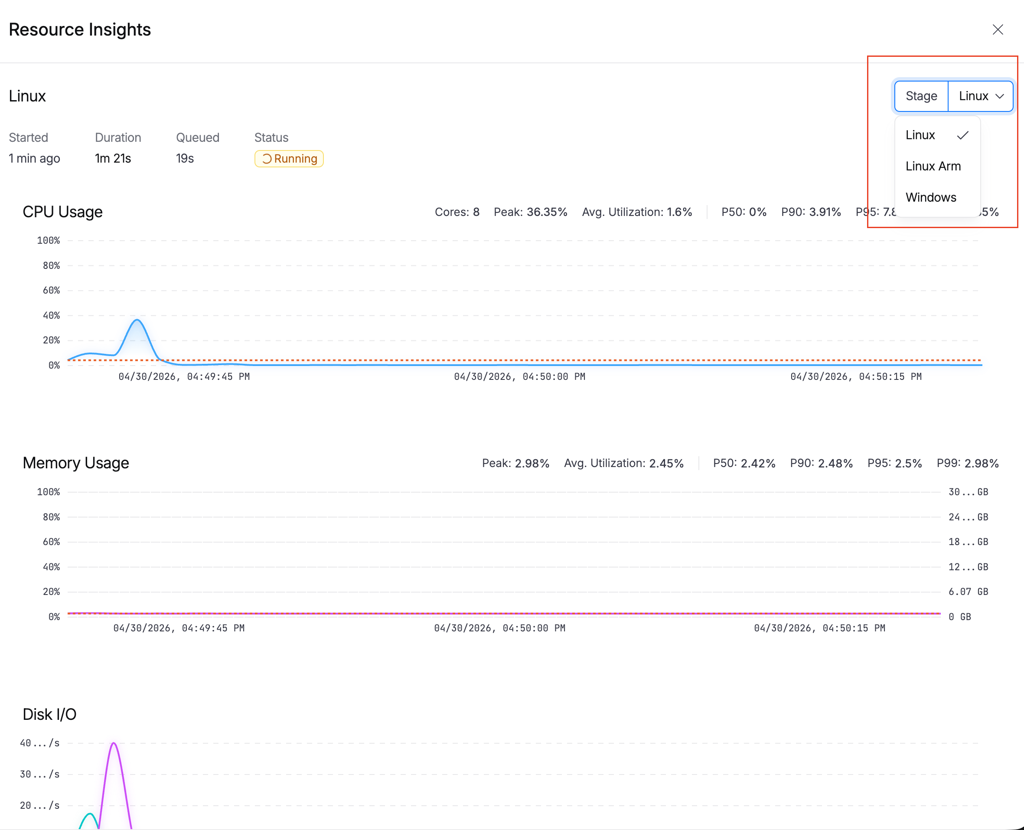
Cross-Platform Support
CPU and Memory Insights works across all Harness Cloud infrastructure:
layer normalizes platform-specific differences. Whether the underlying OS reports per-core or aggregate CPU, or uses different disk I/O naming conventions, the metrics are always presented consistently: aggregate CPU as a single percentage, memory in GB, and disk throughput as a delta rate.
Performance Impact
Resource collection runs with negligible overhead:
For long-running builds, the frontend intelligently downsamples to 120 data points for chart rendering while preserving visual accuracy — peaks and valleys are maintained using the LTTB (Largest-Triangle-Three-Buckets) algorithm.
Reliability
Builds can end in many ways: graceful completion, timeout, infrastructure failure, or force-kill. We handle all of them:
- Happy path: lite-engine writes the summary and closes the stream on VM destroy.
- Crash path: The platform-level cleanup phase independently closes the metrics stream if lite-engine didn't. This runs regardless of how the VM terminated.
This dual-closure approach ensures metrics data is never orphaned — you always get at least the raw timeline, even if the summary couldn't be computed.
What's Next
We're continuing to invest in resource intelligence for CI builds:
- Step-level attribution — correlating resource spikes with specific pipeline steps to pinpoint exactly which step is expensive.
- Automated right-sizing recommendations — using historical P90 data to suggest optimal machine sizes for your pipelines.
- Resource threshold alerts — notifying you when builds consistently approach memory limits, before they OOM-kill.
- Build-over-build comparison — overlaying metrics from the current build against previous runs to visualize the resource impact of code changes.
Get Started
CPU and Memory Insights is enabled by default for all pipelines running on Harness CI Cloud no setup required.
To explore the feature:
- Open any pipeline execution running on a Harness Cloud machine.
- Click the resource indicator in the stage execution header (for example,
Linux (Large)). - Open the insights drawer to view real-time and historical CPU and memory usage for your build.
No YAML changes. No additional agents. No configuration needed.
Use this visibility to quickly identify resource bottlenecks, right-size your build infrastructure, and improve overall CI efficiency.
Ready to optimize your builds? Try it in your next pipeline run or learn more in the Harness CI documentation.

Azure Deployment Strategies & CI/CD Best Practices
- Modern Azure deployment goes beyond basic pipelines. Teams that combine CI/CD automation with progressive delivery and feature flags ship faster and with far fewer incidents.
- Choosing the right deployment strategy for each workload type dramatically reduces blast radius and makes rollbacks a matter of seconds, not hours.
- Embedding feature management and experimentation directly into Azure deployments lets teams decouple deployment from release before full rollout.
Learn how to master Azure deployment with CI/CD pipelines, progressive delivery, and feature flags. See how Harness helps engineering teams ship faster and safer on Azure.
Azure deployment sounds straightforward. Push code, it runs in the cloud. But if you've managed a 2 a.m. production incident because a deployment went sideways on AKS, you know the gap between "it deploys" and "it deploys safely at scale" is significant.
This guide covers the deployment strategies, pipeline structures, and operational patterns that close that gap -- from how to sequence a canary rollout to how Harness Continuous Delivery makes the whole operation measurably safer.
What Is Azure Deployment?
Azure deployment is the process of releasing application code, configuration, or infrastructure changes to Microsoft Azure. That can target VMs, AKS clusters, Azure App Service, Azure Functions, Azure Container Instances -- whatever your workload runs on.
At the artifact level, a deployment pushes a container image, a build package, or a Terraform plan into an Azure environment. What distinguishes a mature deployment workflow from a basic one is the control layer around that push:
- CI gates every commit. No artifact reaches Azure without passing build, test, and static analysis stages.
- CD automates the path from staging to production. Humans approve; pipelines execute.
- Deployment strategy determines blast radius. Canary, blue-green, and rolling deployments each make a different tradeoff between speed, safety, and cost.
- IaC keeps environments consistent. If a resource change isn't in code, it doesn't happen.
- Observability triggers rollback. Post-deployment verification watches metrics automatically. If error rates cross the threshold, the pipeline acts -- no engineer needs to catch it first.
Azure Deployment Strategies: Pick the Right Tradeoff
The strategy you choose determines how much of your user base absorbs a bad release before you can respond. The tradeoffs are clear.
Blue-Green Deployment
Blue-green keeps two identical environments live: blue handles production traffic; green runs the new version. When green passes validation, traffic cuts over instantly.
What this means in practice on Azure:
- You're running double the infrastructure during every deployment window -- parallel App Service slots, duplicate AKS node pools, or mirrored Container Apps environments.
- Rollback is instant: flip traffic back to blue.
- Validation happens before any user sees the new version.
Use blue-green when: rollback speed matters more than infrastructure cost, and you need zero-downtime cutover with the option to abort completely.
Skip blue-green when: your workload has stateful dependencies or database schema changes that make running parallel environments operationally complex.
Canary Deployment
Canary deployments send a defined percentage of traffic to the new version while the rest stays on stable. Start small, watch metrics, and expand only when data supports it.
A standard canary ramp on a high-traffic Azure workload:
- 1% of traffic to canary. Watch p95 latency and error rate for 15-30 minutes.
- 5% if metrics hold. Watch for another 30 minutes.
- 25% if metrics hold.
- 100% once you're confident.
At each stage, define a specific rollback trigger before the deployment starts -- not while you're watching dashboards. For example: if error rate rises more than 0.2% above baseline, or p95 latency increases more than 50ms, auto-roll back and alert.
The blast radius of a bad release tops out at whatever percentage is currently on canary. Catch a problem at 1%, and one in a hundred users hits it -- not all of them.
Rolling Deployment
Rolling deployments replace instances of the old version in batches. No double infrastructure -- each batch of pods gets updated and validated before the next batch rolls.
This is resource-efficient, but old and new versions run simultaneously during the rollout. That creates two constraints:
- API calls from old instances can reach new instances. If your API contract changed, backward compatibility is required.
- Database schema changes need to be backward-compatible before the rollout starts. Migrate first, then deploy.
Use rolling when: your workload is stateless, API changes are backward-compatible, and infrastructure cost is a constraint.
Building a CI/CD Pipeline for Azure
A reliable Azure deployment pipeline runs the same automated process on every commit. Here's how the stages flow using Harness-powered pipelines.
Stage 1: Source Trigger
A commit or PR kicks off the pipeline. Every change -- bug fixes, config updates, dependency bumps -- goes through the same stages. No exceptions for "small" changes; that's where incidents come from.
Stage 2: Build and Unit Test
Code compiles. Container images build. Unit tests run. If anything fails here, the pipeline stops. Don't let a broken build consume downstream compute.
Tag images with the pipeline sequence ID or commit SHA -- never "latest" in production. You need to be able to redeploy any version from six months ago without guessing which image it was:
yaml
- step:
    type: BuildAndPushDockerRegistry
    name: Build and Push
    spec:
      connectorRef: azure_container_registry
      repo: myapp
      tags:
        - <+pipeline.sequenceId>
        - <+trigger.commitSha>
Stage 3: Static Analysis and Security Scanning
Run SAST on every PR. DAST is often run asynchronously (e.g., nightly or pre-release) due to runtime and environment requirements -- it's slower and will add minutes to every commit if you run it inline. Container scanning happens before the image lands in Azure Container Registry. Block the push if critical vulnerabilities are found; don't flag and continue.
Stage 4: Artifact Publishing
Validated images push to Azure Container Registry. Deployment packages go to your artifact store. Nothing reaches Azure environments without passing stages 2 and 3.
Stage 5: Infrastructure Provisioning
IaC definitions -- Bicep, ARM, or Terraform -- apply any environment changes before application artifacts deploy. Infrastructure and application deployments should be independent pipelines where possible. Coupling them couples their blast radii.
Stage 6: Staging Deployment and Integration Tests
Deploy to staging first. Run smoke tests and integration tests against real infrastructure. Review testing methodologies for CD pipelines to validate the release before production. This is where environment-specific bugs surface: network policies, service mesh configs, secrets management -- things unit tests don't catch.
Stage 7: Production Deployment with Progressive Delivery
Deploy to production using your chosen strategy. For canary: configure traffic weights in Azure Front Door, Application Gateway, or your AKS ingress controller. Automate the traffic ramp -- don't rely on manual weight adjustments at each stage.
Stage 8: Post-Deployment Verification
Harness AI-assisted deployment verification watches error rates, p95 latency, pod restart counts, and relevant business metrics (conversion rate, checkout completion) for at least 30 minutes post-deployment. If a threshold is breached, the pipeline rolls back without waiting for a human to notice.
Example rollback trigger thresholds:
- Error rate increases more than 0.2% over baseline → auto rollback
- p95 latency increases more than 50ms over baseline → auto rollback
- Pod restart count increases more than 3x → halt rollout, alert on-call
Infrastructure as Code for Azure: Keep Environments Consistent
Manual Azure resource changes create configuration drift. When production diverges from what your IaC defines, incidents become harder to diagnose because you can't be certain what state the environment is actually in.
The rule: if a change isn't in code, it doesn't happen in production. That applies to VM sizes, network security groups, Key Vault access policies, AKS node pool configs -- everything.
What IaC actually gives you:
- Version control for infrastructure. Every change is in a PR, reviewable, and revertible.
- Reproducible environments. Spin up a staging environment that mirrors production exactly, run your tests, tear it down.
- Drift detection. Automated checks compare the live Azure environment against your IaC definitions. If they diverge, you get an alert or auto-remediation.
- Audit trails. Compliance teams can see what changed, when, and who approved it -- without digging through Azure activity logs.
Harness Infrastructure as Code Management adds drift detection, cost visibility, and policy enforcement directly in the pipeline. A Terraform plan that would provision resources over budget threshold fails the policy check before apply runs.
Progressive Delivery in Azure
Traditional deployments push everything to everyone at once. If something is broken, every user hits it simultaneously. Progressive delivery replaces that with a controlled ramp.
The technical mechanics depend on your Azure service:
- AKS: Weighted ingress routing using NGINX ingress or Azure Application Gateway Ingress Controller.
- Azure App Service: Deployment slots with traffic splitting configured via Azure CLI or portal.
- Multi-region: Weighted routing rules in Azure Front Door.
The operational pattern is the same regardless: start at 1-5% of traffic, define automated rollback triggers before the deployment starts, measure for at least 15-30 minutes per stage, and expand only when metrics confirm the release is healthy.
What makes this work at scale is automated deployment verification. Instead of an engineer watching dashboards at every ramp stage, the system watches metrics and halts or rolls back if guardrails are breached.
Feature Flags in Azure Deployments: Separate Deployment from Release
Deploying code and releasing features to users are two different pipeline stages. Feature flags are how you keep them separate.
When you ship behind flags, code deploys to Azure in an off state. The flag controls which users see it, when, and at what percentage. No high-stakes launch moment -- you ramp exposure the same way you'd ramp a canary.
This matters most in complex Azure architectures where services deploy independently. A new API version can deploy across your AKS cluster while the flag gates user-facing exposure until every downstream service is ready. No coordinated rollout timing. No deployment freeze while other services catch up.
How Flags Integrate with the Azure CI/CD Pipeline
The flag lives in application code. The pipeline deploys the code; Harness Feature Management controls flag state. Those are independent systems.
javascript
// Feature flag check in application code
const isNewCheckoutEnabled = await featureFlags.isEnabled('new-checkout', {
  userId: user.id,
  region: user.region
});

if (isNewCheckoutEnabled) {
  return newCheckoutFlow(cart);
} else {
  return legacyCheckoutFlow(cart);
}
Patterns That Work Well for Azure Deployments
Ship dark, release progressively. Deploy to all Azure regions behind a flag. Enable for internal users first. Validate against real infrastructure without external exposure. Then ramp: 1%, 5%, 25%, 100% -- each step gated by metrics.
Region-by-region rollouts. Target Azure regions sequentially using flag targeting rules. East US first; if error rates hold for 24 hours, enable in West Europe. No new deployment required to expand.
A/B test infrastructure changes. Testing a new AKS node type or a different caching layer? Harness Experimentation lets you route a percentage of workloads to the new configuration and compare against guardrail metrics with statistical validity -- not gut feel.
Release monitoring at the feature level. System-level monitoring tells you error rate is up 0.3%. Harness Release Monitoring tells you the new checkout variant is adding 40ms of p95 latency. The second tells you what to fix.
Warehouse-Native Experimentation
For teams running Azure Synapse Analytics or Azure Databricks, warehouse-native experimentation computes experiment results directly in your data warehouse -- no ETL pipelines, no data export, no additional latency in your analysis.
GitOps for Azure: Git as the Source of Truth
GitOps applies the same version-control workflow you use for application code to your Azure infrastructure and deployment configuration. Desired state lives in the repo. The live Azure environment is continuously reconciled against it.
For AKS workloads, the GitOps loop runs like this:
- Engineer opens a PR with a Kubernetes manifest change.
- PR is reviewed, approved, and merged to main.
- GitOps controller detects the diff between desired state (repo) and live state (cluster).
- Controller applies the change to the AKS cluster automatically.
- If the live state drifts from the repo at any point -- manual kubectl change, failed sync -- the controller flags it or auto-remediates.
Every infrastructure change goes through code review. Every rollback is a revert commit. Audit trail is automatic.
Harness GitOps provides enterprise-grade GitOps with the audit trails, RBAC, and governance controls that Azure production environments demand -- without the operational overhead of managing Argo CD clusters yourself. The same discipline applies beyond Kubernetes: GitOps principles on ARM definitions, Bicep modules, or Terraform workspaces mean every Azure environment change follows the same review-approve-apply workflow as application code.
Governance and Policy in Azure Deployments
At enterprise scale, governance needs to be pipeline-native -- not a checklist that runs after deployment. Policy as Code applies compliance rules directly inside your Azure deployment pipelines, replacing manual approval checklists with automated checks that run before anything reaches production.
Harness DevOps Pipeline Governance enforces this at every stage:
- Required security gates. SAST, SCA, and container scanning run automatically on every PR and build. Critical findings block promotion to production. Policy enforcement is in the pipeline -- no human bottleneck.
- Immutable audit logs. Every deployment, approval, flag change, and rollback is timestamped and attributed. Required for SOX, HIPAA, or ISO 27001 compliance in Azure environments.
- Environment-specific approvals. Staging promotes automatically; production requires sign-off. The approval workflow lives in the pipeline definition, not in someone's email inbox.
- Cost guardrails. Policy checks block Terraform plans that would provision Azure resources over budget thresholds. Catch infrastructure cost overruns before apply runs, not after the invoice arrives.
Azure Deployment Best Practices
These are the patterns that separate teams shipping confidently on Azure from teams that dread release day.
- Never deploy directly to production. Even for "tiny" changes. Every change goes through at least one pre-production environment with automated testing.
- Make every deployment artifact immutable. Tag container images with commit SHAs. You should be able to redeploy any version from six months ago in under five minutes, without digging through Slack to figure out which image tag it was.
- Decouple infrastructure and application deployments. Changing Azure resources and changing application code should be separate pipelines. Coupling them couples their blast radii.
- Define rollback before you deploy. Every deployment needs a rollback plan -- and ideally, an automated one. If rollback requires more than a button click, simplify the pipeline.
- Monitor at the feature level, not just the system level. "Error rate is up 0.3%" tells you something is wrong. "The new checkout variant is causing a 12% increase in cart abandonment," tells you what to fix.
- Treat configuration as code. Azure App Configuration values, Key Vault references, and environment variables belong in version control and deploy through the same pipeline as application code.
- Ship continuously, not on a schedule. The longer the gap between deployments, the more changes are bundled, the harder it is to isolate what broke. Continuous delivery with small, frequent deploys reduces the cost of every individual change.
How Harness Powers Azure Deployment at Scale
Teams shipping to Azure need CI, CD, feature management, infrastructure automation, and observability connected into a single workflow -- with the governance controls that enterprise Azure environments require.
Harness gives Azure teams:
- Continuous Integration with intelligent test selection, incremental builds and pipeline caching, and pipeline analytics that eliminate build bottlenecks.
- Continuous Delivery with canary, blue-green, and rolling strategies built in -- including AI-assisted deployment verification that watches metrics and rolls back without human intervention.
- Infrastructure as Code Management for Terraform and Bicep workflows with drift detection, cost visibility, and policy enforcement.
- Feature Management & Experimentation to decouple deployment from release, run A/B tests against real Azure traffic, and monitor at the feature level.
- CD data visualization to track deployment frequency, lead time, and change failure rate across your Azure environments.
The result: Azure deployments that are faster, safer, and measurably better -- with the data to prove it.
Azure Deployment: Frequently Asked Questions
What is the difference between Azure deployment and Azure DevOps?
Azure deployment is the process of releasing application code or infrastructure changes to Azure cloud resources. Azure DevOps is Microsoft's platform for managing source control, CI/CD pipelines, work items, and artifact management. You can use Azure DevOps to orchestrate deployments, but it's one of several tools that can do so. Harness provides Azure deployment capabilities with enterprise-grade progressive delivery, feature management, and governance that extend beyond native Azure Pipelines.
What Azure deployment strategy should I use for a high-traffic application?
For high-traffic Azure applications, canary deployments offer the best balance of safety and speed. Start at 1% of traffic, watch error rates and p95 latency closely, and ramp to 5%, 25%, and 100% as metrics confirm health. Define automated rollback triggers at each stage before the deployment starts.
Blue-green deployments work well when you need instant rollback capability and can absorb double the infrastructure cost during deployment windows. Rolling deployments suit stateless workloads where brief mixed-version operation is acceptable, as long as API and schema changes are backward-compatible.
How do feature flags fit into an Azure CI/CD pipeline?
Feature flags integrate at the application code level, not the pipeline level. Code deploys to Azure with new features disabled behind flag checks. The deployment pipeline handles getting code to Azure; the feature flag controls which users see the new functionality and when. This lets your pipeline run continuously -- shipping every commit -- while you control feature exposure independently through feature management.
How do I prevent configuration drift in Azure?
Define all Azure resources in Infrastructure as Code -- Bicep, ARM templates, or Terraform -- and enforce a policy that no manual changes are made to production environments directly. Automated drift detection continuously compares the live Azure environment against the desired state in your IaC definitions and alerts (or auto-remediates) when they diverge.
What metrics should I watch during an Azure deployment?
At minimum: HTTP error rates (watch for increases above 0.2% over baseline), p95 and p99 latency (degradation shows here before average latency moves), pod restart counts for AKS workloads, and relevant business metrics like conversion rate or checkout completion.
Monitor at the feature or deployment level, not just at the infrastructure level. "Error rate is up" tells you something is wrong. "Feature X caused a 15% increase in checkout errors" tells you what to fix.
Can I run A/B tests on Azure infrastructure changes, not just product features?
Yes. Experimentation works for engineering validation as well as product changes. Route a percentage of AKS workloads to a new node type, compare caching strategies, or test a new database configuration -- all with the same statistical guardrails you'd apply to a UI experiment. For teams with Azure Synapse Analytics, warehouse-native experimentation computes results directly in your data warehouse without additional ETL overhead.

Mainframe DevOps: Modern CI/CD for Big Iron
For Platform Engineering teams, the goal has always been clear: build a secure, scalable internal developer platform that reduces cognitive load and accelerates time-to-market. Yet, a massive obstacle often remains hidden in plain sight: the mainframe.
While your distributed teams are shipping cloud-native microservices multiple times a day, your core backend mainframe applications frequently remain locked in an isolated silo, lagging behind on slow monthly or quarterly cadences.
The reality of modern enterprise software is deeply interconnected. A single customer-facing feature might require an update to a mobile front-end running in the cloud, an API layer, and a core COBOL application running on a mainframe. When these components are fractured across disconnected deployment tools, it creates an operational nightmare for platform teams.
It is time to eliminate the legacy boundaries. Here is how you can bring mainframe applications out of isolation and orchestrate them alongside your distributed, cloud-native stack using a single, unified developer platform.
One strategic CI/CD platform
Maintaining separate toolchains (modern CI/CD platforms for the cloud and legacy, script-heavy workflows for the mainframe) forces platform teams to absorb massive technical debt.
- Eliminate Toolchain Chaos: Operating disparate point solutions for different hosting tiers compounds your team's maintenance overhead and integration toil.
- Consolidate Visibility and Insights: Fragmented tools create a complete blind spot. Without a single pane of glass, it is nearly impossible for platform leads to pull accurate, process-agnostic DORA metrics across the entire enterprise portfolio.
- Mitigate Release Coordination Risk: When complex applications have mainframe backends and distributed front-ends, cross-tier releases quickly turn into a chaotic mess of manual spreadsheets, endless sync meetings, and high change failure rates.
By pulling mainframe applications into the same automated platform that governs your cloud environments, you deliver a consistent developer experience, enforce centralized standards, and significantly reduce total cost of ownership (TCO).
With advances in mainframe build-and-deploy tooling, orchestration is easier than ever.
See Mainframe CI/CD in Action
Want to see how easy it is to replace manual compilation and deployment routines with an elegant, visual pipeline template? Watch this brief demonstration highlighting the end-to-end integration between modern orchestration, IBM DBB, and Wazi Deploy:
Modern Mainframe Pipelines: Declarative, Automated, and Secure
Bringing modern CI/CD to the mainframe doesn't require a risky architectural rewrite; it requires wrapping your "Big Iron" infrastructure in a modern, pipeline-driven automation layer. Harness seamlessly integrates with your existing IBM ecosystem and your broader DevSecOps toolchain to make mainframe delivery as repeatable and secure as any cloud deployment.
1. Automated, Smart Builds with IBM DBB
Instead of relying on tribal knowledge or manual build scripts, your platform can natively trigger utilities like IBM Dependency Based Build (DBB). Your centralized continuous integration pipeline orchestrates the workflow, while DBB analyzes code changes and manages dependencies to compile only what is necessary directly on z/OS.
2. Shift-Left Security Gates
Incorporate policy-as-code and automated security scanning tools directly into the mainframe lifecycle. By embedding static analysis or open-source vulnerability scans straight into the pipeline, you can flag risks early and prevent security issues from escaping into production without adding developer friction.
3. Standardized Deployments with Wazi Deploy
When binaries are ready to move through your testing and production environments, the platform handles the deployment mechanics by executing IBM Wazi Deploy. This replaces highly customized, brittle deployment scripts with a structured, declarative configuration that updates application components natively on z/OS.
Taming Complex, Multi-Service Releases
The biggest win for a Platform Engineering Lead is solving the "pipeline of pipelines" dilemma. When a synchronized product release requires coordinating dependencies across separate teams, technologies, and cadences, you need a powerful orchestration engine.
Harness moves beyond isolated, single-service pipelines to provide Enterprise Release Orchestration. This gives your platform team a visual, unified calendar and workflow engine to cleanly sequence dependencies across both distributed and mainframe pipelines.
Every action is governed by granular, environment-aware role-based access control (RBAC), built-in approval workflows (such as Jira or ServiceNow integrations), and a comprehensive, immutable audit trail. If a deployment fails at any tier, the platform provides immediate visibility into the root cause, protecting system uptime and shielding your organization from compliance risks.

Reduce CI Costs Without Slowing Down Development
Continuous integration (CI) costs can escalate quickly as engineering teams scale. While most organizations focus on cloud bills, the true cost of CI includes slow build times, developer wait time, inefficient test execution, and overprovisioned infrastructure.
CI cost optimization is the practice of reducing the total cost of CI pipelines by improving build efficiency, minimizing compute usage, and eliminating unnecessary work without slowing down development.
In this guide, you will learn how to reduce CI costs using four proven strategies: test optimization, intelligent caching, infrastructure right-sizing, and governance controls. Teams that implement these approaches often reduce build times and costs by 50 to 75 percent, while improving developer productivity and feedback cycles.
What Are CI Costs?
CI costs extend far beyond your cloud invoice. They include both direct infrastructure expenses and indirect productivity losses.
Direct costs:
- Compute resources such as build runners, containers, and virtual machines
- Storage for artifacts, caches, and logs
- Networking and data transfer
Indirect costs:
- Developer wait time during slow builds
- Context switching due to pipeline failures
- Time spent debugging flaky tests
- Engineering effort maintaining CI infrastructure
Why this matters
Research on developer productivity shows that interruptions can take 15 to 25 minutes to recover focus. When builds are slow or unreliable, this hidden cost compounds across teams and often exceeds infrastructure spend.
What Drives CI Costs?
CI costs are primarily driven by four factors:
- Build duration: which increases compute usage
- Test execution volume: which expands the runtime
- Infrastructure inefficiency: which resources waste the budget
- Pipeline design: which can create redundant work
Understanding these drivers is the first step toward meaningful cost reduction.
Strategy 1: Optimize Your Testing
Testing is typically the largest contributor to CI runtime and cost. Optimizing test execution delivers the highest return on investment.
Selective Test Execution
Most teams run their full test suite on every commit. This is inefficient, especially in large repositories.
Selective test execution runs only the tests affected by a code change.
Benefits:
- Reduces test volume by 50 to 80 percent
- Shortens feedback loops
- Lowers compute usage
For example, large engineering teams using test selection techniques have reduced build times from more than 20 minutes to under five minutes, saving significant developer time.
Flaky Test Management
Flaky tests are tests that fail intermittently without code changes. They introduce hidden costs:
- Trigger unnecessary reruns
- Reduce trust in CI results
- Waste developer time
Industry studies suggest flaky tests consume a measurable portion of engineering productivity.
Best practices:
- Automatically detect flaky tests
- Quarantine them so they do not block pipelines
- Track flaky test rate and aim for less than 2 percent
- Prioritize fixes based on impact
Test Parallelization
Running tests sequentially is inefficient.
Parallelization distributes tests across multiple runners, reducing execution time.
Example:
- Sequential execution: 30 minutes
- Parallel execution: 5 to 10 minutes
Parallelization may not significantly reduce total compute usage, but it dramatically reduces developer wait time, which is often the larger cost.
Strategy 2: Implement Intelligent Caching
CI pipelines often repeat the same work, such as downloading dependencies or rebuilding artifacts.
Caching reduces redundant work by reusing previous outputs.
What to Cache
High-impact caching targets include:
- Dependency packages such as npm, Maven, or Gradle
- Docker image layers
- Build artifacts
- Compiled modules
How to Cache Effectively
An effective caching strategy includes:
- Cache keys based on lockfiles or commit hashes
- Proper cache invalidation to avoid stale artifacts
- Storage optimization to balance speed and cost
- Security practices to avoid caching sensitive data
Real Impact
In controlled benchmarks, Docker layer caching and dependency reuse have shown significant improvements in build performance.
However, many teams underutilize caching by applying it inconsistently or misconfiguring cache keys.
Key insight:
There is a difference between simply enabling caching and implementing a well-optimized caching strategy.
Strategy 3: Use Cost-Effective Infrastructure
CI workloads are well-suited for cost optimization because they are stateless, short-lived, and parallelizable.
Use Spot Instances
Cloud providers offer spot instances at discounts of up to 90 percent compared to on-demand pricing.
Why they work for CI:
- Builds are short-lived
- Interruptions can be retried
- Workloads are fault-tolerant
Important nuance:
Retries are usually manageable, but frequent interruptions can impact time-sensitive pipelines.
Right-Size Build Runners
Many teams use oversized instances by default.
Right-sizing involves:
- Monitoring CPU and memory usage
- Matching workloads to appropriate instance types
- Eliminating overprovisioning
This reduces cost without affecting performance.
Enable Auto-Scaling
Static runner pools create inefficiencies:
- Idle resources during low demand
- Bottlenecks during peak demand
Auto-scaling allows:
- Scaling up during high activity
- Scaling down during idle periods
Real-World Outcome
Teams that optimize infrastructure often achieve:
- 30 to 50 percent cost reduction
- Faster build times
- Better resource utilization
Strategy 4: Implement Governance and Cost Controls
Without guardrails, CI costs tend to increase over time.
Common Cost Issues
- Oversized runners in new pipelines
- Redundant workflows
- Excessive environments
- Untracked cost growth
Policy as Code
Policy as Code enables automated enforcement of cost controls.
Examples:
- Limit maximum runner size
- Restrict expensive configurations
- Enforce caching usage
- Standardize pipeline templates
Tools such as Open Policy Agent are commonly used for this purpose.
Improve Visibility
You cannot optimize what you cannot measure.
Key metrics include:
- Cost per build
- Build duration, including median and P95
- Failure rate
- Flaky test rate
- Cost by team or pipeline
Dashboards and analytics help identify inefficiencies and cost drivers.
How to Measure CI Costs
To reduce CI costs effectively, start with clear metrics.
Core Metrics
- Cost per build
- Cost per developer
- Build duration
- Queue time
- Failure rate
Benchmarking Progress
Establish a baseline and track improvements:
A Practical Roadmap to Reduce CI Costs in 3 to 6 Months
A phased approach helps teams implement changes effectively.
Month 1: Baseline and Quick Wins
- Measure current performance
- Enable dependency and Docker caching
- Identify slow pipelines
The expected impact is a 30 to 50 percent improvement.
Months 2 to 3: Test Optimization
- Implement selective test execution
- Parallelize test suites
- Identify and isolate flaky tests
This phase delivers the largest improvements.
Months 4 to 6: Infrastructure and Governance
- Right-size runners
- Introduce spot instances
- Enable auto-scaling
- Implement Policy as Code
This ensures long-term cost control.
Why Modern CI Platforms Simplify Cost Optimization
These strategies can be implemented manually, but doing so requires significant effort.
Modern CI platforms provide:
- Automated test selection
- Intelligent caching
- Cloud-native execution environments
- Built-in cost visibility
This reduces operational overhead and improves consistency.
Key Takeaways
- CI costs include both infrastructure spend and developer productivity loss
- Test optimization and caching deliver the highest return
- Infrastructure right-sizing reduces waste
- Governance prevents cost increases over time
- Teams can reduce CI costs by 50 to 75 percent within months
Conclusion
CI costs do not have to scale with your team size. By focusing on efficiency, you can reduce costs while improving developer experience.
The most effective strategies are:
- Reducing unnecessary tests
- Implementing caching
- Optimizing infrastructure
- Enforcing governance
The key difference is not just tooling but intentional optimization.
Call to Action
Want to reduce CI costs without slowing development?
Explore how modern CI platforms can help optimize test execution, caching, and infrastructure, so your team can build faster while reducing spend.
Frequently Asked Questions
What is the highest hidden cost in CI?
Developer wait time. Slow builds reduce productivity and increase context switching.
How much can CI costs be reduced?
Most teams achieve 30 to 75 percent cost reduction, depending on their starting point.
Is it safe to use spot instances for CI?
Yes. CI workloads are well-suited for spot instances, though retries may occasionally occur.
Where should teams start?
Start with:
- Measuring baseline metrics
- Enabling caching
- Optimizing test execution

The pipeline that never reached production
How template-driven CD prevents governance drift
Modern CI/CD platforms allow engineering teams to ship software faster than ever before.
Pipelines complete in minutes. Deployments that once required carefully coordinated release windows now happen dozens of times per day. Platform engineering teams have succeeded in giving developers unprecedented autonomy, enabling them to build, test, and deploy their services with remarkable speed.
Yet in highly regulated environments-especially in the financial services sector-speed alone cannot be the objective.
Control matters. Consistency matters. And perhaps most importantly, auditability matters.
In these environments, the real measure of a successful delivery platform is not only how quickly code moves through a pipeline. It is also how reliably the platform ensures that production changes are controlled, traceable, and compliant with governance standards.
Sometimes the most successful deployment pipeline is the one that never reaches production.
This is the story of how one enterprise platform team redesigned their delivery architecture to ensure that production pipelines remained governed, auditable, and secure by design.
The subtle risk in fast CI/CD platforms
A large financial institution had successfully adopted Harness for CI and CD across multiple engineering teams.
From a delivery perspective, the transformation looked extremely successful. Developers were productive, teams could create pipelines quickly, and deployments flowed smoothly through various non-production environments used for integration testing and validation. From the outside, the platform appeared healthy and efficient.
But during a platform architecture review, a deceptively simple question surfaced:
“What prevents someone from modifying a production pipeline directly?”
There had been no incidents. No production outages had been traced back to pipeline misconfiguration. No alarms had been raised by security or audit teams.
However, when the platform engineers examined the system more closely, they realized something concerning.
Production pipelines could still be modified manually.
In practice this meant governance relied largely on process discipline rather than platform enforcement. Engineers were expected to follow the right process, but the platform itself did not technically prevent deviations. In regulated industries, that is a risky place to be.
The architecture shift: separate authoring from execution
The platform team at the financial institution decided to rethink the delivery architecture entirely. Their redesign was guided by a simple but powerful principle:
Pipelines should be authored in a non-prod organization and executed in the production organization. And, if additional segregation was needed due to compliance, the team could decide to split into two separate accounts.
Authoring and experimentation should happen in a safe environment. Execution should occur in a controlled one.
Instead of creating additional tenants or separate accounts, the platform team decided to go with a dedicated non-prod organization within the same Harness account. This organization effectively acted as a staging environment for pipeline design and validation.
Architecture diagram
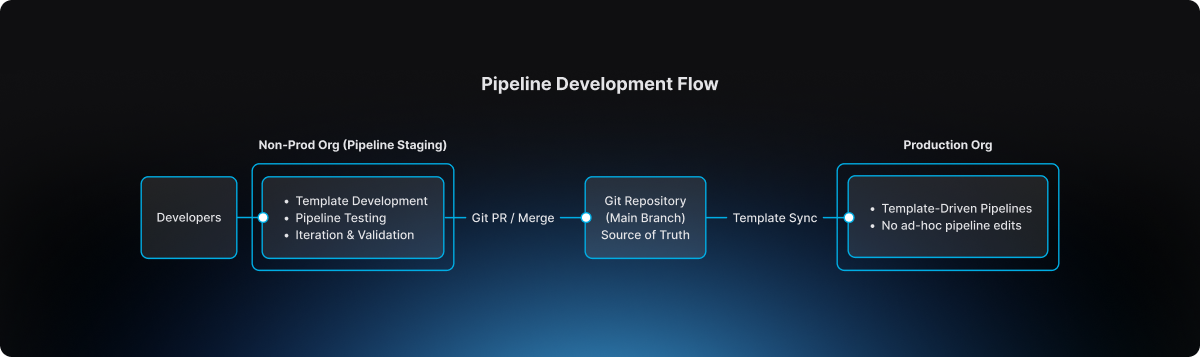
This separation introduced a clear lifecycle for pipeline evolution.
The non-prod organization became the staging environment where pipeline templates could be developed, tested, and refined. Engineers could experiment safely without impacting production governance.
The production organization, by contrast, became an execution environment. Pipelines there were not designed or modified freely. They were consumed from approved templates.
Guardrail #1: production pipelines must use templates
The first guardrail introduced by the platform team was straightforward but powerful.
Production pipelines must always be created from account-level templates.
Handcrafted pipelines were no longer allowed. Project-level template shortcuts were also prohibited, ensuring that governance could not be bypassed unintentionally.
This rule was enforced directly through OPA policies in Harness.
Example policy
package harness.cicd.pipeline

deny[msg] {
  template_scope := input.pipeline.template.scope
  template_scope != "account"
  msg = "pipeline can only be created from account level pipeline template"
}
This policy ensured that production pipelines were standardized by design. Engineers could not create or modify arbitrary pipelines inside the production organization. Instead, they were required to build pipelines by selecting from approved templates that had been validated by the platform team.
As a result, production pipelines ceased to be ad-hoc configurations. They became governed platform artifacts.
Guardrail #2: governance starts in the non-prod organization
Blocking unsafe pipelines in production was only part of the solution.
The platform team realized it would be even more effective to prevent non-compliant pipelines earlier in the lifecycle.
To accomplish this, they implemented structural guardrails within the non-prod organization used for pipeline staging. Templates could not even be saved unless they satisfied specific structural requirements defined by policy.
For example, templates were required to include mandatory stages, compliance checkpoints, and evidence collection steps necessary for audit traceability.
Example policy
package harness.ci_cd

deny[msg] {
  input.templates[_].stages == null
  msg = "Template must have necessary stages defined"
}

deny[msg] {
  some i
  stages := input.templates[i].stages
  stages == [Evidence_Collection]
  msg = "Template must have necessary stages defined"
}
These guardrails ensured that every template contained required compliance stages such as Evidence Collection, making it impossible for teams to bypass mandatory governance steps during pipeline design.
Governance, in other words, became embedded directly into the pipeline architecture itself.
The source of truth: Git
The next question the platform team addressed was where the canonical version of pipeline templates should reside.
The answer was clear: Git must become the source of truth.
Every template intended for production usage lived inside a repository where the main branch represented the official release line.
Direct pushes to the main branch were blocked. All changes required pull requests, and pull requests themselves were subject to approval workflows that mirrored enterprise change management practices.
Governance flow
.png)
This model introduced peer review, immutable change history, and a clear traceability chain connecting pipeline changes to formal change management records.
For auditors and platform leaders alike, this was a significant improvement.
The promotion workflow
Once governance mechanisms were in place, the promotion workflow itself became predictable and repeatable.
Engineers first authored and validated templates within the non-prod organization used for pipeline staging. There they could test pipelines using real deployments in controlled non-production environments.
The typical delivery flow followed a familiar sequence:
After validation, the template definition was committed to Git through a branch and promoted through a pull request. Required approvals ensured that platform engineers, security teams, and change management authorities could review the change before it reached the release line.
Once merged into main, the approved template became available for pipelines running in the production organization. Platform administrators ensured that naming conventions and version identifiers remained consistent so that teams consuming the template could easily track its evolution.
Finally, product teams created their production pipelines simply by selecting the approved template. Any attempt to bypass the template mechanism was automatically rejected by policy enforcement
The day the model proved its value
Several months after the new architecture had been implemented, an engineer attempted to modify a deployment pipeline directly inside the production organization.
Under the previous architecture, that change would have succeeded immediately.
But now the platform rejected it. The pipeline violated the OPA rule because it was not created from an approved account-level template.
Instead of modifying the pipeline directly, the engineer followed the intended process: updating the template within the non-prod organization, submitting a pull request, obtaining the necessary approvals, merging the change to Git main, and then consuming the updated template in production.
The system had behaved exactly as intended. It prevented uncontrolled change in production.
Why this model works
The architecture introduced by the large financial institution delivered several key guarantees.
Production pipelines are standardized because they originate only from platform-approved templates. Governance is preserved because Git main serves as the official release line for pipeline definitions. Auditability improves dramatically because every pipeline change can be traced back to a pull request and associated change management approval. Finally, platform administrators retain the ability to control how templates evolve and how they are consumed in production environments.
The lesson for platform teams
Pipelines are often treated as simple automation scripts.
In reality they represent critical production infrastructure.
They define how code moves through the delivery system, how security scans are executed, how compliance evidence is collected, and ultimately how deployments reach production environments. If pipeline creation is uncontrolled, the entire delivery system becomes fragile.
The financial institution solved this problem with a remarkably simple model. Pipelines are built in the non-prod staging organization. Templates are promoted through Git governance workflows. Production pipelines consume those approved templates.
Nothing more. Nothing less.
Final takeaway
Modern CI/CD platforms have dramatically accelerated the speed of software delivery.
But in regulated environments, the true achievement lies elsewhere. It lies in building a platform where developers move quickly, security remains embedded within the delivery workflow, governance is enforced automatically, and production environments remain protected from uncontrolled change.
That is not just CI/CD. That is platform engineering done right.

Regression Testing in CI/CD: Deliver Faster Without the Fear
A financial services company ships code to production 47 times per day across 200+ microservices. Their secret isn't running fewer tests; it's running the right tests at the right time.
Modern regression testing must evolve beyond brittle test suites that break with every change. It requires intelligent test selection, process parallelization, flaky test detection, and governance that scales with your services.
Harness Continuous Integration brings these capabilities together: using machine learning to detect deployment anomalies and automatically roll back failures before they impact customers. This framework covers definitions, automation patterns, and scale strategies that turn regression testing into an operational advantage. Ready to deliver faster without fear?
What Is Regression Testing? (A Real-world Example)
Managing updates across hundreds of services makes regression testing a daily reality, not just a testing concept. Regression testing in CI/CD ensures that new code changes don’t break existing functionality as teams ship faster and more frequently. In modern microservices environments, intelligent regression testing is the difference between confident daily releases and constant production risk.
- The Simple Definition: Regression testing is the practice of re-running existing tests after code changes to ensure nothing that previously worked is unintentionally broken. Instead of validating new features, it safeguards stable functionality across your application.
- When Small Changes Create Big Problems: Even “low-risk” tweaks, like changing a payments API header, can silently break downstream jobs and critical flows like checkout. Regression tests catch these integration issues before production, protecting revenue and user experience.
- How This Fits Into Modern CI/CD: In modern CI/CD, regression tests run continuously on pull requests, main branch merges, and staged rollouts like canaries. In each case, the tests ensure the application continues to work as expected.
Regression Testing vs. Retesting
These terms often get used interchangeably, but they serve different purposes in your pipeline. Understanding the distinction helps you avoid both redundant test runs and dangerous coverage gaps.
- Retesting validates a specific fix. When a bug is found and patched, you retest that exact functionality to confirm the fix works. It's narrow and targeted.
- Regression testing protects everything else. After that fix goes in, regression tests verify the change didn't break existing functionality across dependent services.
In practice, you run them sequentially: retest the fix first, then run regression suites scoped to the affected services. For microservices environments with hundreds of interdependent services, this sequencing prevents cascade failures without creating deployment bottlenecks.
The challenge is deciding which regression tests to run. A small change to one service might affect three downstream dependencies, or even thirty. This is where governance rules help. You can set policies that automatically trigger retests on pull requests and broader regression suites at pre-production gates, scoping coverage based on change impact analysis rather than gut feel.
To summarize, Regression testing checks that existing functionality still works after a change. Retesting verifies that a specific bug fix works as intended. Both are essential, but they serve different purposes in CI/CD pipelines.
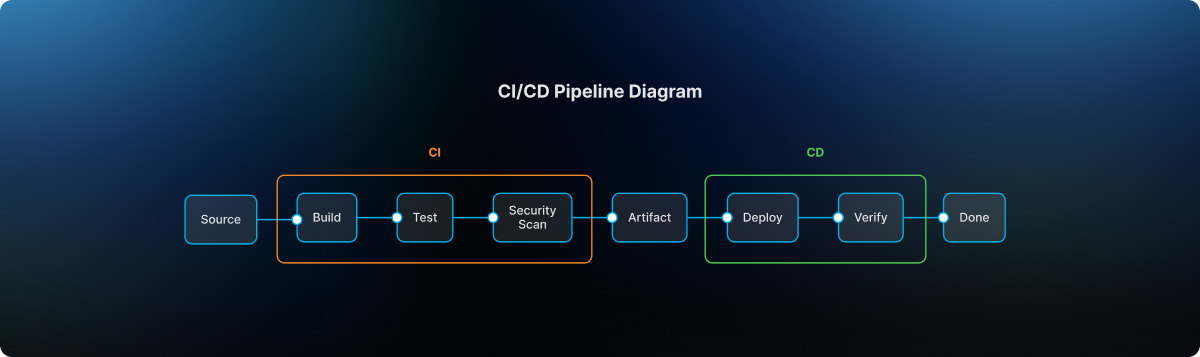
Where Regression Fits in the CI/CD Pipeline
The regression testing process works best when it matches your delivery cadence and risk tolerance. Smart timing prevents bottlenecks while catching regressions before they reach users.
- Run targeted regression subsets on every pull request to catch breaking changes within developer workflows. Keep these under 10 minutes for fast feedback.
- Execute broader suites on main branch merges using parallelization and cloud resources to compress full regression cycles from hours to minutes.
- Gate pre-production deployments with end-to-end smoke tests and contract validation before progressive rollout begins.
- Monitor live metrics during canary releases and feature experiments to detect regressions under real traffic patterns that test environments can't replicate.
- Combine synthetic monitoring with AI-powered automated rollback triggers to validate actual user impact and revert within seconds when thresholds are breached.
This layered approach balances speed with safety. Developers get immediate feedback while production deployments include comprehensive verification. Next, we'll explore why this structured approach becomes even more critical in microservices environments where a single change can cascade across dozens of services.
Why Regression Testing Matters for Microservices, Risk, and Compliance
Modern enterprises managing hundreds of microservices face three critical challenges: changes that cascade across dependent systems, regulatory requirements demanding complete audit trails, and operational pressure to maintain uptime while accelerating delivery.
Microservices Amplify Blast Radius Across Dependent Services
A single API change can break dozens of downstream services you didn't know depended on it.
- Cascade failures are the norm, not the exception. A payment schema change that seems harmless in isolation can break reconciliation jobs, notification services, and reporting pipelines across 47 dependent services. Resilience or “Chaos” testing can help you assess your exposure to cascading failures.
- Loosely coupled doesn't mean independent. NIST guidance confirms that cloud-native architectures consist of multiple components where individual changes can have system-wide impact.
- Higher deployment frequency requires higher automation. Research demonstrates that microservices require automated testing integration into CD pipelines to maintain reliability at scale.
Regulated Environments Demand Complete Audit Trails
Financial services, healthcare, and government sectors require documented proof that tests were executed and passed for every promotion.
- Compliance requires traceability. The DoD Cyber DT&E Guidebook mandates traceable test evidence for continuous authorization, noting that minor software changes can significantly impact system risk posture.
- Policy-as-code turns testing into a compliance enabler. Harness governance features enforce required test gates and generate comprehensive audit logs of every approval and pipeline execution.
- Auditors expect timestamped evidence on demand. Automated frameworks with audit logging eliminate scrambling when validation requests arrive.
Pre-Production Detection Reduces Operational Costs and MTTR
Catching regressions before deployment saves exponentially more than fixing them during peak traffic.
- The math is simple. A failed regression test costs developer time; a production incident costs customer trust, revenue, and weekend firefighting.
- Automated gates prevent breaks from reaching users. Research confirms that regression testing in pipelines stops new changes from introducing functionality failures.
- AI verification adds a final safety net. Harness detects anomalies post-deployment and triggers automated rollbacks within seconds, eliminating expensive emergency responses.
With the stakes clear, the next question is which techniques to apply.
Types of Regression Testing Techniques You'll Actually Use
Once you've established where regression testing fits in your pipeline, the next question is which techniques to apply. Modern CI/CD demands regression testing that balances thoroughness with velocity. The most effective techniques fall into three categories: selective execution, integration safety, and production validation.
Types of Regression Testing Techniques You'll Actually Use
Once you've established where regression testing fits in your pipeline, the next question is which techniques to apply. Modern CI/CD demands regression testing that balances thoroughness with velocity. The most effective techniques fall into three categories: selective execution, integration safety, and production validation—with a few pragmatic variants you’ll use day-to-day.
- Full regression suites rerun your critical end-to-end and high-value scenarios before major releases or architectural changes. They’re slower, but essential for high‑risk changes and compliance-heavy environments.
- Smoke and sanity regression focus on a small, fast set of tests that validate core flows (login, checkout, core APIs) on every commit or deployment. These suites act as your “always on” safety net.
- Unit-level regression runs targeted unit tests around recently changed modules. This is your fastest feedback loop, catching logic regressions before they ever hit cross-service integration or UI layers.
- Selective regression and test impact analysis run only the suites that exercise changed code paths, using dependency mapping to cut execution time without sacrificing confidence.
- Contract testing enforces backward compatibility through consumer-driven contracts like Pact, preventing integration failures between teams and services.
- API/UI regression testing locks in behavior at the interaction layer—REST, GraphQL, or UI flows—so refactors behind the scenes don’t break user-visible behavior.
- Performance and scalability regression ensure that latency, throughput, and resource usage don’t degrade between releases, especially for high-traffic or revenue-critical paths.
- Progressive delivery verification combines canary deployments with real-time metrics and error signals to surface regressions under actual traffic, with automated halt/rollback when thresholds are breached.
These approaches work because they target specific failure modes. Smart selection outperforms broad coverage when you need both reliability and rapid feedback.
How to Automate Regression Testing Across Your Pipeline
Managing regression testing across 200+ microservices doesn't require days of bespoke pipeline creation. Harness Continuous Integration provides the building blocks to transform testing from a coordination nightmare into an intelligent safety net that scales with your architecture.
Step 1: Generate pipelines with context-aware AI. Start by letting Harness AI build your pipelines based on industry best practices and the standards within your organization. The approach is interactive, and you can refine the pipelines with Harness as your guide. Ensure that the standard scanners are run.
Step 2: Codify golden paths with reusable templates. Create Harness pipeline templates that define when and how regression tests execute across your service ecosystem. These become standardized workflows embedding testing best practices while giving developers guided autonomy. When security policies change, update a single template and watch it propagate to all pipelines automatically.
Step 3: Enforce governance with Policy as Code. Use OPA policies in Harness to enforce minimum coverage thresholds and required approvals before production promotions. This ensures every service meets your regression standards without manual oversight.
With automation in place, the next step is avoiding the pitfalls that derail even well-designed pipelines.
Best Practices and Common Challenges (And How to Fix Them)
Regression testing breaks down when flaky tests erode trust and slow suites block every pull request. These best practices focus on governance, speed optimization, and data stability.
- Quarantine flaky tests automatically using policy enforcement and require test owners before suite re-entry. Research shows flaky tests reproduce only 17-43% of the time, making governance more effective than debugging individual failures.
- Parallelize and shard test execution across multiple agents to keep PR feedback under 5 minutes.
- Apply test impact analysis to run only tests affected by code changes, reducing unnecessary execution.
- Provision ephemeral test environments with seeded datasets to eliminate data drift between runs.
- Use contract-backed mocks for external dependencies to ensure consistent test behavior.
- Add AI-powered verification as a final backstop to catch regressions that slip past test suites.
Turn Regression Testing Into a Safety Net, Not a Speed Bump
Regression testing in CI/CD enables fast, confident delivery when it’s selective, automated, and governed by policy. Regression testing transforms from a release bottleneck into an automated protection layer when you apply the right strategies. Selective test prioritization, automated regression gates, and policy-backed governance create confidence without sacrificing speed.
The future belongs to organizations that make regression testing intelligent and seamless. When regression testing becomes part of your deployment workflow rather than an afterthought, shipping daily across hundreds of services becomes the norm.
Ready to see how context-aware AI, OPA policies, and automated test intelligence can accelerate your releases while maintaining enterprise governance? Explore Harness Continuous Integration and discover how leading teams turn regression testing into their competitive advantage.
FAQ: Practical Answers for Regression Testing in CI/CD
These practical answers address timing, strategy, and operational decisions platform engineers encounter when implementing regression testing at scale.
When should regression tests run in a CI/CD pipeline?
Run targeted regression subsets on every pull request for fast feedback. Execute broader suites on the main branch merges with parallelization. Schedule comprehensive regression testing before production deployments, then use core end-to-end tests as synthetic testing during canary rollouts to catch issues under live traffic.
How do we differentiate regression testing from retesting in practice?
Retesting validates a specific bug fix — did the payment timeout issue get resolved? Regression testing ensures that the fix doesn’t break related functionality like order processing or inventory updates. Run retests first, then targeted regression suites scoped to affected services.
How much regression coverage is enough for production?
There's no universal number. Coverage requirements depend on risk tolerance, service criticality, and regulatory context. Focus on covering critical user paths and high-risk integration points rather than chasing percentage targets. Use policy-as-code to enforce minimum thresholds where compliance requires it, and supplement test coverage with AI-powered deployment verification to catch regressions that test suites miss.
Should we run full regression suites on every commit?
No. Full regression on every commit creates bottlenecks. Use change-based test selection to run only tests affected by code modifications. Reserve comprehensive suites for nightly runs or pre-release gates. This approach maintains confidence while preserving velocity across your enterprise delivery pipelines.
What's the best way to handle flaky tests without blocking releases?
Quarantine flaky tests immediately, rather than letting them block pipelines. Tag unstable tests, move them to separate jobs, and set clear SLAs for fixes. Use failure strategies like retry logic and conditional execution to handle intermittent issues while maintaining deployment flow.
How do we maintain regression test quality at scale?
Treat test code with the same rigor as application code. That means version control, code reviews, and regular cleanup of obsolete tests. Use policy-as-code to enforce coverage thresholds across teams, and leverage pipeline templates to standardize how regression suites execute across your service portfolio.
Harness Recognized as a Customer Educator in Wiz’s WIN Partner Index 2025
We’re excited to share that Harness has been recognized as a Customer Educator in the Wiz Integration Network (WIN) Partner Index 2025—a new, data-driven benchmark highlighting the integrations that deliver the most value to joint customers in modern cloud security programs.
Published by Wiz, the WIN Partner Index provides a transparent, real-world view into the integrations that are essential to modern cloud security programs, based on real-world adoption and impact. It also establishes a clear industry standard for what constitutes a high-quality, customer-centric integration .
What It Means to Be a “Customer Educator”
Harness’s recognition as a Customer Educator reflects our commitment to helping security, platform, and DevOps teams not only integrate security into their delivery pipelines—but truly understand and act on it.
As cloud security becomes increasingly distributed across tools and teams, education and shared context are essential. Harness and Wiz work together to meet teams where they build and deploy software, enabling security insights to flow directly into CI/CD pipelines and developer workflows. The result: faster remediation, better prioritization, and security that scales without slowing innovation.
“At Harness, we believe application security has to be integrated early and continuously across the SDLC, and that requires an open ecosystem. This recognition from Wiz reflects our commitment to helping security, platform, and DevOps teams not only integrate security into their delivery pipelines, but truly understand and act on it,” says Monish Advani, Senior Director of Product Management for Application Security at Harness. “In addition to the security capabilities built natively into the Harness platform, our integration with Wiz brings critical cloud security context so customers can prioritize risk, automate response, and scale security with the flexibility to build the security stack that works best for them, no matter which tools they use. Together, we are helping teams deliver software more securely.”
Building on a Strong Partnership with Wiz
This recognition builds on a growing history of collaboration between Harness and Wiz:
- WINvaluable Award (2025): Harness was previously recognized by Wiz for delivering exceptional value to joint customers as part of its ecosystem of over 200 integrations.
- First Certified CI/CD Platform Partner: Harness became the first CI/CD platform vendor certified to partner with Wiz, reinforcing our shared vision of embedding security early and continuously across the software delivery lifecycle.
- End-to-End Security Visibility: Through Harness’s security capabilities—strengthened by our joint solution with Wiz and Traceable—customers gain deeper visibility from code to cloud, correlating risks across APIs, infrastructure, and runtime environments.
"The WIN Partner Index offers a new lens into how integrations perform where it matters most: in the hands of real teams," said Oron Noah, VP of Product, Extensibility & Partnerships at Wiz. "This inaugural report demonstrates the value Harness brings to educating customers. It's a great example of what's possible when partners align around a shared goal, building an open ecosystem where context flows freely and security becomes a team sport."
Learn More
Download the WIN Partner Index 2025 to see why Harness was recognized as a Customer Educator and explore the integrations shaping modern cloud security programs.
We’re proud to partner with Wiz—and even more excited about what this recognition means for our joint customers.

Build Numbers That Actually Make Sense: Branch-Scoped Sequence IDs in Harness CI
You're tagging Docker images with build numbers.
-Build #47 is your latest production release on main. A developer pushes a hotfix to release-v2.1, that run becomes build #48.
-Another merges to develop, build #49. A week later someone asks: "What build number are we on for production?" You check the registry.
-You see #47, #52, #58, #61 on main. The numbers in between? Scattered across feature branches that may never ship. Your build numbers have stopped telling a useful story.
That's the reality when your CI platform uses a single global counter. Every run, on every branch, increments the same number. For teams using GitFlow, trunk-based development, or any branching strategy, that means gaps, confusion, and versioning that doesn't match how you actually ship.
TL;DR: Harness CI now supports branch-scoped build sequence IDs via <+pipeline.branchSeqId>.
Each branch gets its own counter. No gaps. No confusion.
Why Global Build Counters Break Down
Most CI platforms give you one incrementing counter per pipeline. Push to main, push to develop, push to a feature branch, same counter. So you get:
- Gaps in the sequence for any given branch (e.g. main might have #1, #4, #7).
- No clear answer to "what's the latest build on main?"
- Semantic versioning and artifact naming that don't line up with branch reality.
- Registries and artifact stores full of numbers that don't map to how you release.
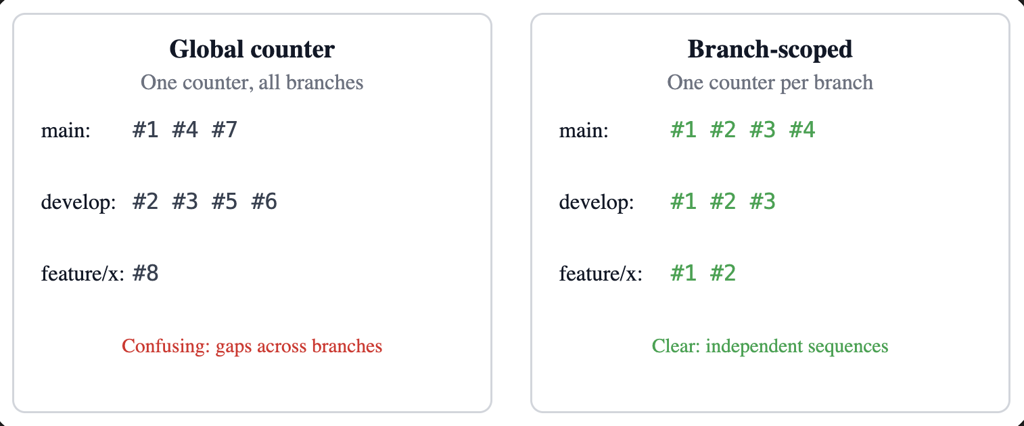
This is now built directly into Harness CI as a first-class capability.
What It Feels Like in Practice
Add <+pipeline.branchSeqId> where you need the number—for example, in a Docker build-and-push step:
tags:
  - <+pipeline.branchSeqId>
  - <+codebase.branch>-<+pipeline.branchSeqId>
  - latest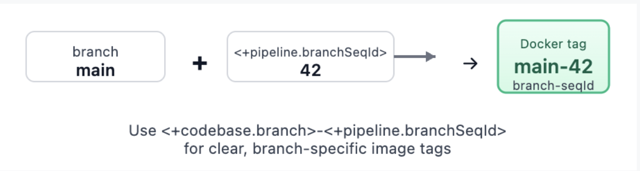
Trigger runs on main, then on develop, then on a feature branch. Each branch gets its own sequence: main might be 1, 2, 3… develop 1, 2, 3… feature/x 1, 2. Your tags become meaningful: main-42, develop-15, feature-auth-3. No more guessing which number belongs to which branch.
What You Get
- Per-branch counters – One sequence per pipeline + repo + branch, stored and incremented atomically.
- Pipeline expression –
<+pipeline.branchSeqId>. Check out Harness variables documentation. - REST API – List sequences for a pipeline, get the current value for a branch/repo, reset a branch counter, or set it to a specific value (for example, after a major release or when migrating from another CI).
- Consistent identification – Repo URLs and branch names are normalized (for example, refs/heads/main → main, different URL forms to one canonical host/owner/repo). Same logical branch and repo always share the same counter.
- Cleanup – When a pipeline is deleted, its branch-sequence data is removed so you don't leave orphaned counters.
Webhook triggers (push, PR, branch, release) and manual runs (with branch from codebase config) are supported. For tag-only or other runs without branch context, the expression returns null so you can handle that in your pipeline if needed.
How It Works Under the Hood
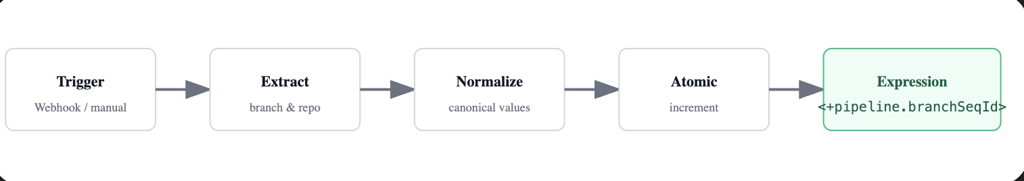
Branch and repo are taken from the trigger payload when possible (webhooks) or from the pipeline's codebase configuration (for example, manual runs). We normalize them so that the same repo and branch always map to the same logical key: branch names get refs/heads/ (or similar) stripped, and repo URLs are reduced to a canonical form (for example, github.com/org/repo). That way, whether you use https://..., git@..., or different casing, you get one counter per branch.
The counter is stored and updated with an atomic increment. Parallel runs on the same branch still get distinct, sequential numbers. The value is attached to the run's metadata and exposed through the pipeline execution context so <+pipeline.branchSeqId> resolves correctly at runtime.
Putting It to Work
- Docker image tagging: use
<+pipeline.branchSeqId>and optionally <+codebase.branch>-<+pipeline.branchSeqId> for clear, branch-specific tags. - Helm chart versioning: e.g. --version 1.0.
<+pipeline.branchSeqId> --app-version <+codebase.commitSha>so the chart version tracks the build number and the app version tracks the commit. - Release notes or deployment labels: for example, "Release Build #
<+pipeline.branchSeqId>" so production and staging each have a clear, branch-local build number.
For teams that need control or migration support, branch sequences are also manageable via API:
# List all branch sequences for a pipeline
GET /pipelines/{pipelineIdentifier}/branch-sequences

# Reset counter for a specific branch
DELETE /pipelines/{pipelineIdentifier}/branch-sequences/branch?branch=main&repoUrl=github.com/org/repo

# Set counter to a specific value (e.g., after major release)
PUT /pipelines/{pipelineIdentifier}/branch-sequences/set?branch=main&repoUrl=github.com/org/repo&sequenceId=100
All of this is gated by the same feature flag so only accounts that have adopted the feature use the APIs.
Try It (With Smart Guardrails)
- Enable the feature – Turn on
CI_ENABLE_BRANCH_SEQUENCE_ID(Account Settings → Feature Flags, or Reach out to the Harness team). - Use the expression – Add
<+pipeline.branchSeqId>in steps, tags, or env vars. - Verify – Run the pipeline on two or three branches and confirm each branch has its own 1, 2, 3…
If branch context isn't available, the expression returns null. Design your pipeline to handle that (for example, skip tagging or use a fallback) for tag builds or edge cases.
Feature availability may vary by plan. Check with your Harness account or Harness Developer Hub for your setup.
How Other CI Platforms Handle This (Spoiler: Most Don't)
This isn't just a Harness problem we solved—it's an industry gap. Here's how major CI platforms compare:
Most platforms treat build numbers as an afterthought. Harness CI treats them as a first-class versioning primitive. For teams migrating from Jenkins or Azure DevOps, the model will feel familiar. For teams on GitHub Actions, GitLab, or CircleCI, this fills a gap that previously required external services or custom scripts
What's Coming
This is the first release of branch-scoped sequence IDs. The foundations are in place: per-branch counters, expression support, and APIs. We're not done.
We're listening. If you use this feature and hit rough edges—or have ideas for tag-scoped sequences, dashboard visibility, or trigger conditions—we want to hear about it. Share feedback .

AI Deployment in Production: Orchestrate LLMs, RAG, Agents
For the past few years, the narrative around Artificial Intelligence has been dominated by what I like to call the "magic box" illusion. We assumed that deploying AI simply meant passing a user’s question through an API key to a Large Language Model (LLM) and waiting for a brilliant answer.
Today, we are building systems that can reason, access private databases, utilize tools, and—hopefully—correct their own mistakes. However, the reality is that while AI code generation tools are helping us write more code than ever , we are actually getting worse at shipping it. Google's DORA research found that delivery throughput is decreasing by 1.5% and stability is worsening by 7.5%. Deploying AI is no longer a machine learning experiment; it’s one of the most complex system integration challenges in modern software engineering.
That's why integrated CI/CD is no longer optional for AI deployment—it's the foundation. As teams adopt platforms like Harness Continuous Integration and Harness Continuous Delivery, testing and release orchestration shift from isolated checkpoints to continuous safeguards that protect quality and safety at every layer of the AI stack.
What Is AI Deployment in 2026?
Most definitions of AI deployment are stuck in the "model era." They describe deployment as taking a trained model, wrapping it in an API, and integrating it into a single application to make predictions.
That description is technically accurate—but strategically wrong.
In 2026, AI deployment means:
Integrating a full AI application stack—models, prompts, data pipelines, RAG components, agents, tools, and guardrails—into your production environment so it can safely power real user workflows and business decisions.
You're not just deploying "a model." You are deploying the instructions that define the AI's behavior, the engines (LLMs and other models) that do the reasoning, the data and embeddings that feed those engines context, the RAG and orchestration code that glue everything together, the agents and tools that let AI take actions in your systems, and the guardrails and policies that keep it all safe, compliant, and affordable.
Classic "model deployment" was a single component behind a predictable API. Modern AI deployment is end‑to‑end, cross‑cutting, and deeply entangled with your existing software delivery process.
If you want a great reference for the more traditional view, IBM's overview of model deployment is a good baseline. But in this article, we're going to go beyond that to talk about the compound system you are actually shipping today.
Why AI Deployment Has Become the Bottleneck
The paradox of this moment is simple: coding has sped up, but delivery has slowed down.
AI coding assistants take mere seconds to generate the scaffolding. Platform teams spin up infrastructure on demand. Product leaders are under pressure to add "AI" to every experience. But in many organizations, the actual path from "we built it" to "it's safely in front of customers" is getting more fragile—instead of less.
There are a few reasons for this:
- The AI stack is multi‑layered and non‑deterministic. Traditional CI/CD pipelines were designed for deterministic systems: if the code compiles and tests pass, you can be reasonably confident in the behavior. With LLMs and agents, the same input might result in a range of outputs, some acceptable and some dangerous. Testing no longer has a simple pass/fail shape.
- Ownership is fractured. MLOps teams worry about training and serving models. Application teams bolt on AI features. Security teams scramble to backfill policies around data access and tool usage. Platform teams are left trying to orchestrate releases that touch all of the above, often without having clear control over any of them.
- We've created tool silos instead of integrated delivery. We now talk about MLOps, LLMOps, AgentOps, DevOps, SecOps—as if each deserved its own stack and dashboard—while the actual releases that matter to customers cut straight across those boundaries.
The result is what many teams are feeling right now: shipping AI features feels risky, brittle, and slow, even as the pressure to "move faster" keeps rising.
To fix that, we have to start with the stack itself.
Part 1: Deconstructing the Modern AI Stack
To understand how to deploy AI, you have to stop treating it as a single entity. The modern AI application is a compound system of highly distinct, interdependent layers. If any single component in this stack fails or drifts, the entire application degrades.
1. The Instructions: Prompts as Code
A prompt is no longer just a text string typed into a chat window; it is the source code that dictates the behavior and persona of your application.
- The Deployment Reality: Prompts require the same rigor as traditional code—version control, peer review, and automated testing. Because LLMs are sensitive to minute phrasing changes, updating a prompt requires running it against hundreds of baseline test cases to ensure the model doesn't experience "regression" and forget its core instructions.
2. The Engine: Large Language Models (LLMs)
The LLM is the reasoning engine. It has vast general knowledge but zero awareness of your company’s proprietary data.
- The Deployment (LLMOps) Reality: Most companies consume these via APIs or host smaller models on cloud infrastructure. The deployment challenge is routing. A sophisticated pipeline will dynamically route simple tasks to faster, cheaper models and complex reasoning tasks to massive, expensive models to optimize both latency and cloud spend, which currently sees significant waste in many organizations.
3. The Fuel: Data and Vector Embeddings
An AI's output is only as reliable as the context it is given. To make an LLM useful, it needs a continuous feed of your company’s internal data.
- The Deployment Reality: This requires automated data pipelines that ingest raw information, "chunk" it, and store it in a Vector Database. If the embedding model changes, the entire database must be re-indexed. This data pipeline must be continuously deployed and synced without disrupting the live application.
4. The Architecture: Retrieval-Augmented Generation (RAG)
RAG is not a model; it is a separate software architecture deployed to act as the LLM's research assistant.
- The RAG Deployment Reality: When a user asks a question, the RAG code intercepts it, queries the Vector Database, and packages that data into a prompt. Deploying RAG means deploying the integration code that securely manages this retrieval and hand-off process.
5. The Doer: AI Agents
If RAG is a researcher, an AI Agent is an employee. Agents are LLMs given access to external tools. Instead of just answering a question, an agent can formulate a plan, search the web, and execute code.
- The Deployment Reality: Moving from linear flows to "Agentic Workflows" introduces massive complexity. You are now deploying systems that iterate and loop. Deploying an agent requires monitoring its step-by-step reasoning traces and ensuring it doesn't get stuck in an infinite loop or misuse its tools.
Part 2: The Guardrails (DevSecOps for AI)
You cannot expose a raw LLM or an autonomous agent to the public, or even to internal employees, without armor. Because AI is non-deterministic, traditional software security falls short. Modern AI deployment requires distinct "Guardrails as Code".
Input Guardrails
- Prompt Injection Defenses: Malicious users will attempt to "jailbreak" the AI. Input guardrails use separate, smaller models to intercept adversarial prompts before they reach the core LLM.
- PII Scrubbing: Automated systems must redact Personally Identifiable Information (PII) to ensure sensitive data never leaves your secure environment or reaches a third-party LLM provider.
These kinds of controls are a natural fit for policy‑as‑code engines and CI/CD gates. With something like Harness Continuous Delivery & GitOps, you can enforce Open Policy Agent (OPA) rules at deployment time—ensuring that applications with missing or misconfigured input guardrails simply never make it to production.
Output Guardrails
- Hallucination Detection: These cross-reference the model’s answer against the retrieved RAG documents to increase confidence by checking support/citations for key claims in your proprietary data.
- Schema Enforcement: If your system expects the AI to return data in a strict format, output guardrails will validate the structure and automatically reject or re-prompt the LLM if it outputs unstructured text.
Agentic and Operational Guardrails
- Blast-Radius Containment: When deploying agents that can execute actions, strict Role-Based Access Control (RBAC) must be enforced. Agents must operate on the principle of least privilege.
- FinOps and Rate Limiting: AI is computationally expensive. Guardrails must enforce strict token-usage tracking and throttle actions to prevent a runaway agent from racking up thousands of dollars in cloud compute costs.
Part 3: The Interplay and the Need for Release Orchestration
Understanding the stack reveals the ultimate challenge: The Cascade Effect. In traditional software, a database error throws a clean error code. In an AI application, a bug in the data pipeline silently ruins everything downstream. This is why deployment cannot be disjointed. It requires rigorous Release Orchestration.
- Fuzzy Integration Testing: Traditional CI/CD pipelines rely on exact-match assertions. Because LLMs return varying text, we now require "semantic evaluation"—often using a separate LLM acting as a judge to grade the output based on meaning and accuracy during the automated testing phase.
- Progressive Rollout Strategies: Because you cannot perfectly predict AI behavior, orchestration must support Canary releases—rolling out the new model to 5% of users to monitor drift before a full launch.
- Synchronizing the Moving Parts: A prompt update might require a different RAG strategy. A new embedding model demands a full database re-indexing. Release orchestration ensures that when one layer is updated, the corresponding dependencies are automatically tested and deployed in lockstep.
How to Deploy AI in Production (A Practical Pipeline)
- Version prompts/configs/policies as code
- Build eval suite (golden set + safety tests)
- CI: semantic eval + regression thresholds
- Security gates: PII redaction + prompt injection tests
- CD: canary rollout for prompt/model/RAG changes
- Observability: quality + safety + cost signals
- Rollback rules tied to metrics
- Post-deploy review and dataset refresh cadence
The Bottom Line: Orchestrate or Stall
For years, we've been obsessed with specialized silos: MLOps, LLMOps, AgentOps. But a vital realization is sweeping the enterprise: the time of siloed, specialized AI operations tools is coming to an end.
The future belongs to unified release management. The organizations that succeed will not be the ones with the smartest standalone AI models, but the ones who master the orchestration required to deploy and evolve those models, alongside everything else they ship, safely, efficiently, and continuously.
If you want a platform that brings semantic testing, progressive rollouts, and coordinated AI releases into your day-to-day workflows, Harness Continuous Integration and Harness Continuous Delivery were built for this.
Key Takeaways:
- AI deployment is deploying a stack, not a model.
- Treat prompts, evals, policies, and configs as code.
- Use semantic evaluation plus standard CI tests.
- Use progressive delivery (canaries) for models/prompt/RAG changes.
- Orchestrate dependencies (prompt ↔ RAG ↔ embeddings ↔ guardrails) to prevent silent regressions.
AI Deployment: Frequently Asked Questions (FAQs)
What is AI deployment?
AI deployment is the process of integrating AI systems, models, prompts, data pipelines, RAG architectures, agents, tools, and guardrails, into production environments so they can safely power real applications and business workflows.
How is AI deployment different from traditional model deployment?
Traditional model deployment focuses on serving a single model behind an API. Modern AI deployment involves a multi‑layer stack: instructions, engines, context, retrieval, agents, and policies. Failures are more likely to be silent regressions or unsafe behaviors than obvious crashes, which is why you need semantic testing, guardrails, and release orchestration.
How do you deploy AI safely in production?
Safe AI deployment starts with treating prompts and configurations as code, embedding guardrails at input, output, and action levels, and using semantic evaluation and progressive rollout strategies. It also requires immutable logging and audit trails so you can trace decisions back to specific versions of your AI stack. Combining CI for semantic tests with CD for orchestrated releases is the practical path to safety.
What tools are used for AI deployment?
Teams typically use a mix of LLM providers or model‑serving platforms, vector databases, observability tools, and CI/CD systems for orchestrating releases. On top of that, they add policy engines and specialized evaluation frameworks. The critical shift is moving from isolated "AI tools" to integrated pipelines that tie everything together.
How do canary releases work for AI models and prompts?
With canary releases, you send a small portion of traffic to the new behavior, a new model, prompt, or RAG strategy, while most users continue on the old path. You observe semantic quality, safety signals, and performance. If the canary behaves well, you gradually increase its share. If it misbehaves, you automatically roll back to the previous version.
.jpg)
How to Plan a Successful CI/CD Migration Without Disrupting Developers
- Treat CI/CD migration like a developer platform launch: define what “no disruption” means, baseline your metrics, and set clear cutover rules.
- Migrate the foundations before the YAML: runners, networking, caching, and artifact handling determine whether feedback stays fast and reliable.
- Roll out in waves with parallel runs: start with a representative pilot, then expand using a repeatable checklist for readiness, performance, and rollback.
Modern engineering teams run on CI/CD. It’s where pull requests get validated, artifacts get produced, and releases get promoted to production. That also makes CI/CD migration very risky because you're not just moving a "tool"; you're moving the workflow that developers use dozens or hundreds of times a day.
The good news: disruption is optional. If you plan the migration like a product launch for developers, you can change platforms while keeping shipping velocity steady, often improving reliability, security, and cost along the way.
Harness CI can help you reduce migration friction by standardizing pipeline patterns and improving build performance without asking every team to rebuild their workflows from scratch.
What a CI/CD Migration Really Includes (and What to Defer)
A CI/CD migration is more than just "moving pipelines." In reality, you're moving or re-implementing four layers that work together:
- Workflow definitions: pipelines, templates, triggers, branch rules, environments, and approvals.
- Execution layer: build agents/runners, container orchestration, machine pools, concurrency, network access.
- Integrations and dependencies: source control, artifact registries, IaC tools, notifications, ticketing, scanners, and secrets.
- Governance: RBAC, SSO, approvals, audit logs, policy enforcement, and compliance evidence.
What to defer on purpose so you don’t disrupt developers:
- A full rewrite of every edge-case pipeline “to make it perfect.”
- A complete standardization effort across every language, framework, and release process.
- A platform-wide re-architecture that turns the migration into an 18‑month program.
Aim for parity first, then iterate for standardization and optimization once the new platform is stable.
CI/CD Migration Steps (A Practical Plan)
Use this step-by-step plan to migrate safely while developers keep shipping. Start with measurable guardrails, prove parity in a pilot, then scale with wave-based cutovers.
Step 1: Define “No Disruption” for Your CI/CD Migration (and Measure It)
You can’t protect developer experience if you don’t define it.
Start by writing a one-page “rules of engagement” that answers:
- What must keep working with zero/minimal downtime (for example: production deployments, security scans, release approvals)?
- What can tolerate change (for example: non-prod deploys, nightly builds)?
- What does rollback look like if a cutover fails?
- Who owns decisions, and who is on point when a pipeline breaks?
Then baseline two sets of metrics: delivery outcomes and pipeline health.
Delivery outcomes (DORA metrics)
- Deployment frequency
- Lead time for changes
- Change failure rate
- Recovery time/time to restore service (DORA has expanded the model over time)
You can use DORA’s official guide as your shared vocabulary and measurement reference.
Pipeline health
- Median and P95 pipeline duration (by pipeline type: PR checks, mainline builds, deploys)
- Queue time and agent utilization
- Failure rate (overall and by stage)
- Flake rate (tests that fail and pass without code changes)
- Cost per run (compute + licensing + developer time)
Tip: pick a small number of “must not regress” thresholds (for example: PR checks stay under your current P95, deployment approvals still work, and failure rate doesn’t spike).
Step 2: Inventory Your Current CI/CD Reality
Most migration pain comes from what you didn’t discover up front: the secret integration, the shared library, the one pipeline that deploys five services, the hardcoded credential that “nobody owns.”
Build a pipeline catalog with the minimum fields needed to plan waves and parity:
- Repo/service name and owner (team + on-call)
- Pipeline type (PR checks, mainline build, release, deploy)
- Triggers (branch rules, tags, schedules, manual)
- Environments and approvals (dev/stage/prod, gates, checks)
- Artifact outputs (container image, package, Helm chart, etc.)
- Integrations (registry, secrets manager, scanners, Slack/Jira, cloud accounts)
- Execution details (runner type, machine size, caches, custom images)
- “Break glass” notes (special cases, manual steps, tribal knowledge)
Then do two passes:
- Critical path first: production deploy pipelines, shared templates/libraries, monorepo builds, release trains.
- Representative complexity: to show how complicated things can get, add a few "messy but real" pipelines early on so you can find edge cases before the big wave.
If you’re planning migration waves, the Azure Cloud Adoption Framework has a good, useful overview of "wave planning" that works well for CI/CD moves if you're planning migration waves.
Step 3: Choose a CI/CD Migration Strategy That Keeps Teams Shipping
There are three common CI/CD migration strategies. The safest choice depends on your risk tolerance, your compliance constraints, and how tightly coupled your current system is.
Parallel run (recommended for most teams)
- Run old and new pipelines side-by-side until outputs match and reliability stabilizes.
- Use the new platform to build confidence before it becomes the system of record.
Strangler pattern (migrate shared steps first)
- Migrate shared templates, artifact publishing, caching, and scanning first.
- Move full pipelines once the building blocks and standards are stable.
Big bang (use only when forced)
- Sometimes required (tool EOL, hard compliance deadlines), but it needs rehearsals, rollback drills, and heavy coverage.
If you want one crisp rule: default to waves + parallel run. Avoid turning your CI/CD migration into a cliff.
Step 4: Design the Execution Layer Before You Move YAML
Developers don’t experience “YAML,” they experience feedback time and pipeline reliability. Execution decisions will make or break disruption.
Use this checklist to design the execution layer intentionally:
Where do builds run?
- Managed cloud build infrastructure, Kubernetes-based runners, VMs, or a mix.
- Network placement for private dependencies (databases, internal package registries).
- Egress controls and allowlists.
How do you protect performance?
- Dependency caching (language/package caches)
- Docker layer caching (if you build images)
- Reusing build outputs when inputs haven’t changed
- Concurrency limits and resource sizing
How do you handle artifacts and promotion?
- Standard artifact naming and versioning
- Artifact retention rules
- Promotion rules between environments
This is also where you can win developer trust quickly: if the new system’s PR checks are noticeably faster (or at least not slower), adoption becomes easier.
Step 5: Make Identity, Secrets, and Governance “Day 1” Work
CI/CD systems are a big target because if an attacker can change your pipeline, they can change what gets deployed. The U.S. CISA and NSA have published guidance just for protecting CI/CD environments. Use it to make your migration plan and your target platform more secure.
Treat security and governance as migration requirements, not a later phase.
Lock down access with RBAC + separation of duties
- Define who can edit pipelines and templates, manage connectors and secrets, approve promotions, and override gates.
- If you have separation-of-duties requirements, document them and build them into the model.
Prefer short-lived credentials for automation
- Static credentials in pipelines are a long-term risk.
- Where possible, use OIDC-based federation or workload identity.
- AWS’s guidance is explicit about preferring temporary credentials when you can.
Centralize secrets (and plan rotation)
- When you can, use an external secrets manager.
- Minimize secret exposure by keeping secrets out of logs and environment variables whenever possible.
- Before the cutover, make sure you know what rotation ownership and cadence are.
Don't forget proof of compliance.
Don’t forget compliance evidence. CI/CD migration often changes approval workflows, audit logging, and evidence retention. Validate evidence captured during the pilot, not at the end of wave three.
Step 6: Build a Migration Starter Kit Developers Can Copy
To avoid disrupting developers, you need a migration path that feels familiar and removes decision fatigue.
Build a “starter kit” that includes:
- Golden-path templates for the top 5–10 pipeline patterns (PR checks, mainline build, container build, deploy to stage, deploy to prod).
- Standard integrations, configured once: registries, IaC, scanners, notifications, tickets.
- Naming conventions (pipelines, stages, environments, artifacts) so teams can read each other’s pipelines.
- Docs for common tasks, written for developers:
- How to add a new service
- How to add an integration test stage
- How to deploy to staging
- How to request an exception
- How to add a new service
If your platform supports it, make guardrails policy-driven instead of copy/paste. For example: require scanning steps for certain artifacts, restrict prod deploy permissions, and enforce approved base images.
Step 7: Keep Developer Workflows Familiar With a Simple Rollout Plan
Even if the new platform is “better,” developers experience migration through small moments: Where do I rerun a build? How do I find logs? How do approvals work? Who do I ping when something is blocked?
A lightweight rollout plan reduces friction more than another week of pipeline refactoring:
- Publish a “before → after” map for the top workflows: trigger a build, view logs, download artifacts, rerun a failed step, request a prod approval, and roll back a deployment.
- Create a migration FAQ that answers the uncomfortable questions: “Will my pipeline break?”, “Do I need to learn a new syntax?” “What happens to my secrets?” “What if I’m on-call during cutover?”
- Time-box behavior changes. If you’re changing branch conventions, artifact naming, or approval flows, do it later unless it’s required for parity.
- Run enablement like onboarding. A 30-minute live walkthrough plus a recorded demo is usually enough for most teams.
- Make support visible. Pin your escalation path, office hours, and known issues in the channel developers already use.
Treat developer feedback as a platform signal. If teams struggle, it’s often because the golden path isn’t obvious yet, so improve templates and docs rather than asking every team to invent their own best practices.
Step 8: Pilot for Parity, Then Roll Out in Waves
A successful pilot proves three things:
- Parity: the new pipeline produces the same artifacts and deploys the same way.
- Reliability: failure rates and flakiness don’t spike.
- Developer experience: feedback time and workflow friction are acceptable (or better).
Pick a pilot that is:
- Actively developed (not a dormant repo)
- Medium complexity (not the simplest “hello world,” not the most mission-critical)
- Owned by a team willing to give feedback quickly
Prove parity with a parallel run window
- Compare artifact digests, test outcomes, deploy behavior, and approvals.
- Track top failure reasons and fix templates, not just the pilot pipeline.
- Publish a short “pilot report” so leadership and developers see proof, not promises.
Roll out in waves with a cutover checklist.
For each wave, define a “ready to cut over” checklist:
- Success rate meets a threshold (for example: within X% of baseline)
- Performance is within bounds (for example: PR checks P95 not worse than baseline)
- Approvals, RBAC, and audit logging verified
- Rollback tested (you can revert to the old system quickly)
Run migration like a service
- A dedicated Slack channel and published escalation path
- Office hours during the first waves
- “Champions” in each org who can answer common questions
Step 9: Optimize, Decommission, and Prevent Pipeline Drift
Once most teams are migrated, the work shifts from “move” to “make it better.”
Improve speed and reliability (without churn)
- Tighten caching and reuse outputs
- Split slow tests and reduce flakiness
- Right-size runners and concurrency
- Remove redundant stages (duplicate scans, repeated builds)
Prevent drift. If teams can fork templates endlessly, you’ll end up with a new version of the old problem. Decide where standardization is required and where flexibility is allowed:
- Standardize: security gates, artifact publishing, environment promotion rules, audit logging
- Flexible: language-specific steps, unit test frameworks, and optional quality checks
Retire the old system safely before decommissioning:
- Confirm audit log retention requirements are met.
- Rotate or delete legacy credentials and service accounts.
- Remove access and document the “new normal.”
Common CI/CD Migration Pitfalls (and How to Avoid Them)
- Migrating YAML without migrating execution reality. Fix runners, caching, and networking first.
- Treating security as “phase two.” CI/CD is part of your software supply chain; harden identity and secrets early.
- Over-standardizing too soon. Move the 80% path first; handle exceptions with a time-boxed process.
- No baselines. If you didn’t measure pipeline health before, you can’t prove improvement after.
- No support model. Developers won’t “just adopt” a new platform during busy release cycles.
Keep Developers Shipping, Then Make the New System Better
A successful CI/CD migration is repeatable: define success, inventory the real system, and design execution and security before you touch every pipeline. Prove parity in a pilot, then roll out in waves with clear cutover and rollback rules so teams can keep shipping.
Once the new platform is stable, use your baselines to optimize build speed, reliability, and governance, and decommission the old system cleanly to prevent drift and orphaned credentials. If you’re looking for a pragmatic way to standardize pipelines and shorten feedback loops as you migrate, Harness CI can help.
CI/CD Migration: Frequently Asked Questions (FAQs)
These FAQs cover the practical questions teams ask during a CI/CD migration: timelines, sequencing CI vs. CD, and how to reduce risk during cutover.
How long does a CI/CD migration take?
For many teams, a safe migration happens in waves over 6–12 weeks, starting with a pilot and expanding based on readiness. The timeline depends more on integrations, governance, and execution infrastructure than on pipeline definitions.
Should we migrate CI and CD at the same time?
Not always. If your deploy workflows are complex or tightly governed, migrating CI first can reduce risk while you validate identity, artifacts, and approvals. In other cases, migrating CI and CD together can simplify end-to-end standardization, just keep the rollout wave-based.
What’s the safest way to cut over production deployments?
Use a parallel run window, validate parity (artifacts, approvals, behavior), and enforce a cutover checklist with rollback steps rehearsed. Avoid silent changes, announce the cutover, and provide a clear escalation path.
How do we handle secrets and credentials during the migration?
Start with an inventory, move toward short-lived credentials (for example, OIDC federation), and centralize secrets where possible. Rotate credentials during cutover and delete legacy service accounts once decommissioned.
How do we prove the migration improved developer productivity?
Compare pre- and post-migration baselines: PR feedback time, pipeline reliability, queue time, time-to-fix failures, plus DORA metrics where you can measure them. Share results with developers so the migration feels like an improvement, not change for change’s sake.
What should we standardize vs. keep flexible?
Standardize what protects the organization (security gates, artifact promotion rules, audit logging, prod approvals). Keep flexibility where teams need it (language tooling, test frameworks, optional quality checks), and use templates to make the right path easy.

Flaky Tests: The Quiet Killer of Productivity in Your CI Pipeline
- Flaky tests waste 16–24% of developers' time on average because of false failures, re-runs, and investigations. This costs engineering companies millions of dollars in lost productivity every year.
- Timing problems, test pollution, unstable infrastructure, and race conditions are all possible root causes. However, AI-powered detection can automatically identify and isolate flaky tests, improving signal quality.
- Harness CI and other modern CI platforms use machine learning to identify flaky tests, automatically quarantine unreliable tests, and maintain developers' trust without manual triage or pipeline interruptions.
What are Flaky Tests?
Flaky tests are automated tests that pass or fail inconsistently without changes to the code. In this guide, you’ll learn why flaky tests happen, how to detect them automatically in CI pipelines, and how modern platforms prevent them from slowing teams down.
Your test went well three times yesterday. It didn't work this morning. You ran it again without changing anything, and now it works. Congratulations, you've just passed a flaky test, and now someone's day is going to be ruined.
Flaky tests are like smoke alarms that go off for no reason. Everyone looks into it the first few times. Eventually, your entire test suite stops being an early warning system and becomes background noise. Harness CI uses AI to automatically identify flaky tests and put them in quarantine, so your pipelines send you reliable signals instead of random noise.
Why Tests That Don't Work Are Expensive (Even If You Don't Pay Attention to Them)
The 30 seconds it takes to hit "retry" isn't the real cost of flaky tests. It's everything that happens after developers stop trusting the test results.
Developer Time Goes Up in Investigating Black Holes
Someone has to figure out if a test failure is a real bug or just flakiness. An industrial case study found flaky tests consuming about 2.5% of developers' productive time - 1.1% on investigation, 1.3% on repairs, and 0.1% on tooling. For a team of 50 engineers, that's the equivalent of more than one full-time engineer's worth of work... gone.
And that's the best-case scenario, where teams really look into things. The worst-case scenario is that developers think everything is flaky, stop looking into failures, and real bugs make it to production. You're paying for tests that hurt your confidence instead of helping it.
Changing Contexts Breaks the Flow State
This is what really happens when a flaky test breaks your build. You're deep into the code, working on a complicated feature. The build doesn't work. You stop, switch contexts to look into the problem, find out it's not your fault, run the pipeline again, and wait. When the green build comes back 15 minutes later, you've lost your train of thought and spent 20 minutes on Slack instead.
Studies on productivity show that it takes 15 to 25 minutes to get back to full focus after being interrupted. If you have dozens of flaky test interruptions every week across your team, you're losing a lot of productive hours.
The Hidden Multiplier Is Trust Degradation
The cultural cost is the most harmful. When tests stop working, developers find other ways to do things. They automatically run builds again. After the third retry passes, they combine PRs with red builds. They stop making new tests because "tests are flaky anyway."
This loss of trust gets worse over time. Teams that tolerate flaky tests have lower test coverage, longer feedback loops, and more problems in production. Your quality assurance system will only be useful if developers trust the test results.
Root Causes: Why Tests Fail and How to Tell When They Do
The first step in fixing tests is to figure out why they fail. You can hunt down flaky tests in a systematic way instead of playing whack-a-mole because most of them follow a pattern.
Timing and Race Conditions: The Usual Suspects
Assumptions about timing are the main reason why tests fail. Your test says that element X should be ready in 100ms. It's always ready in 80 milliseconds on your laptop. It takes 120ms on a shared CI runner that is busy. Boom, failure that happens sometimes.
You could have problems with network calls, database queries, UI rendering, or async operations if you have to "wait for something to happen." Hard-coded sleep statements are especially bad because they're either too short (flaky) or too long (slow tests that waste time even when they pass).
The fix is to use explicit waits with timeouts: wait for specific conditions (such as an element becoming visible, an API response being received, or a state being updated) rather than arbitrary time intervals. You need to find out which tests have these problems first.
Pollution in Tests and Shared State
Tests that depend on the order in which they are run or share mutable state are like ticking time bombs. Test A runs first and puts data into the database. Test B assumes that the data is there. If you run them in parallel or in the opposite order, Test B fails at random.
Global variables, singleton patterns, shared file systems, and database records that don't get cleaned up all make tests depend on each other in ways that aren't obvious. When you run your tests in parallel to speed them up, test pollution shows up in a big way.
Test Intelligence helps by looking at test dependencies and running tests that are affected in isolation, which makes them less flaky because of pollution.
Unstable Infrastructure and Environment
The test is fine, but the setting isn't always. Network problems, shared CI runners fighting for resources, external API rate limits, and database connection pool exhaustion are all environmental factors that can cause your code to fail from time to time.
This is why teams that use shared, static Jenkins clusters have more problems than teams that use ephemeral build environments. You get rid of the "noisy neighbor" problem completely when every build runs in a clean, separate space with its own resources.
Code That Isn't Deterministic and Dependencies From Outside
Tests that rely on the current time, random number generation, external APIs, or other inputs that aren't always the same will eventually fail. Anything that isn't completely under your control in your test setup could cause flakiness. For example, today's date changes, APIs go down, and random seeds give you different values.
Dependency injection and test doubles are the answer. For example, you can mock the clock, stub external APIs, and seed random generators in a way that is predictable. But first, you need to know which tests have these problems.
Detection Strategies That Really Work
You can't fix something if you can't see it. The first step is to make systems that automatically show flaky tests instead of making developers remember and report them.
Using AI to Find Flaky Tests Automatically
It doesn't work to keep track of flaky tests by hand. You need automated detection that watches test runs over time and finds patterns that show flakiness.
AI-powered test intelligence looks at past test results to find tests that pass and fail on the same code without making any changes. After just a few runs, machine learning models can find flaky behavior and flag tests for further investigation before they turn into big problems.
The most important thing is to run the same test suite on the same code several times. Newer platforms can do this automatically without any help from people.
Quarantine Systems That Keep the Pipeline Signal
You have a problem when you find a flaky test. If you turn it off, you won't be able to test it. If you leave it running, it will keep breaking builds and teaching developers to ignore failures.
The answer is automatic quarantine. Put a flaky test in quarantine so it can still run, but doesn't block the pipeline. Failures are recorded and tracked, but developers don't have to deal with random failures from tests that are known to be flaky.
This keeps the quality of the signals in your main test suite while letting platform teams see the tests that are in quarantine and need to be fixed. You're separating the noise from the signal without losing either.
Using Flaky Test Rate as an Important Metric
Along with build duration and deployment frequency, treat flaky test rate as a top operational metric. Healthy test suites keep flaky rates below 1–2%, while rates above 5% show that there are big problems.
Keep an eye on this over time to see if it changes. A sudden spike usually means that the infrastructure has changed or that new code patterns have made things less stable. Platform teams should set up alerts and SLOs for flaky test rates so they can catch problems early.
How to Fix Flaky Tests: Best Practices That Work
Finding the problem is half the battle. You can't just hide the problems anymore; you need to use systematic methods to fix them.
First, Isolate and Reproduce
You need to be able to consistently reproduce the failure before you can fix a flaky test. Run the test hundreds of times on your own computer or in CI until you see how it fails.
Tools that make it easy to run tests again and again are helpful here. Some platforms let you run a single test 50 times with a single command, making it easy to find intermittent failures. Once you can consistently reproduce the failure, it becomes easier to investigate.
Should You Fix the Test or the Code?
Not all flaky tests are bad tests. Sometimes, flakiness in your production code indicates real race conditions, timing issues, or behavior that isn't always consistent.
Think about this: Is this flakiness testing something that could happen in production, or is it just a result of how we wrote the test? The flakiness is a signal that users could see this timing problem. Make the code work. If it's just a test artifact, fix the test.
Common Problems and Their Solutions
Different flaky test types need different fixes:
- Problems with timing: Instead of hard-coded sleeps, use explicit waits. When you have external dependencies, use retry logic with exponential backoff. If you need to, increase the timeouts, but it's better to make operations go faster than to make tests wait longer.
- Resource contention: Create temporary directories, test-specific namespaces, and database schemas. After tests, clean up the resources. Don't use global shared state.
- External dependencies: Mock APIs and services. Use test doubles. Use circuit breakers and fallbacks for integration tests that require connecting to real services.
- Inputs that aren't deterministic: Seed random number generators. Mock the clock on the system. Instead of generated data, use fixed test data.
Refactor to Make Things More Certain
The end goal is to make your test suite completely deterministic. Every time, the same code gives the same test results. This means making choices about architecture:
- Dependency injection that lets you use test doubles
- Whenever possible, use pure functions that don't have side effects
- There is a clear line between business logic and I/O
- Test fixtures that make a clean, separate state
These are good software design rules that make your production code more reliable, not just for tests.
Creating a Culture That Stops Flaky Tests
Flaky tests can't be fixed by technology alone. You need team rules and practices that stop flakiness from building up in the first place.
Make Flakiness Clear and Not Okay
Teams put up with what they keep track of. Flaky tests spread when you can't see them. Make the flaky test rate a dashboard metric. During code reviews, point out tests that are flaky. When you add flaky tests, think of them as production bugs that you should avoid and fix right away.
Some teams have a "you flake it, you fix it" policy, which means that the person who wrote the flaky test is responsible for finding out what went wrong and fixing it. This makes people responsible and encourages them to write stable tests ahead of time.
Put Money Into Test Infrastructure
Flaky tests are often a sign that the test infrastructure isn't good enough. Flakiness comes from shared, overloaded CI runners. So do test environments that are too fragile and test tools that are missing.
Platform teams should give:
- Isolated build environments for each test run
- Libraries of test fixtures that are in good shape
- Clear patterns and examples for common test situations
- Local CI environments are easy to set up again
Flakiness goes down naturally when it's easier to write stable tests than flaky ones.
Keep Fast Unit Tests and Slow Integration Tests Separate
When you mix fast, predictable unit tests with slow, environment-dependent integration tests, the integration test flakiness spreads to everything else. Instead of just the integration layer, developers learn not to trust any tests.
Group test suites by how fast and stable they are. Every time you commit, run fast, stable unit tests. Run integration tests less often or on a different track. Test Intelligence will only run the integration tests that are needed based on changes to the code.
This tiered approach means that most developer feedback comes from quick, reliable tests, and full integration coverage still happens without breaking the inner loop.
How Modern CI Platforms Automatically Deal With Flakiness
When a team gets too big, manual flaky test management doesn't work anymore. Modern platforms use automation and smart technology to solve the problem.
ML-Powered Detection That Gets Better Over Time
Harness CI uses machine learning to look at test patterns from thousands of runs. The system learns which tests tend to fail, when, and how often.
This is more than just finding out if someone "passed then failed." Advanced algorithms can find patterns like "fails more often under load," "flakes in parallel but not sequential runs," or "only flakes on certain OS versions."
The longer the system runs, the better it gets at telling the difference between real problems and false alarms.
Automatic Quarantine Without Any Human Action
The system automatically quarantines when it finds a flaky test. No platform team meetings, no filing tickets by hand, and no arguing about whether this test is "flaky enough" to be quarantined.
Quarantined tests still run and report results, but they don't stop builds or count as failures. Developers can look into quarantined tests when they have time, but they aren't held up by random failures.
This keeps both coverage (tests still run) and signal quality (builds aren't randomly red).
A Lot of Analytics and Reporting
Platform teams need to see not only the status of individual tests, but also the trends of flaky tests. Dashboards on modern CI platforms show:
- Flaky test rate over time for all teams and repositories
- The most problematic tests, ranked by how much they affect the system (frequency × failure count)
- Metrics for quarantine status and time spent in quarantine
- Patterns of root causes and suggested fixes
This information helps decide which problems to fix first and shows whether the flakiness is improving or worsening over time.
Real-World Effect: What Teams Get Out of Fixing Flakiness
When teams deal with flaky tests in a planned way, the benefits spread across many areas.
Developer productivity returns: Teams say they get 10–20% more done after eliminating flaky tests. This is because they don't have to spend time on false investigations and reruns.
Restoring trust: Developers only pay attention to failures and look into them thoroughly when they trust the test results again. This finds real bugs sooner and improves the quality of production.
Faster feedback loops: PR validation runs finish faster and provide useful feedback the first time, without needing to retry or investigate failures.
Less expensive infrastructure: Teams stop running tests "just to be sure" or the whole suite because they don't trust selective execution. When the tests that Cache Intelligence and test selection are based on are reliable, they work better.
Cultural change: Getting rid of flakiness shows that the platform team cares about developers' experience. It gives other CI improvements greater credibility and moves the whole company toward better testing practices.
One engineering team reported cutting test maintenance from around 10 hours per week to about 2 hours per week by aggressively removing and refactoring flaky end-to-end tests. Another organization claimed flaky tests cost them 40 hours per week before they deleted 70% of their problematic tests. With systematic detection, quarantine, and remediation, teams see faster builds, happier developers, and fewer production incidents.
Stop Putting Up with Flaky Tests
Flaky tests don't have to happen all the time when you make software. They're a sign of not having the right tools, not following the right practices, and having too much technical debt.
To fix the problem, you need three things: automated detection to identify where the flakiness is, systematic remediation to fix the root causes quickly, and preventive practices to ensure new flakiness doesn't build up faster than you can fix old problems.
All three of these things are made smarter and more automated by modern CI platforms. AI-powered detection finds flaky patterns on its own. Quarantine systems maintain signal quality without blocking teams. Analytics reveal patterns and help set priorities for problem-solving.
Your developers shouldn't have to be detectives every time a test fails. Make flaky tests someone else's problem, like the CI platform's, so your team can spend less time fixing test infrastructure and more time adding new features.
Are you ready to get rid of flaky tests in your pipelines? Learn how Harness Continuous Integration uses AI to find flaky tests, put them in quarantine, and help fix them on their own.
Flaky Tests: Frequently Asked Questions
How many tests that are flaky are normal?
Healthy test suites keep flaky rates between 1% and 2%. You have a systemic problem that needs to be fixed right away if more than 5% of your tests are flaky.
Should I get rid of flaky tests or try to fix them?
Not at first. Quarantine flaky tests first, so they don't stop builds but still send signals. Then look into whether they're showing real problems or just poorly written tests. If they're testing important situations, make sure they work. Think about deleting them if they are unnecessary or not worth much.
How long does it take to fix a test that keeps failing?
It can take anywhere from 15 minutes for simple timing issues to several days for more complicated race conditions or architectural problems. The average time for all the studies is 1 to 3 hours per test. This is why it's important to automate detection and prioritization: you want to fix the flaky tests that have the biggest effect first.
Can flaky tests show bugs in production?
Yes. Some flaky tests show real race conditions, timing problems, or behavior that isn't always the same, which could affect users. Don't just call a flaky test "just a bad test." Look into whether it's showing real problems with the code. Flakiness can sometimes be a signal, not just noise.
Do parallel test runs make things more flaky?
Parallel execution shows problems that sequential runs hide, like test pollution, race conditions, and resource contention. The parallelism isn't causing problems; it's just showing problems that were always there. Instead of avoiding parallelism, fix the root problems.
How do tools that use AI find flaky tests?
Machine learning models look at test results from hundreds or thousands of runs and find patterns like "passes and fails on the same code," "fails more often under certain conditions," or "failure rate correlates with infrastructure load." These systems are much better and faster at finding flaky tests than people are.

CI/CD best practices
- CI/CD best practices let teams deliver software faster by creating a standard way to build, test, and deploy.
- Making small, frequent changes and using fast, reliable pipelines lowers risk and keeps builds stable.
- The right platform helps your teams make CI/CD best practices part of their daily routine.
Modern software teams are under constant pressure to ship faster without breaking production. That’s why CI/CD best practices have become essential for high-performing DevOps organizations. Continuous integration and continuous delivery (CI/CD) help automate builds, testing, and deployments — but simply installing a pipeline tool isn’t enough. Without the right practices, pipelines become slow, flaky, and difficult to govern.
In this guide, we break down the most important CI/CD best practices for building fast, stable pipelines - from trunk-based development and intelligent test selection to progressive delivery and DORA metrics.
Implementing Continuous Integration and Continuous Delivery (CI/CD) has become a critical success factor. CI/CD enables teams to rapidly and reliably deliver high-quality software by automating the build, test, and deployment processes. However, simply adopting CI/CD is not enough; to truly reap the benefits, teams must follow best practices that ensure efficiency, reliability, and consistency. In this blog post, we'll explore key CI/CD best practices and how the Harness Software Delivery Platform can help you optimize your software delivery pipeline.
What Are CI/CD Best Practices?
CI/CD best practices are the habits that keep your pipelines fast, reliable, and predictable as your teams and systems grow. They guide how you commit and review code, build and test artifacts, deploy changes, and measure and improve the process. When teams follow the same best practices, there are fewer surprises in production, less time spent fixing deployments, and more time to deliver new features.
This guide covers the most important CI/CD best practices and explains how they help create a strong software delivery process.
- Commit Early, Commit Often
Making frequent, small integrations is a simple but powerful CI/CD best practice. It helps keep your pipeline fast and your main branch stable.
- Try to merge code into the main branch often, ideally once per developer each day. This keeps merge conflicts small and helps you get feedback quickly.
- Split your work into small, reviewable pieces that can pass tests and be deployed on their own, instead of using long, risky branches.
- Run fast checks locally before pushing to avoid trivial red builds and wasted CI cycles.
- Keep branches short-lived and use trunk-based development. This keeps your history clean and makes sure the main branch is always ready to release.
- Use fast, intelligent pipelines so frequent commits do not slow anyone down. Run only the tests affected by each change.
- Use incremental builds to cut down rebuild time. This way, developers get feedback in minutes, even when they commit often.
- Use CI analytics to track build and test performance over time. This data helps you keep the 'commit early, commit often' approach working as your codebase grows.
- In trunk-based development, developers integrate into the main branch at least once per day. In GitFlow-style workflows, this principle still applies — but changes are merged into short-lived feature branches that integrate back into main quickly.
- Get Back to Green Quickly
A green build is a happy build. In CI/CD, it's crucial to maintain a stable and reliable build process. If the build is failing, it should be the top priority to fix it. Failing not only hinders the delivery process but also erodes team confidence and productivity. Implement automated tests, linters, and code quality checks to catch issues early and ensure that the main branch remains in a deployable state.
This said, if tests are never failing and the build never turns red, you are probably not testing well enough or moving quickly enough. The occasional broken build is fine. The team simply needs to prioritize
Harness CI offers extensive testing capabilities, including automated unit, integration, and acceptance tests. With Harness's Test Intelligence feature, you can optimize your test execution by automatically identifying and running only the tests affected by code changes, saving time and resources.
- Build Only Once
Building artifacts multiple times across different stages of the pipeline introduces unnecessary complexity and inconsistency. Instead, adopt the practice of building once and promoting the same artifact through the various stages of testing and deployment. This ensures that the artifact being tested and deployed is the same one that was built, reducing the risk of introducing discrepancies.
Harness simplifies artifact management with centralized artifact storage. You can store and version your build artifacts in one place, ensuring the same artifact is promoted consistently through every stage of your CI/CD pipeline. This practice is often called artifact immutability, i.e., build once, then promote the exact same artifact across staging and production to prevent environment drift.
- Standardize Pipelines with Templates and DRY Patterns
If every team has its own one-off pipeline, CI/CD best practices will never stick. Standardization is how platform teams encode the “golden path” and keep pipelines maintainable over time. Start by identifying the common stages every service needs, such as build, unit tests, security scans, and deployment to staging and production, then capture those stages in reusable templates. Give application teams a clear extension model so they can add service-specific steps without copy-pasting entire pipelines. This DRY approach makes it easier to roll out improvements, because you change the template once instead of editing dozens of separate configurations.
Harness pipeline templates are built for exactly this: platform engineers define the shared workflows, while product teams plug into those templates and still keep the autonomy they need.
- Streamline Your Tests
Slow, noisy test suites can quickly ruin CI/CD best practices by making every commit a long wait. The goal is to keep quality high and make your pipeline smart about which tests run and when.
- Organize your tests in layers. Start with fast unit tests, then run API or integration tests, and finish with a few end-to-end or UI tests. This way, developers get feedback in minutes instead of hours.
- Run fast tests early and often. Trigger unit and key integration tests on every commit, and reserve full regression suites for scheduled or pre‑release runs.
- Parallelize wherever you can. Split them across multiple workers or nodes so the total test time depends on your infrastructure, not just your codebase size.
- Continuously prune and refactor. Remove duplicate tests, fix or isolate flaky ones, and keep your suites small so you get clear, useful results.
- Use intelligent test selection rather than brute-force testing. Test impact analysis lets you run only the tests affected by a change, keeping coverage high and cutting pipeline time.
- Keep an eye on your test metrics. Use CI analytics to track test duration, failure rates, and other trends. Use this data to improve your test suites.
Most high-performing CI/CD pipelines follow the testing pyramid:
- Many fast unit tests
- Fewer integration tests
- Minimal end-to-end/UI tests
- Secure Your CI/CD Pipeline
Security should be part of CI/CD from the start, not added at the end. Begin by keeping secrets out of source control, limiting who can change pipelines and environments, and using SSO and multi-factor authentication for access.
Next, make security checks a main part of your pipeline, not just an extra step. Add dependency scans, container image scans, and policy-as-code steps to block non-compliant changes before they go live.
Strong audit trails are another core CI/CD best practice, so you always know who deployed what, when, and where. Harness supports these practices with environment-aware RBAC, policy-as-code, and detailed deployment history, so you can move fast without losing control.
Modern CI/CD best practices include embedding SAST, DAST, container scanning, and SBOM generation directly into pipelines to support DevSecOps and supply chain security initiatives.
- Clean Your Environments
Consistent and reliable environments are essential for successful CI/CD. Ensure that your environments are versioned, reproducible, and disposable. Use infrastructure-as-code (IaC) practices to define and manage your environments, enabling version control and easy rollbacks. Clean up environments after each deployment to avoid configuration drift and ensure a fresh start for the next deployment.
Harness provides robust deployment and environment management capabilities. With Harness's IaCM, you can define and manage your environments using popular IaC tools like Terraform, CloudFormation, and Kubernetes manifests. Harness also supports automatic environment cleanup, keeping your environments clean and consistent.
- Make It the Only Way to Deploy to Production
To ensure consistency and reliability, establish your CI/CD pipeline as the sole path to production deployment. Discourage manual deployments or ad-hoc changes to production environments. By enforcing deployment through the pipeline, you maintain a standardized and auditable process, reducing the risk of human error and enabling easier rollbacks if needed.
With Harness's pipeline governance features, you can enforce policies and approvals, ensuring that only authorized changes make it to production.
- Release Progressively
Deploying an entire application all at once is no longer in vogue. We now understand that deploying little by little delivers a better user experience while minimizing risks. Consider deploying an application to a cluster using techniques like a Canary deployment. Canary deployments deploy the new version alongside the existing, sending only a small amount of traffic to the new one. Only after seeing that users are successful with the new version is the deployment completed, removing the old version. This approach exposes only a few users to the new version at first, helping minimize the risk and ensuring that rollback (disabling the new version) is easy.
Another approach to progressive delivery is to enable individual features separately from releasing the new version of the code. A feature management tool will allow you to first see that the new version of the code is stable, then experiment with each new feature, making sure they have the desired impact. This approach refines your CD significantly.
- Monitor and Measure Your Pipeline
To keep improving your CI/CD process, you need to see how your pipeline works in real situations. Track basics like how long pipelines take, where they fail most, and how often deployments succeed or need rollbacks. Use analytics to find bottlenecks, spot slow or flaky stages, and check if your changes help. Treat this as an ongoing feedback loop: review the data, pick one thing to improve, make the change, and check the results. For a more detailed view, you can add DORA metrics, which we’ll discuss next.
- Measure CI/CD Health with DORA and Beyond
You can’t improve what you don’t measure, and CI/CD is no different. Start with the four DORA metrics: deployment frequency, lead time for changes, change failure rate, and mean time to recovery (MTTR). These show how fast you deliver changes, how often things go wrong, and how quickly you recover.
As you get more advanced, add other metrics like build time, test flakiness, or time waiting for approvals to find specific pipeline bottlenecks.
A key CI/CD best practice is to make these metrics visible to your team, review them often, and connect process changes to real improvements. Harness helps by showing delivery analytics from your pipelines, so you can see your metrics change as you improve.
- Make It a Team Effort
CI/CD isn't just a tool or a process; it's part of a DevOps culture. Get everyone involved, including developers, testers, and operations, when designing and running your CI/CD pipeline. Encourage teamwork and shared ownership so everyone helps improve the process. Offer training and support to make sure everyone understands and follows best practices.
Harness supports collaboration and teamwork through features like role-based access control (RBAC) and policy-as-code. You can define granular permissions and policies to ensure that team members have the right level of access and control over the pipeline. Harness also integrates with popular collaboration tools, making it easy to share information and work together effectively.
Harness Your CI/CD Potential
While following CI/CD best practices is essential, having the right tools and platform can greatly streamline and enhance your software delivery process. The Harness Software Delivery Platform streamlines software delivery so pipelines stay fast and reliable instead of becoming another source of toil.
Harness CI accelerates builds and tests with intelligent caching, optimized cloud builds, and features like Harness Test Intelligence to prioritize the most relevant tests and shrink feedback cycles. Out-of-the-box integrations and templates minimize custom scripting and heavy configuration, so teams can onboard quickly and focus on delivering features, not wiring tools together.
Governance and compliance are built in rather than bolted on. With granular RBAC and policy-as-code, including DevOps pipeline governance, you can enforce approvals, security scans, and compliance checks, without blocking developers.
Putting CI/CD Best Practices into Action
CI/CD best practices help teams move from fragile, unpredictable releases to a steady, reliable delivery process. By committing early and often, keeping builds green, building once, streamlining tests, securing and cleaning environments, using the pipeline for all production deployments, releasing in stages, and tracking key metrics, you build a pipeline that supports fast change. Start with one or two practices, make them habits, and add more over time. Soon, your CI/CD pipeline will be a strength, not a bottleneck.
If you want a platform that bakes these practices into your day-to-day workflows, try Harness and see how quickly your CI/CD pipeline can evolve.
Frequently Asked Questions About CI/CD Best Practices
What are the most important CI/CD best practices to start with?
If you’re just starting out, focus on a few CI/CD best practices that give the most value: commit early and often, keep the main branch ready to deploy, run automated tests on every change, and use the pipeline as the only way to reach production. Once you have these basics, you can add progressive delivery, security checks, and advanced governance without overwhelming your team.
How do CI/CD best practices change for microservices versus a monolith?
The main principles don’t change, but the impact is bigger with microservices. You need consistent templates and standards so every service uses the same process for builds, tests, and deployments. You also need better observability and progressive delivery, since one release might involve several services rolling out together instead of just one big application.
How can we speed up our pipelines without sacrificing test quality?
Start by cutting out obvious waste: remove duplicate tests, fix or isolate flaky ones, and run fast unit tests early so developers get quick feedback. Use test impact analysis and incremental builds to avoid repeating work that hasn’t changed. The goal is to keep quality high while making the pipeline smart about which tests matter for each change.
What metrics should we track to know if our CI/CD is healthy?
Start by tracking the four DORA metrics, since they show how fast and stable your process is: deployment frequency, lead time for changes, change failure rate, and MTTR. Then add a few extra metrics that fit your team’s needs, like average build time, CI queue time, or time from merge to production. Healthy pipelines have frequent, small deployments, short lead times, low failure rates, and quick recovery when things go wrong.
How do we keep CI/CD secure while still enabling fast releases?
Make security checks part of your automated pipeline, running on every change instead of being done manually at the end. Use a secret manager, limit access to CI/CD systems, and add vulnerability scans and policy-as-code rules to your pipelines. When these controls are built into the process, developers can move quickly while the pipeline enforces security and compliance.
When is it time to adopt progressive delivery and feature flags?
If deployments start to feel risky or you delay releases 'just in case,' it’s time to try progressive delivery and feature flags. Strategies like canary and blue/green deployments let you release more often by limiting the impact of each change. Feature flags let you turn features on or off without redeploying. These approaches turn big, stressful launches into smaller, safer steps that fit well with modern CI/CD.

Code Coverage: Measure, Improve, and Scale Quality in CI
- Code coverage makes "we think this is tested enough" a standard that can be measured and enforced in your CI pipeline.
- The goal is not to cover everything 100% of the time, but to have high-quality coverage where it matters most, supported by reasonable gates and policies.
- Teams can increase coverage without slowing down development by using modern methods like Test-Driven Development (TDD), AI-assisted test generation, and even gamification.
Most engineering teams know the difference between “we have tests” and “we know we’re well-tested.” Your CI builds may be green, but without code coverage, it’s hard to prove how much of your code is actually exercised by automated tests.
Code coverage measures what percentage of your code runs during tests (lines, branches, and functions), and when you wire it into CI gates, it becomes an enforceable quality signal and not a vanity metric.
Code coverage is meant to close the gap between feeling safe and knowing you are. When used correctly, code coverage becomes a measurable signal of test completeness (what runs), and, combined with good assertions and reviews, supports quality and maintainability.. One that you can connect directly to approvals, policies, and decisions about deployment
This is where platforms like Harness CI come in. They turn coverage from something you think about after the fact into a quality gate that is part of your pipeline logic.
What Is Code Coverage?
Code coverage tells you how much of your source code is executed when your automated tests run.
A simple way to picture it:
- Lines, functions, and branches of code that are run at least once during tests are all part of the covered code.
- Your tests never touch uncovered code.
When you connect coverage to CI, it becomes more than just a number on a dashboard; it becomes a key indicator of software reliability and maintainability. Coverage is not just a metric on a dashboard; it becomes a key indicator of software reliability and maintainability when you hook it into CI. For teams already building out their continuous integration best practices and CI/CD pipelines, coverage fits naturally into that foundation:
- It shows whether the tests are using the code paths you need.
- It brings to light high-risk, untested areas where bugs quietly build up.
- It gives a strong base for making and enforcing quality standards.
The most important change happens when coverage is tied to gates inside CI/CD. Minimum thresholds become part of the pipeline logic:
- Every change must meet predefined coverage standards before it can be merged or deployed.
- Some tools expose this as PR checks that block merges when coverage falls below the bar.
- The pipeline itself makes sure that your company's definition of "good enough" is followed.
Instead of arguing about whether “this area is probably fine,” teams can align around a shared, measurable standard.
TL;DR:
Code coverage is: evidence that tests execute code paths.
Code coverage isn’t: proof that tests assert the right behavior or that bugs can’t happen.
The Main Types of Code Coverage (and How to Use Them)
There isn't just one number for code coverage. Different types of coverage answer different questions about how well your system is tested.
Line / Statement Coverage
What it measures
The percentage of executable lines or statements that run at least once during tests.
Why it matters
- Provides a straightforward baseline: are we even executing this code at all?
- Quickly highlights large sections of dead or untested code.
Most teams start here and often use line or statement coverage as the initial threshold for quality gates.
Function / Method Coverage
What it measures
The percentage of functions or methods that are called at least once during testing.
Why it matters
- Makes sure that public APIs, services, and utility functions are not completely untested.
- Makes it easier to think about coverage in modular architectures where different services or packages own different parts.
When used with service-level views in CI dashboards, function coverage is very useful, especially for teams that are already keeping an eye on continuous integration performance metrics like build duration and failure rates.
Branch and Condition Coverage
Branch coverage: whether each branch of control structures executed.
Condition coverage: whether each boolean sub-expression evaluated to true/false (often harder, less commonly enforced).
Some tools report branch coverage; others also report condition coverage (true/false evaluation of boolean sub-conditions).
What it measures
Whether all logical branches/conditions (e.g., if/else, switch cases, and boolean conditions) are executed by tests.
Why it matters
- Directly targets complex business logic and error handling.
- Catches situations where a line of code runs, but some decision branches never run in tests.
Branch/condition coverage is very important because missing even one branch can cause big problems, like deciding who can access data, billing edge cases, and checking the validity of data.
Mutation Coverage (Advanced, but Powerful)
What it measures
Mutation coverage doesn't ask, "Did this line run?" Instead, it asks, "Would tests fail if this logic changed in a small, but important way?"
Tool for testing mutation:
- Introduce small changes (“mutations”) into the code.
- Run the test suite again.
- If a test still passes, be suspicious because the mutation "survived."
This gives you a much clearer picture of test quality:
- High line coverage with low mutation coverage often means that the tests are shallow and are light on assertions.
- High mutation coverage suggests that tests do more than just run code; they also protect the system's behavior.
Mutation testing is compute-heavy. Most teams run it on critical packages, nightly, or on changed code rather than every commit.
Not every team needs to start with mutation coverage, but it’s a powerful addition for critical services or regulated environments.
How to Measure Code Coverage in CI (Tooling)
Keep it tool-agnostic but practical:
- Java: JaCoCo
- JS/TS: Istanbul/nyc
- Python: coverage.py
- .NET: coverlet
- Go:
go test -cover - C/C++: gcov/lcov
Publish coverage reports as CI artifacts and comment summary + diff coverage on PRs.
What Needs to Be Clear Before You Wire Coverage into CI
There are a few things that need to be in place before you wire coverage into your CI pipelines.
1. Organizational Coverage Requirements
Teams should be aware of:
- What is the expected level of coverage (for example, 70–85% line coverage for most services)?
- Which systems, like the payment, identity, and healthcare modules, need to meet higher standards?
- When flexibility is okay, like with experiments or tools that are only used by the company.
When there aren't clear expectations, coverage is just another "nice-to-have" that people ignore when they have to meet a deadline.
2. A Plan for Raising Coverage
Coverage metrics are never perfect. The question is, who is to blame, and what should they do?
Here are some good decisions to make right away:
- Ownership: Which team is in charge when there isn't enough coverage for a service?
- Prioritization: Are coverage improvements planned work, part of regular grooming, or required in the same PR that adds code with low coverage?
- Review: How do people talk about coverage in code reviews, retros, or architecture reviews?
3. A Shared Understanding of Why Coverage Matters
People are more likely to agree to coverage if they know what it will do for them:
- Fewer defects that go unnoticed
- More trust in refactors
- Better handoffs between teams
- Audits and security reviews are easier.
Leaders and engineers stop seeing coverage as an extra task and start seeing it as part of delivery when it is linked to CI/CD security and testing methods.
Step‑by‑Step: Implementing Code Coverage in CI
Once everyone agrees on "why" and "how much," the next step is to carefully plan how to carry out the plan.
Step 1: Establish a Real Baseline
Start by answering two questions:
- What is the coverage right now?
- Run your test suite with coverage enabled across all major services.
- Capture metrics for line, function, and (if available) branch coverage.
- How does that compare to your guidelines?
- If the current state is 45% and the requirement is 75%, the gap is clear.
- If there are no guidelines yet, these numbers will help you establish realistic targets.
After that, look over the reports:
- Find modules, files, or functions that are not meeting your expectations.
- Pay close attention to production-critical paths that haven't been tested enough.
At this point, teams often make the mistake of quietly writing off some low-coverage areas as "not relevant." If code goes live and is used in real workflows, it is relevant. If it really isn't, it probably shouldn't be sent.
Step 2: Close Gaps with High‑Quality Tests
Finding low coverage is only helpful if it makes people act differently.
The next step is to make tests on purpose:
- Write high‑quality tests focused on behavior, not just execution.
- Cover not only happy paths but also error handling, edge cases, and failure modes.
- Include tests for parts of the system that have historically caused incidents.
Validation should run through CI:
- Developers open PRs or MRs with new tests.
- The pipeline runs tests with coverage enabled.
- Coverage reports for that change show whether the targeted areas improved.
- If not, reports guide developers to write additional tests for the uncovered logic.
These checks work well with other daily CI tasks like linting, security scans, and style checks that developers already do in the same CI/CD toolchain.
Step 3: Enforce Standards with Quality Gates
After measuring and making things better, the next step is to enforce.
Quality gates check coverage metrics and stop the pipeline if they don't meet the standards. Here are some common patterns that show up:
- Failing a build if the overall coverage goes below a certain level.
- Blocking merges if coverage for changed files regresses by more than a small percentage.
- Requiring higher coverage for specific directories or modules.
This is when coverage goes from being a suggestion to a requirement for a release. If the threshold isn't met, the code can't be merged or deployed.
Pro Tip: A practical gate is diff coverage: require new/changed code to meet a higher bar (e.g., 80–90%) even if the repo overall is lower.
Step 4: Encode Rules as Policies
Policies, not just pipeline scripts, often control quality gates in bigger companies.
For instance:
- A policy might say, "If line coverage for that service is less than 80%, any production-level Java pipeline must fail."
- Another might say: “Deployments to a regulated environment require both minimum coverage and passing security scans.”
Platforms that work with policy engines like OPA can check coverage as part of a bigger CI/CD governance plan, along with rules for deployment, protections for the environment, and rules for managing changes.
Common Myths and Pitfalls of Code Coverage
Coverage is a powerful tool, but if you don't know how to use it correctly, it can do just as much harm as good. Three patterns are often seen.
Myth: 100% Coverage Equals 0 Bugs
A test suite can execute every single line and still miss:
- Critical edge cases
- Concurrency issues
- Misconfigurations
- Logical errors without assertions
High coverage is useful, but absolute coverage is rarely necessary. The better question is:
- Do the most critical parts of the system have strong behavioral tests?
- Are tests designed to fail when something important breaks, not just to execute code?
In some safety-critical or regulated contexts, teams may be required to demonstrate very high coverage for specific components, often alongside stronger evidence than coverage alone (requirements traceability, audits, etc.).
Pitfall: Chasing Numbers Without Context
Rules that aren't based on logic, like "everything must be 90%," can:
- Encourage shallow, low‑value tests that exist only to pass gates.
- Inflate pipeline duration with little real benefit.
- Lead to pressure to disable coverage checks after they “get in the way.”
A better pattern is:
- Use risk‑based thresholds: higher for payments, identity, or PII‑handling services; more flexible elsewhere.
- Add coverage to other signals, such as flakiness, defect density, or incident history.
- Treat coverage regressions as a starting point for conversation, not an automatic trigger to assign blame.
Pitfall: Ignoring “Unimportant” Code
Areas with low coverage are often connected to parts of the system that developers would rather not think about:
- Legacy modules “due to be rewritten” (but not this quarter).
- Utility libraries with no clear ownership.
- Older services that are stable but business‑critical.
You need to test these paths if they are still in your production call graphs. Coverage reports show where the gaps are, and governance and ownership models make sure they get fixed.
Keeping Coverage High Without Slowing Developers Down
Coverage and speed don't have to be at odds. If you do things the right way, they can help each other.
Test‑Driven Development (TDD)
Test‑driven development shifts the usual sequence:
- Write a test that describes the behavior you want.
- Write the code to make it pass.
- Refactor with feedback from both code and tests.
This naturally produces code that is:
- Easier to test
- Better covered
- More resilient to refactors
TDD does not need to be applied universally to be valuable. Even reserving it for core business logic or safety‑critical components can dramatically raise meaningful coverage.
AI‑Assisted Test Generation
Modern AI systems are well‑suited to reading code and suggesting tests:
- They can examine a function and propose unit tests for likely paths and edge cases.
- They can highlight parts of a module that are untested and generate candidate tests targeting those flows.
- Developers remain in control. They review, edit, and curate tests rather than writing every assertion from scratch.
This aligns with how AI is increasingly used in CI/CD automation more broadly, from CI tools that prioritize pipeline speed to intelligent test selection and failure analysis.
Segmenting Coverage by Team, Area, and Test Type
Not all coverage is the same, and not all teams have the same duties. Segmenting helps keep rules from being too broad:
- Group coverage metrics by team or ownership domain.
- Track coverage separately for frontend vs. backend, or for domain‑specific services.
- Distinguish between unit, integration, and end‑to‑end coverage when setting expectations.
This clarifies:
- Who needs to respond when a gate fails.
- Where to invest most in raising coverage.
- Which coverage metrics are relevant for each part of the architecture.
Code Coverage as Part of Security, Linting, and Governance
Coverage doesn’t exist in isolation. It plays into several other aspects of software quality and risk.
Security Testing
High coverage around security‑sensitive code paths (such as authentication, authorization, data validation, encryption) is essential:
- It improves confidence that changes in these areas are vetted by meaningful tests.
- It reduces the risk of accidental regressions in critical security logic.
When you combine coverage with application security testing and protections for the supply chain, you get a stronger defense-in-depth posture.
Linting and Static Analysis
Static analysis highlights risky or complex code. Coverage shows whether tests execute those risky areas, helping you decide where to add tests or refactor.
Used together:
- Static tools highlight complex or risky sections.
- Coverage tells you if those sections are protected by tests.
- Teams can prioritize both refactoring and test investment intelligently.
Policy and Governance
Coverage also becomes part of governance:
- Policies can set minimum coverage levels that must be met before code can move to certain environments.
- Audit trails can show not just that tests passed, but that a defined minimum coverage level was enforced.
- Compliance reports can include coverage alongside security scans and change history.
This is especially useful for organizations that already use policy-driven pipelines or or are watched over by the government.
Motivating Teams: Gamifying Code Coverage
Developer gamification around coverage is a good idea that isn't used enough.
By tracking coverage contributions by individuals and the team, and displaying that data in leaderboards, organizations can:
- Recognize engineers who consistently improve coverage in important areas.
- Turn small coverage gains into visible wins.
- Foster friendly competition that keeps coverage on everyone’s radar.
The important thing is to make gamification feel like praise and motivation, not punishment. When developers see how their work affects code quality metrics, they know that those metrics are important to the company. They are more likely to see coverage as part of the job, not just something they have to do.
Coverage Accuracy
These are common sources of misleading coverage numbers:
- Generated code / vendor code can inflate or distort coverage (exclude it).
- Instrumentation limits: some languages/frameworks under-report coverage for async/concurrency, reflection, or dynamically generated code.
- E2E coverage ≠ unit coverage: track by test type to avoid false confidence.
Turning Coverage into a First‑Class CI Signal
Getting good code coverage in CI isn't just about hitting a number.
It is about:
- Making it clear and possible to measure how tests and code are related.
- Focusing coverage where it really lowers risk, not just where it makes a dashboard look better.
- Putting coverage into gates and policies so that standards are always followed.
- Using TDD, AI, segmentation, and even gamification to make sure that coverage stays in line with developer flow.
When coverage is seen as a top-tier CI signal, every change that goes through the pipeline has to meet the organization's quality standards. This makes fast delivery more disciplined and replaces guesswork with proof.
Harness CI is a great way for teams to do this without having to build everything from scratch. It has intelligent test selection, rich analytics, AI help, and policy-driven gates all in one place. Start using Harness CI today and see how it fits into your pipelines.
FAQ: Code Coverage in Continuous Integration
What is a good code coverage percentage for CI?
For most services, teams aim for roughly 70–85% line coverage as a baseline, with higher targets for critical domains like payments, identity, or healthcare modules. The “right” number depends on risk: use stricter thresholds for high‑impact code and more flexible targets for low‑risk utilities and internal tools. What matters most is consistency—encode these expectations in CI gates so they’re actually enforced.
Is 100% coverage worth it?
Very rarely. Chasing 100% coverage can push teams toward shallow tests written just to satisfy a number, slowing pipelines without meaningfully reducing risk. It’s usually more effective to target high coverage on critical paths, combined with strong assertions, branch coverage for complex logic, and practices like mutation testing where it really matters.
What’s the difference between line and branch coverage?
Line (or statement) coverage measures whether each executable line of code runs at least once during tests. Branch coverage goes deeper, checking whether every decision path—if/else branches, switch cases, and boolean conditions—has been exercised. High line coverage with low branch coverage often means tests touch the code, but don’t explore all the important decision paths.
What is diff coverage and why is it better for legacy code?
Diff coverage measures test coverage only for the code changed in a given pull request or commit. For legacy systems with low overall coverage, diff coverage lets you enforce a higher standard (for example, 80–90% coverage on new or modified lines) without blocking every change because of old, untested code. Over time, this “boy scout rule” approach steadily improves coverage where the code is actively evolving, instead of demanding an unrealistic big‑bang rewrite.
How does coverage relate to test quality?
Coverage tells you what code runs during tests, not whether those tests are meaningful. High coverage with weak assertions, missing edge cases, or flaky tests still leaves plenty of room for defects. To treat coverage as a true quality signal in CI, combine it with strong assertions, branch coverage for complex logic, mutation testing on critical components, and governance rules that keep regressions visible and actionable.
How do I choose coverage thresholds without slowing down delivery?
Start with your current baseline and raise thresholds gradually, prioritizing the riskiest services first. Use diff coverage gates on new/changed code, and only tighten global thresholds once teams have had time to improve tests and stabilize pipelines.
Should all types of tests (unit, integration, E2E) count toward the same coverage metric?
Not necessarily. Many teams track unit, integration, and end‑to‑end coverage separately so they can set different expectations per test type. That makes it easier to spot gaps (for example, strong unit coverage but weak integration coverage around critical flows).
How can I improve coverage in a large legacy codebase without a big‑bang rewrite?
Use diff coverage on every PR, focus on hot paths from production call graphs, and add tests around modules that cause frequent incidents. Treat coverage improvements as incremental, planned work—folded into regular sprints—rather than a one‑time “cleanup project.”
Can high coverage hide problems if my tests are flaky or slow?
Yes. Coverage doesn’t account for flakiness, performance, or stability of the test suite. That’s why coverage should sit alongside other CI signals—test flake rates, failure patterns, and build times—so teams can see when “high coverage” is being propped up by brittle or overly slow tests.
How does coverage work with AI-assisted testing and intelligent test selection?
AI can propose tests that raise coverage on risky or untested paths, while intelligent test selection focuses execution on the tests that actually matter for a change. Together, they help teams increase effective coverage without exploding pipeline times or forcing developers to write every test by hand.

What Is a DevOps Pipeline? Stages, Benefits, and CI/CD Explained
- It creates a structured, repeatable workflow that builds, tests, deploys, and monitors software with minimal manual intervention.
- By integrating automated testing, security checks, and release controls, teams can ship updates faster while reducing risk and maintaining reliability.
- This is also called Shift-left security (DevSecOps): using SAST/DAST, dependency scanning, Policy as Code, etc.
- Continuous Integration and Continuous Deployment/Delivery enable rapid iteration, faster feedback loops, and consistent software releases at scale.
A DevOps pipeline is a critical part of modern software delivery. It is a series of automated steps that move code from commit to production quickly, reliably, and consistently.
At its core, a DevOps pipeline is a system that helps teams build, test, and release apps in an easier way. It cuts down on manual work and mistakes. This helps teams send out updates more often, make better software, and react quickly when the business needs change.
Platforms like Harness help teams operationalize DevOps pipelines by unifying CI/CD, release management, and continuous verification into a single, automated workflow, making scalable, secure software delivery achievable for organizations of any size.
What is a DevOps Pipeline?
A DevOps pipeline is an automated process that shows how code moves from being written to being used by people.
It connects the teams that build, test, run, and protect software into a single, seamless system.
Instead of passing work by hand from one team to another, each step is set up to run automatically, from saving the code to checking that it works well. This helps avoid mistakes and speeds up and smooths everything.
In simple terms, it’s the system that helps teams keep releasing new and improved software all the time.
Benefits of the DevOps Pipeline
A DevOps pipeline delivers significant advantages for software development teams and organizations. Automating and standardizing the release process improves speed, quality, and collaboration across the entire software lifecycle.
- Continuous Delivery & Faster Releases: Automation of build, test, and deployment processes enables teams to release new features and bug fixes more frequently. This shortens feedback loops and allows faster responses to user needs and market changes.
- Improved Software Quality: Automated testing at multiple stages ensures code changes are validated before reaching production. Bugs are identified and resolved earlier in the development cycle, reducing production issues and minimizing costly errors.
- Stronger Collaboration Across Teams: A standardized and transparent delivery process helps developers, testers, and operations teams work more effectively together. Clear workflows improve communication, accountability, and cross-functional alignment.
- Accelerated Time-to-Market: By streamlining the release process, DevOps pipelines reduce overall lead time. Organizations can respond more quickly to competitive pressures and evolving customer demands.
- Risk Reduction & Greater Stability: Consistent, repeatable processes reduce human error and configuration drift. Built-in rollback capabilities and release visibility allow teams to quickly detect and resolve issues, increasing production reliability.
- Scalability & Flexibility: DevOps pipelines can support multiple environments and configurations. This makes it easier to scale infrastructure, deploy across cloud platforms, and adapt to changing business requirements.
- Continuous Improvement: Monitoring and feedback mechanisms provide insights into application performance. Teams can use this data to refine processes, optimize performance, and continuously improve software quality over time.
Core Principles Behind DevOps Pipelines
DevOps pipelines are built on a few important ideas:
- Use automation instead of doing things by hand
- Keep things the same in every environment
- Test and check security early
- Get feedback often
- Manage systems using code
- Watch and track how everything is working
These ideas make sure the pipeline is not just a tool, but a smart system that helps teams deliver software in a safe and reliable way.
Stages of the DevOps Pipeline
The DevOps pipeline typically consists of several stages, each serving a specific purpose. These stages generally include:
- Code review: This stage involves managing the version control system, where developers store and collaborate on their codebase. When a developer submits a change, another developer reviews it before sending it down the pipeline.
- Build: In this stage, the code is compiled, build dependencies are resolved, and deployable artifacts are generated. The build process ensures that the application is ready for testing and deployment. A build will typically include code scans and unit tests, which can provide rapid quality checks without installing the software.
- Runtime testing (aka deployment testing): This stage involves running various tests, integration tests, chaos tests, and performance tests to ensure the quality and stability of the code. Automated testing helps identify bugs and issues early in the development cycle.
- Deployment: Once the code passes all the tests, it is deployed to a staging environment or a production-like environment. This allows for further testing and validation before releasing the changes to the live production environment.
- Release orchestration & management: This stage involves coordinating the release of the application to the production environment. It includes activities like scheduling the deployment, managing rollbacks, and monitoring the release process. This may also include managing feature flags to validate and release individual features.
- Monitoring and feedback: After the deployment, the pipeline continuously monitors the application's performance and collects feedback from users. This feedback helps identify any issues or improvements that need to be addressed in future iterations.
Example: A typical DevOps pipeline for a containerized app
- Trigger: PR merge to main
- Build Docker image
- Run unit tests + lint + SAST
- Push to registry
- Deploy to staging via Helm
- Run integration tests
- Approval gate
- Canary deploy to prod
- Auto-rollback if error budget breaches
What are CI/CD Pipelines?
CI/CD pipelines, also known as Continuous Integration (CI) and Continuous Delivery (CD) pipelines, are an integral part of modern software development practices. They provide a structured framework for automating the build, test, and deployment processes, enabling teams to deliver software changes more efficiently and reliably.
CI is the practice of regularly merging code changes from multiple developers into a shared repository. The CI pipeline automates the process of building and testing the code whenever changes are committed.
It ensures that the codebase remains in a consistent and functional state by detecting integration issues, compilation errors, and other bugs early in the development cycle. By catching these issues early, CI helps maintain code quality and reduces the risk of conflicts when merging changes.
CD takes the CI process further by automating the deployment of tested and validated code changes to production environments.
Continuous Delivery: deployable at any time, often with a manual approval to push to prod
Continuous Deployment: every change that passes gates goes to prod automatically
The CD pipeline extends beyond the build and test stages to include additional steps such as packaging the application, configuring infrastructure, and deploying the code to various environments. This automation allows for faster and more frequent releases, reducing the time it takes to deliver new features or bug fixes to end-users.
Common Challenges in DevOps Pipelines
DevOps pipelines have many benefits, but teams can still face some problems, such as:
- Too many tools that are hard to manage
- Trouble connecting old systems with new ones
- Too many different pipelines across teams
- Security settings that are not set up correctly
- Keeping passwords and private information safe
To fix these problems, teams need clear rules, simple and standard tools, and clear roles so everyone knows who is responsible.
Take Control of Your Software Delivery
A DevOps pipeline is far more than a sequence of automated steps. It is a strategic framework that enables consistent, reliable, and scalable software delivery.
By integrating automation, testing, deployment, monitoring, and feedback into a unified workflow, organizations can release software faster, reduce risk, and continuously improve their systems.
As software delivery continues to evolve, robust DevOps pipelines remain essential for organizations seeking agility, resilience, and long-term competitive advantage.
Ready to take control of your software delivery pipeline? Explore Harness today to find out.
Frequently Asked Questions (FAQ)
What is a DevOps pipeline in simple terms?
A DevOps pipeline is an automated workflow that moves code from development to production. It builds, tests, deploys, and monitors applications using defined stages, reducing manual work and improving reliability.
What is the difference between a deployment pipeline and a DevOps pipeline?
A deployment pipeline typically focuses on automating the release of software to production. A DevOps pipeline is broader. It includes continuous integration, automated testing, infrastructure provisioning, monitoring, and feedback loops as part of a full software delivery lifecycle.
How does a DevOps pipeline improve software quality?
DevOps pipelines integrate automated testing, code analysis, and validation checks at multiple stages. This helps detect bugs, security vulnerabilities, and integration issues early, reducing the risk of failures in production.
What is the difference between CI and CD?
Continuous Integration (CI) automatically builds and tests code whenever changes are committed. Continuous Delivery (CD) ensures validated code can be released to production at any time. Continuous Deployment takes it a step further by automatically releasing every approved change to production without manual intervention.
How do DevOps pipelines reduce risk?
Pipelines enforce consistent, repeatable processes and reduce human error. They also support rollback mechanisms, feature flags, and advanced release strategies like blue-green or canary deployments to minimize production impact.
Can DevOps pipelines scale across cloud environments?
Yes. Modern DevOps pipelines are designed to work across on-premises, hybrid, and multi-cloud environments. They can automate deployments to containers, virtual machines, Kubernetes clusters, and cloud-native platforms.
What tools are commonly used in DevOps pipelines?
DevOps pipelines often include tools for version control, CI/CD, artifact management, infrastructure as code, security scanning, monitoring, and observability. Many organizations use integrated platforms to unify these capabilities into a single workflow.

Parallel Execution in Modern CI: Best Practices & Results
- Using parallel execution along with test intelligence, caching, and governance can cut CI pipeline times by more than 40% and lower infrastructure costs by up to 76%. This leads to much higher developer productivity.
- You need to map out dependencies, separate flaky tests, use automation tools, and enforce policy-driven governance in order to use parallelism well. This helps keep costs down and keeps things from getting out of hand.
- Harness CI makes parallel execution safe and scalable with AI-powered optimizations, automated migration tools, and built-in compliance. This lets platform teams speed up builds without giving up security or developer control.
Definition: Parallel execution in CI is the practice of running independent build, test, or deployment tasks concurrently to reduce feedback time, improve resource utilization, and control infrastructure costs.
Developers often spend almost half their time waiting for builds that could be faster. Simply adding more resources is not enough. Real improvements come from planned parallelism, using concurrency together with test intelligence, caching, and strong governance.
With this approach, teams can get builds done 4x faster and cut infrastructure costs by up to 80%, all while staying reliable. Harness CI helps achieve these results with AI-powered optimization and strong governance. See how modern parallel execution can speed up your development.
Why Parallel Execution Accelerates CI/CD Velocity and Controls Cost
When your 200+ developers have to wait 40 minutes for build feedback, productivity drops, and your cloud costs go up because of idle compute time. How does running things in parallel make the CI/CD pipeline faster and help developers get more done? Teams get rid of bottlenecks that waste both developer time and infrastructure money by running separate tasks at the same time instead of making them wait in line.
Removing Idle Time Through Concurrent Task Execution
Traditional CI pipelines make tasks wait one after another, wasting resources while jobs are idle. With concurrent processing, you can find independent tasks, such as testing different modules or deploying to separate environments, and run them at the same time on available machines.
Shrinking Feedback Loops to Boost Developer Focus
Quick feedback helps developers stay focused instead of switching tasks while waiting for slow builds. If PR validation takes hours, developers move on to other work and lose track of their changes, which can lead to costly rework.
CloudBees research shows that 75% of DevOps professionals lose over 25% of their productivity due to slow testing cycles. Simultaneous test execution addresses this by distributing test suites across multiple machines, thereby substantially reducing total execution time.
Compounding Speedups Through Intelligent Optimization
Raw concurrency alone doesn't maximize gains; pairing it with smart optimization multiplies benefits while controlling costs. Test Intelligence cuts test cycles by up to 80% by running only tests related to code changes, reducing the work that needs to be parallelized.
Cache Intelligence stops unnecessary downloads of dependencies and pulls of Docker layers across parallel jobs. When used with the fastest CI platform, this leads to even more improvements: fewer tests to run at the same time, faster execution of individual jobs, and lower infrastructure costs because waste is no longer needed.
Implementing Parallel Execution in Legacy Jenkins and Hybrid Stacks
Legacy Jenkins environments consuming 20% of the platform team's capacity need a methodical approach to avoid turning parallel execution into operational complexity. The best practices for implementing parallel execution in complex legacy CI systems start with understanding your current dependencies and stabilizing your foundation before scaling out.
- Map dependencies first: Split jobs by artifact boundaries and data contracts to prevent unexpected dependencies that force sequential execution and negate parallel gains.
- Quarantine flaky tests: Use AI-driven test selection to identify and isolate unreliable suites before distributing builds across multiple nodes.
- Leverage proven plugins: Implement the Parallel Test Executor plugin to automatically split test suites based on historical runtime data without modifying existing test code.
- Standardize with templates: Create reusable pipeline templates that encapsulate parallel patterns, enabling consistent parallelism approaches across multiple teams.
- Migrate incrementally: Start with high-ROI pipelines that have clear build/test phase separation, using migration utilities to automate up to 80% of the conversion work.
By building a strong foundation first, you lower the risk of parallel execution making problems worse and get clear speed improvements. Once dependencies are mapped and tests are stable, teams can focus on governance and cost controls to keep parallelism going as they grow.
Cost, Security, and Governance: Making Parallelism Sustainable
Allocating the right amount of resources demonstrates that parallel execution can reduce cloud costs without compromising security. On-demand build environments with autoscaling only add new machines when they are needed and take them away when they are done, so there is no overprovisioning.
Pairing this with intelligent caching and AI-powered test selection can slash test cycles by up to 80%, while recent research shows parallel execution strategies lower overall operational costs by 40-50% when properly implemented. Company Burst SMS achieved a 76% infrastructure cost reduction by moving to optimized, no-share infrastructure that ensures consistent performance without noisy neighbors.
In addition to optimizing infrastructure, good parallelism needs rules to keep developers productive and stop uncontrolled scaling. Policy as Code frameworks make it easier for teams to set up RBAC controls and manage secrets automatically in CI pipelines with policies that can be tested and versioned.
These automated guardrails prevent unauthorized parallel job sprawl while ensuring secure artifact tracking for all builds. The key is measuring what matters: track four key metrics, queue time, concurrency utilization, cache hit rates, and cost per build, to tune your parallelism strategy continuously.
To summarize:
Speed → parallel stages + test selection
Cost → autoscaling + caching
Control → policy-as-code + RBAC
From Idea to Impact: Operationalizing Parallel Execution With Harness CI
Parallel execution can turn CI pipelines from slow points into fast accelerators when combined with smart caching, selective testing, and good governance. Teams can get builds done four times faster and cut infrastructure costs by up to 76% by using concurrent stages and AI-powered optimizations. The secret is to balance speed and control, using templates, policy rules, and analytics to scale parallelism safely across teams.
Moving from theory to practice requires the right platform foundation. Harness CI streamlines parallel execution through automated migration tools, stage-level parallelism, and built-in troubleshooting that removes operational friction.
Ready to accelerate your CI pipelines while cutting infrastructure costs? Explore Harness Continuous Integration to see how AI-powered parallel execution delivers measurable results for your development teams.
Parallel Execution FAQs for Platform Engineering Leaders
Platform engineering teams take care of CI infrastructure for hundreds of developers who work on many different product teams. This makes it harder and more important to run things in parallel than in normal DevOps setups. When you run a lot of workflows at the same time, problems like making sure tests are reliable, keeping costs down, and following security rules get even worse.
How do we prevent flaky tests from multiplying under parallel execution without slowing feedback loops?
Use Test Intelligence to only run tests that are important, which can cut down on exposure to unreliable suites by up to 80%. Instead of blanket retries, set up targeted retries and auto-quarantine for flaky tests that are found. Separate temp directories and resource limits for sandbox test processes so that tests don't get in each other's way.
What's the best way to cap concurrency to avoid unpredictable cloud bills while keeping PRs fast?
Configure predictive scaling with usage buffers and cooldown windows to avoid cost spikes. Set policy rules that enforce maximum concurrent jobs per team or repository. Combine smart caching and selective test execution to reduce the need for high concurrency while maintaining fast feedback.
How can we parallelize Docker builds and multi-language monorepos without compromising supply chain security?
Enable SLSA L3 compliance with automated software bill of materials generation across parallel build stages. Run each parallel job in isolated build environments to avoid cross-contamination. Cache dependencies at the layer level while maintaining secure verification of cached artifacts.
What governance controls prevent parallel execution from becoming chaotic across teams?
Roll out templates and RBAC to standardize parallel patterns while allowing team customization. Monitor concurrency usage and cost per build through centralized dashboards. Create policy rules that automatically enforce resource limits and security scanning requirements across all parallel workflows without blocking developers.
How do we migrate legacy Jenkins pipelines to modern parallel execution patterns?
Start with high-value pipelines that have clear dependency boundaries and stable test suites. Apply migration utilities to automate up to 80% of pipeline conversion tasks. Map existing job dependencies before parallelizing to avoid hidden bottlenecks that cancel out performance gains from concurrent execution.