Featured Blogs
Harness has been recognized as a Leader in the 2026 Gartner® Magic Quadrant™ for DevSecOps Platforms for the third consecutive year. Harness was also positioned furthest on the Completeness of Vision axis in the report.
Our Key takeaways:
- Harness is named a Leader for the third consecutive year
- Harness is positioned furthest on the Completeness of Vision axis
- Harness continues investing in governed, AI-powered DevSecOps
Harness is the AI platform for engineering, security, and operations teams to build, secure, deploy, govern, and optimize software delivery across the SDLC.
We believe our recognition in the Gartner Magic Quadrant for DevSecOps Platforms reflects the continued evolution of the Harness platform and our commitment to helping teams deliver software faster, safer, and with greater governance across the software delivery lifecycle.
We’re thrilled to share this recognition, which we believe reflects the strength of our product strategy, the breadth of our platform, and our continued investment in helping enterprises modernize software delivery with security, reliability, cost management, and AI built into the development lifecycle.
Today, organizations across industries like United Airlines, Ancestry, and Citi rely on Harness to reduce delivery complexity, improve developer productivity, strengthen governance, and accelerate innovation across increasingly complex software environments.
Why This Matters Now
Software delivery has entered a new era. AI coding assistants are helping teams create software faster than ever, but faster code generation also means more changes, more tests, more vulnerabilities, more deployments, and more incidents for organizations to manage. The next era of DevSecOps will not be defined by who can generate code faster. It will be defined by who can safely convert that speed into reliable business outcomes.
Our view is that the future of DevSecOps is autonomous AI agents, governed and directed by expert engineers. As humans and AI agents both contribute to software change, enterprises will need one connected platform to understand, validate, secure, deploy, observe, optimize, roll back, and prove every change across the software delivery lifecycle.
Our Journey
As a pioneer in modern software delivery, Harness offers over 15 platform products and has built one of the industry’s most comprehensive platforms to support the full spectrum of application development, deployment, security, reliability, feature management, cost management, and operations.
Harness has evolved through a combination of product innovation, internal entrepreneurship, open source investment, and strategic acquisitions. We believe our recognition as furthest on the Completeness of Vision axis in the 2026 Gartner® Magic Quadrant™ for DevSecOps Platforms is proof that Harness is solving problems for our customers in a measurable way.
Over the past year, Harness has continued to expand platform capabilities and AI agents across:
- Security and risk management
- AI-native testing capabilities including flaky test detection and AI impact testing
- Feature Management and Experimentation
- Cloud and AI Cost Management
- AI DLC insights
- Resilience Testing, and more
This matters because software delivery is no longer just about building and deploying code. Teams must now manage security risk, release complexity, infrastructure cost, compliance requirements, production reliability, and the growing impact of AI-generated software. The Harness platform allows teams to adopt what they need, when they need it, in one place.
With operations across North America, Europe, APAC, Latin America, and India, Harness serves organizations of all sizes across industries. Customers choose Harness not only for the breadth of the platform but also for the flexibility to adopt individual modules or the full platform based on their needs, maturity, and business priorities.
What’s Next for Harness
This recognition in our opinion is a milestone, and we’re proud, but we’re even more excited by the road ahead.
We build security in the software delivery lifecycle natively, not as a separate stage or disconnected toolchain. As AI increases the volume of code, changes, and security findings, enterprises will need platforms that connect detection, prioritization, policy, remediation, deployment, and runtime defense into a single, governed workflow.
Harness is focused on helping enterprises meet that moment. We will continue investing in AI software delivery to help teams move faster without losing control. Our goal is to help every organization deliver software that is faster to build, safer to release, easier to govern, and more resilient in production.
Thank you to our customers, partners, employees, and community for your continued trust. We’re excited about the journey ahead and can’t wait to show you what’s next.
Learn More
Get a complimentary copy of the 2026 Gartner® Magic Quadrant™ for DevSecOps Platforms.
Or, to talk to someone about Harness, please contact us.
Gartner Disclaimer
Gartner, Magic Quadrant for DevSecOps Platforms, 2026, Keith Mann, Thomas Murphy, Bill Holz, 15 June 2026
Gartner does not endorse any vendor, product, or service depicted in its research publications and does not advise technology users to select only those vendors with the highest ratings or other designation. Gartner research publications consist of the opinions of Gartner’s research organization and should not be construed as statements of fact. Gartner disclaims all warranties, expressed or implied, with respect to this research, including any warranties of merchantability or fitness for a particular purpose.
GARTNER is a registered trademark and service mark of Gartner, and Magic Quadrant is a registered trademark of Gartner, Inc. and/or its affiliates in the U.S. and internationally, and is used herein with permission. All rights reserved.
Over the last few years, something fundamental has changed in software development.
If the early 2020s were about adopting AI coding assistants, the next phase is about what happens after those tools accelerate development. Teams are producing code faster than ever. But what I’m hearing from engineering leaders is a different question:
What’s going to break next?
That question is exactly what led us to commission our latest research, State of DevOps Modernization 2026. The results reveal a pattern that many practitioners already sense intuitively: faster code generation is exposing weaknesses across the rest of the software delivery lifecycle.
In other words, AI is multiplying development velocity, but it’s also revealing the limits of the systems we built to ship that code safely.
The Emerging “Velocity Paradox”
One of the most striking findings in the research is something we’ve started calling the AI Velocity Paradox - a term we coined in our 2025 State of Software Engineering Report.
Teams using AI coding tools most heavily are shipping code significantly faster. In fact, 45% of developers who use AI coding tools multiple times per day deploy to production daily or faster, compared to 32% of daily users and just 15% of weekly users.
At first glance, that sounds like a huge success story. Faster iteration cycles are exactly what modern software teams want.
But the data tells a more complicated story.
Among those same heavy AI users:
- 69% report frequent deployment problems when AI-generated code is involved
- Incident recovery times average 7.6 hours, longer than for teams using AI less frequently
- 47% say manual downstream work, QA, validation, remediation has become more problematic
What this tells me is simple: AI is speeding up the front of the delivery pipeline, but the rest of the system isn’t scaling with it. It’s like we are running trains faster than the tracks they are built for. Friction builds, the ride is bumpy, and it seems we could be on the edge of disaster.

The result is friction downstream, more incidents, more manual work, and more operational stress on engineering teams.
Why the Delivery System Is Straining
To understand why this is happening, you have to step back and look at how most DevOps systems actually evolved.
Over the past 15 years, delivery pipelines have grown incrementally. Teams added tools to solve specific problems: CI servers, artifact repositories, security scanners, deployment automation, and feature management. Each step made sense at the time.
But the overall system was rarely designed as a coherent whole.
In many organizations today, quality gates, verification steps, and incident recovery still rely heavily on human coordination and manual work. In fact, 77% say teams often have to wait on other teams for routine delivery tasks.
That model worked when release cycles were slower.
It doesn’t work as well when AI dramatically increases the number of code changes moving through the system.
Think of it this way: If AI doubles the number of changes engineers can produce, your pipelines must either:
- cut the risk of each change in half, or
- detect and resolve failures much faster.
Otherwise, the system begins to crack under pressure. The burden often falls directly on developers to help deploy services safely, certify compliance checks, and keep rollouts continuously progressing. When failures happen, they have to jump in and remediate at whatever hour.
These manual tasks, naturally, inhibit innovation and cause developer burnout. That’s exactly what the research shows.
Across respondents, developers report spending roughly 36% of their time on repetitive manual tasks like chasing approvals, rerunning failed jobs, or copy-pasting configuration.
As delivery speed increases, the operational load increases. That burden often falls directly on developers.
What Organizations Should Do Next
The good news is that this problem isn’t mysterious. It’s a systems problem. And systems problems can be solved.
From our experience working with engineering organizations, we've identified a few principles that consistently help teams scale AI-driven development safely.
1. Standardize delivery foundations
When every team builds pipelines differently, scaling delivery becomes difficult.
Standardized templates (or “golden paths”) make it easier to deploy services safely and consistently. They also dramatically reduce the cognitive load for developers.
2. Automate quality and security checks earlier
Speed only works when feedback is fast.
Automating security, compliance, and quality checks earlier in the lifecycle ensures problems are caught before they reach production. That keeps pipelines moving without sacrificing safety.
3. Build guardrails into the release process
Feature flags, automated rollbacks, and progressive rollouts allow teams to decouple deployment from release. That flexibility reduces the blast radius of new changes and makes experimentation safer.
It also allows teams to move faster without increasing production risk.
4. Remember measurement, not just automation
Automation alone doesn’t solve the problem. What matters is creating a feedback loop: deploy → observe → measure → iterate.
When teams can measure the real-world impact of changes, they can learn faster and improve continuously.
The Next Phase of AI in Software Delivery
AI is already changing how software gets written. The next challenge is changing how software gets delivered.
Coding assistants have increased development teams' capacity to innovate. But to capture the full benefit, the delivery systems behind them must evolve as well.
The organizations that succeed in this new environment will be the ones that treat software delivery as a coherent system, not just a collection of tools.
Because the real goal isn’t just writing code faster. It’s learning faster, delivering safer, and turning engineering velocity into better outcomes for the business.
And that requires modernizing the entire pipeline, not just the part where code is written.

Road to KubeCon 2025: Smarter AI Delivery
KubeCon 2025 Atlanta is here! For the next four days, Atlanta is the undisputed center of the cloud native universe. The buzz is palpable, but this year, one question seems to be hanging over every keynote, session, and hallway track: AI.
We've all seen the impressive demos. But as developers and engineers, we have to ask the hard questions. Can AI actually help us ship code better? Can it make our complex CI/CD pipelines safer, faster, and more intelligent? Or is it just another layer of hype we have to manage?
At Harness, we believe AI is the key to solving software delivery's biggest challenges. And we're not just talking about it—we're here to show you the code with Harness AI, purpose-built to bring intelligence and automation to every step of the delivery process.
⚡ AI in Action: The Can't-Miss Talk at the Google Booth
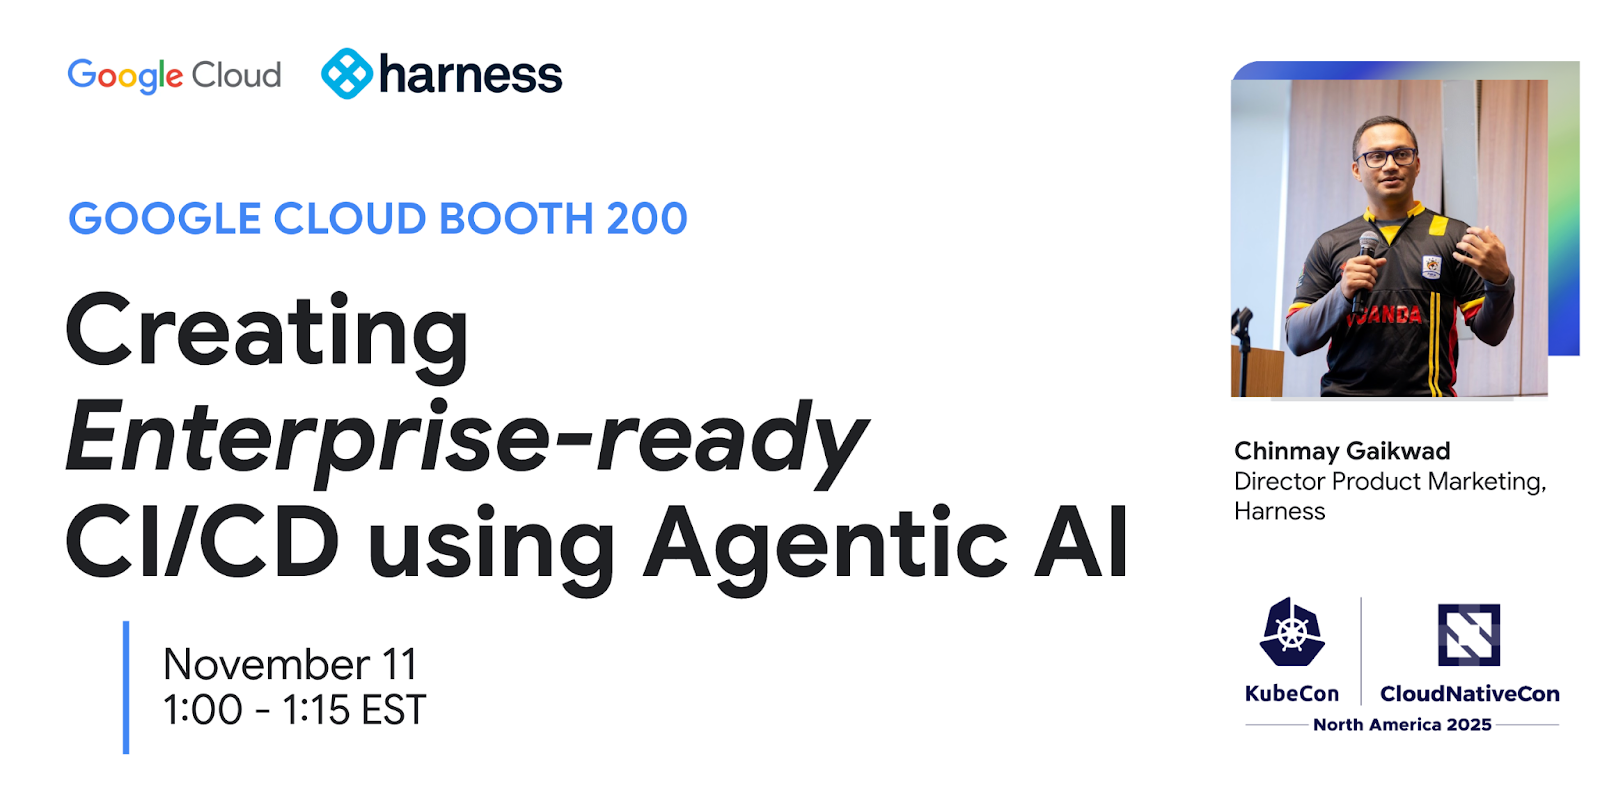
We are thrilled to team up with Google Cloud to present a special lightning talk on Agentic AI and its practical use in CI/CD. This is where the hype stops and the engineering begins.
Join our Director of Product Marketing, Chinmay Gaikwad, for this deep-dive session.
- Talk: Creating Enterprise-ready CI/CD using Agentic AI
- Where: Google Cloud Booth 200
- When: Tuesday, November 11th, at 1:00 PM ET (1:00 – 1:15 PM)
Chinmay will be on hand to demonstrate how Agentic AI is moving from a concept to a practical, powerful tool for building and securing enterprise-grade pipelines. Be sure to stop by, ask questions, and get personalized guidance.
Your Map for KubeCon Week
AI is our big theme, but we're everywhere this week, focusing on the core problems you face. Here's where to find us.
1. Main Event: The Harness Home Base (Nov 11-13)
- 📍 : Booth #522 (Solutions Showcase)
This is our command center. Come by Booth #522 to see live demos of our Agentic AI in action. You can also talk to our engineers about the full Harness platform, including how we integrate with OpenTofu, empower platform engineering teams, and help you get a handle on cloud costs. Plus, we have the best swag at the show.
2. Co-located Event: Platform Engineering Day (Nov 10)
- 📍 : Booth #Z45
As a Platinum Sponsor, we're kicking off the week with a deep focus on building Internal Developer Platforms (IDPs). Stop by Booth #Z45 to chat about building "golden paths" that developers will actually love and how to prove the value of your platform.
3. Co-located Event: OpenTofu Day (Nov 10)
- 📍 : Level 2, Room B203
We are incredibly proud to be a Gold Sponsor of OpenTofu Day. As one of the top contributors to the OpenTofu project, our engineers are in the trenches helping shape the future of open-source Infrastructure as Code.
The momentum is undeniable:
- 26K+ GitHub stars
- 10M+ total downloads
- 180+ engineering contributors
Our engineers have contributed major features like the AzureRM backend rewrite and the new Azure Key Provider, and we serve on the Technical Steering Committee. Come find us in Room B203 to meet the team and talk all things IaC.
Can't wait? Download the digital copy of The Practical Guide to Modernizing Infrastructure Delivery and AI-Native Software Delivery right now.
KubeCon 2025 Atlanta is about what's next. This year, "what's next" is practical AI, smarter platforms, and open collaboration. We're at the center of all three.
See you on the floor!
Latest Blogs

Azure Deployment Strategies & CI/CD Best Practices
- Modern Azure deployment goes beyond basic pipelines. Teams that combine CI/CD automation with progressive delivery and feature flags ship faster and with far fewer incidents.
- Choosing the right deployment strategy for each workload type dramatically reduces blast radius and makes rollbacks a matter of seconds, not hours.
- Embedding feature management and experimentation directly into Azure deployments lets teams decouple deployment from release before full rollout.
Learn how to master Azure deployment with CI/CD pipelines, progressive delivery, and feature flags. See how Harness helps engineering teams ship faster and safer on Azure.
Azure deployment sounds straightforward. Push code, it runs in the cloud. But if you've managed a 2 a.m. production incident because a deployment went sideways on AKS, you know the gap between "it deploys" and "it deploys safely at scale" is significant.
This guide covers the deployment strategies, pipeline structures, and operational patterns that close that gap -- from how to sequence a canary rollout to how Harness Continuous Delivery makes the whole operation measurably safer.
What Is Azure Deployment?
Azure deployment is the process of releasing application code, configuration, or infrastructure changes to Microsoft Azure. That can target VMs, AKS clusters, Azure App Service, Azure Functions, Azure Container Instances -- whatever your workload runs on.
At the artifact level, a deployment pushes a container image, a build package, or a Terraform plan into an Azure environment. What distinguishes a mature deployment workflow from a basic one is the control layer around that push:
- CI gates every commit. No artifact reaches Azure without passing build, test, and static analysis stages.
- CD automates the path from staging to production. Humans approve; pipelines execute.
- Deployment strategy determines blast radius. Canary, blue-green, and rolling deployments each make a different tradeoff between speed, safety, and cost.
- IaC keeps environments consistent. If a resource change isn't in code, it doesn't happen.
- Observability triggers rollback. Post-deployment verification watches metrics automatically. If error rates cross the threshold, the pipeline acts -- no engineer needs to catch it first.
Azure Deployment Strategies: Pick the Right Tradeoff
The strategy you choose determines how much of your user base absorbs a bad release before you can respond. The tradeoffs are clear.
Blue-Green Deployment
Blue-green keeps two identical environments live: blue handles production traffic; green runs the new version. When green passes validation, traffic cuts over instantly.
What this means in practice on Azure:
- You're running double the infrastructure during every deployment window -- parallel App Service slots, duplicate AKS node pools, or mirrored Container Apps environments.
- Rollback is instant: flip traffic back to blue.
- Validation happens before any user sees the new version.
Use blue-green when: rollback speed matters more than infrastructure cost, and you need zero-downtime cutover with the option to abort completely.
Skip blue-green when: your workload has stateful dependencies or database schema changes that make running parallel environments operationally complex.
Canary Deployment
Canary deployments send a defined percentage of traffic to the new version while the rest stays on stable. Start small, watch metrics, and expand only when data supports it.
A standard canary ramp on a high-traffic Azure workload:
- 1% of traffic to canary. Watch p95 latency and error rate for 15-30 minutes.
- 5% if metrics hold. Watch for another 30 minutes.
- 25% if metrics hold.
- 100% once you're confident.
At each stage, define a specific rollback trigger before the deployment starts -- not while you're watching dashboards. For example: if error rate rises more than 0.2% above baseline, or p95 latency increases more than 50ms, auto-roll back and alert.
The blast radius of a bad release tops out at whatever percentage is currently on canary. Catch a problem at 1%, and one in a hundred users hits it -- not all of them.
Rolling Deployment
Rolling deployments replace instances of the old version in batches. No double infrastructure -- each batch of pods gets updated and validated before the next batch rolls.
This is resource-efficient, but old and new versions run simultaneously during the rollout. That creates two constraints:
- API calls from old instances can reach new instances. If your API contract changed, backward compatibility is required.
- Database schema changes need to be backward-compatible before the rollout starts. Migrate first, then deploy.
Use rolling when: your workload is stateless, API changes are backward-compatible, and infrastructure cost is a constraint.
Building a CI/CD Pipeline for Azure
A reliable Azure deployment pipeline runs the same automated process on every commit. Here's how the stages flow using Harness-powered pipelines.
Stage 1: Source Trigger
A commit or PR kicks off the pipeline. Every change -- bug fixes, config updates, dependency bumps -- goes through the same stages. No exceptions for "small" changes; that's where incidents come from.
Stage 2: Build and Unit Test
Code compiles. Container images build. Unit tests run. If anything fails here, the pipeline stops. Don't let a broken build consume downstream compute.
Tag images with the pipeline sequence ID or commit SHA -- never "latest" in production. You need to be able to redeploy any version from six months ago without guessing which image it was:
yaml
- step:
    type: BuildAndPushDockerRegistry
    name: Build and Push
    spec:
      connectorRef: azure_container_registry
      repo: myapp
      tags:
        - <+pipeline.sequenceId>
        - <+trigger.commitSha>
Stage 3: Static Analysis and Security Scanning
Run SAST on every PR. DAST is often run asynchronously (e.g., nightly or pre-release) due to runtime and environment requirements -- it's slower and will add minutes to every commit if you run it inline. Container scanning happens before the image lands in Azure Container Registry. Block the push if critical vulnerabilities are found; don't flag and continue.
Stage 4: Artifact Publishing
Validated images push to Azure Container Registry. Deployment packages go to your artifact store. Nothing reaches Azure environments without passing stages 2 and 3.
Stage 5: Infrastructure Provisioning
IaC definitions -- Bicep, ARM, or Terraform -- apply any environment changes before application artifacts deploy. Infrastructure and application deployments should be independent pipelines where possible. Coupling them couples their blast radii.
Stage 6: Staging Deployment and Integration Tests
Deploy to staging first. Run smoke tests and integration tests against real infrastructure. Review testing methodologies for CD pipelines to validate the release before production. This is where environment-specific bugs surface: network policies, service mesh configs, secrets management -- things unit tests don't catch.
Stage 7: Production Deployment with Progressive Delivery
Deploy to production using your chosen strategy. For canary: configure traffic weights in Azure Front Door, Application Gateway, or your AKS ingress controller. Automate the traffic ramp -- don't rely on manual weight adjustments at each stage.
Stage 8: Post-Deployment Verification
Harness AI-assisted deployment verification watches error rates, p95 latency, pod restart counts, and relevant business metrics (conversion rate, checkout completion) for at least 30 minutes post-deployment. If a threshold is breached, the pipeline rolls back without waiting for a human to notice.
Example rollback trigger thresholds:
- Error rate increases more than 0.2% over baseline → auto rollback
- p95 latency increases more than 50ms over baseline → auto rollback
- Pod restart count increases more than 3x → halt rollout, alert on-call
Infrastructure as Code for Azure: Keep Environments Consistent
Manual Azure resource changes create configuration drift. When production diverges from what your IaC defines, incidents become harder to diagnose because you can't be certain what state the environment is actually in.
The rule: if a change isn't in code, it doesn't happen in production. That applies to VM sizes, network security groups, Key Vault access policies, AKS node pool configs -- everything.
What IaC actually gives you:
- Version control for infrastructure. Every change is in a PR, reviewable, and revertible.
- Reproducible environments. Spin up a staging environment that mirrors production exactly, run your tests, tear it down.
- Drift detection. Automated checks compare the live Azure environment against your IaC definitions. If they diverge, you get an alert or auto-remediation.
- Audit trails. Compliance teams can see what changed, when, and who approved it -- without digging through Azure activity logs.
Harness Infrastructure as Code Management adds drift detection, cost visibility, and policy enforcement directly in the pipeline. A Terraform plan that would provision resources over budget threshold fails the policy check before apply runs.
Progressive Delivery in Azure
Traditional deployments push everything to everyone at once. If something is broken, every user hits it simultaneously. Progressive delivery replaces that with a controlled ramp.
The technical mechanics depend on your Azure service:
- AKS: Weighted ingress routing using NGINX ingress or Azure Application Gateway Ingress Controller.
- Azure App Service: Deployment slots with traffic splitting configured via Azure CLI or portal.
- Multi-region: Weighted routing rules in Azure Front Door.
The operational pattern is the same regardless: start at 1-5% of traffic, define automated rollback triggers before the deployment starts, measure for at least 15-30 minutes per stage, and expand only when metrics confirm the release is healthy.
What makes this work at scale is automated deployment verification. Instead of an engineer watching dashboards at every ramp stage, the system watches metrics and halts or rolls back if guardrails are breached.
Feature Flags in Azure Deployments: Separate Deployment from Release
Deploying code and releasing features to users are two different pipeline stages. Feature flags are how you keep them separate.
When you ship behind flags, code deploys to Azure in an off state. The flag controls which users see it, when, and at what percentage. No high-stakes launch moment -- you ramp exposure the same way you'd ramp a canary.
This matters most in complex Azure architectures where services deploy independently. A new API version can deploy across your AKS cluster while the flag gates user-facing exposure until every downstream service is ready. No coordinated rollout timing. No deployment freeze while other services catch up.
How Flags Integrate with the Azure CI/CD Pipeline
The flag lives in application code. The pipeline deploys the code; Harness Feature Management controls flag state. Those are independent systems.
javascript
// Feature flag check in application code
const isNewCheckoutEnabled = await featureFlags.isEnabled('new-checkout', {
  userId: user.id,
  region: user.region
});

if (isNewCheckoutEnabled) {
  return newCheckoutFlow(cart);
} else {
  return legacyCheckoutFlow(cart);
}
Patterns That Work Well for Azure Deployments
Ship dark, release progressively. Deploy to all Azure regions behind a flag. Enable for internal users first. Validate against real infrastructure without external exposure. Then ramp: 1%, 5%, 25%, 100% -- each step gated by metrics.
Region-by-region rollouts. Target Azure regions sequentially using flag targeting rules. East US first; if error rates hold for 24 hours, enable in West Europe. No new deployment required to expand.
A/B test infrastructure changes. Testing a new AKS node type or a different caching layer? Harness Experimentation lets you route a percentage of workloads to the new configuration and compare against guardrail metrics with statistical validity -- not gut feel.
Release monitoring at the feature level. System-level monitoring tells you error rate is up 0.3%. Harness Release Monitoring tells you the new checkout variant is adding 40ms of p95 latency. The second tells you what to fix.
Warehouse-Native Experimentation
For teams running Azure Synapse Analytics or Azure Databricks, warehouse-native experimentation computes experiment results directly in your data warehouse -- no ETL pipelines, no data export, no additional latency in your analysis.
GitOps for Azure: Git as the Source of Truth
GitOps applies the same version-control workflow you use for application code to your Azure infrastructure and deployment configuration. Desired state lives in the repo. The live Azure environment is continuously reconciled against it.
For AKS workloads, the GitOps loop runs like this:
- Engineer opens a PR with a Kubernetes manifest change.
- PR is reviewed, approved, and merged to main.
- GitOps controller detects the diff between desired state (repo) and live state (cluster).
- Controller applies the change to the AKS cluster automatically.
- If the live state drifts from the repo at any point -- manual kubectl change, failed sync -- the controller flags it or auto-remediates.
Every infrastructure change goes through code review. Every rollback is a revert commit. Audit trail is automatic.
Harness GitOps provides enterprise-grade GitOps with the audit trails, RBAC, and governance controls that Azure production environments demand -- without the operational overhead of managing Argo CD clusters yourself. The same discipline applies beyond Kubernetes: GitOps principles on ARM definitions, Bicep modules, or Terraform workspaces mean every Azure environment change follows the same review-approve-apply workflow as application code.
Governance and Policy in Azure Deployments
At enterprise scale, governance needs to be pipeline-native -- not a checklist that runs after deployment. Policy as Code applies compliance rules directly inside your Azure deployment pipelines, replacing manual approval checklists with automated checks that run before anything reaches production.
Harness DevOps Pipeline Governance enforces this at every stage:
- Required security gates. SAST, SCA, and container scanning run automatically on every PR and build. Critical findings block promotion to production. Policy enforcement is in the pipeline -- no human bottleneck.
- Immutable audit logs. Every deployment, approval, flag change, and rollback is timestamped and attributed. Required for SOX, HIPAA, or ISO 27001 compliance in Azure environments.
- Environment-specific approvals. Staging promotes automatically; production requires sign-off. The approval workflow lives in the pipeline definition, not in someone's email inbox.
- Cost guardrails. Policy checks block Terraform plans that would provision Azure resources over budget thresholds. Catch infrastructure cost overruns before apply runs, not after the invoice arrives.
Azure Deployment Best Practices
These are the patterns that separate teams shipping confidently on Azure from teams that dread release day.
- Never deploy directly to production. Even for "tiny" changes. Every change goes through at least one pre-production environment with automated testing.
- Make every deployment artifact immutable. Tag container images with commit SHAs. You should be able to redeploy any version from six months ago in under five minutes, without digging through Slack to figure out which image tag it was.
- Decouple infrastructure and application deployments. Changing Azure resources and changing application code should be separate pipelines. Coupling them couples their blast radii.
- Define rollback before you deploy. Every deployment needs a rollback plan -- and ideally, an automated one. If rollback requires more than a button click, simplify the pipeline.
- Monitor at the feature level, not just the system level. "Error rate is up 0.3%" tells you something is wrong. "The new checkout variant is causing a 12% increase in cart abandonment," tells you what to fix.
- Treat configuration as code. Azure App Configuration values, Key Vault references, and environment variables belong in version control and deploy through the same pipeline as application code.
- Ship continuously, not on a schedule. The longer the gap between deployments, the more changes are bundled, the harder it is to isolate what broke. Continuous delivery with small, frequent deploys reduces the cost of every individual change.
How Harness Powers Azure Deployment at Scale
Teams shipping to Azure need CI, CD, feature management, infrastructure automation, and observability connected into a single workflow -- with the governance controls that enterprise Azure environments require.
Harness gives Azure teams:
- Continuous Integration with intelligent test selection, incremental builds and pipeline caching, and pipeline analytics that eliminate build bottlenecks.
- Continuous Delivery with canary, blue-green, and rolling strategies built in -- including AI-assisted deployment verification that watches metrics and rolls back without human intervention.
- Infrastructure as Code Management for Terraform and Bicep workflows with drift detection, cost visibility, and policy enforcement.
- Feature Management & Experimentation to decouple deployment from release, run A/B tests against real Azure traffic, and monitor at the feature level.
- CD data visualization to track deployment frequency, lead time, and change failure rate across your Azure environments.
The result: Azure deployments that are faster, safer, and measurably better -- with the data to prove it.
Azure Deployment: Frequently Asked Questions
What is the difference between Azure deployment and Azure DevOps?
Azure deployment is the process of releasing application code or infrastructure changes to Azure cloud resources. Azure DevOps is Microsoft's platform for managing source control, CI/CD pipelines, work items, and artifact management. You can use Azure DevOps to orchestrate deployments, but it's one of several tools that can do so. Harness provides Azure deployment capabilities with enterprise-grade progressive delivery, feature management, and governance that extend beyond native Azure Pipelines.
What Azure deployment strategy should I use for a high-traffic application?
For high-traffic Azure applications, canary deployments offer the best balance of safety and speed. Start at 1% of traffic, watch error rates and p95 latency closely, and ramp to 5%, 25%, and 100% as metrics confirm health. Define automated rollback triggers at each stage before the deployment starts.
Blue-green deployments work well when you need instant rollback capability and can absorb double the infrastructure cost during deployment windows. Rolling deployments suit stateless workloads where brief mixed-version operation is acceptable, as long as API and schema changes are backward-compatible.
How do feature flags fit into an Azure CI/CD pipeline?
Feature flags integrate at the application code level, not the pipeline level. Code deploys to Azure with new features disabled behind flag checks. The deployment pipeline handles getting code to Azure; the feature flag controls which users see the new functionality and when. This lets your pipeline run continuously -- shipping every commit -- while you control feature exposure independently through feature management.
How do I prevent configuration drift in Azure?
Define all Azure resources in Infrastructure as Code -- Bicep, ARM templates, or Terraform -- and enforce a policy that no manual changes are made to production environments directly. Automated drift detection continuously compares the live Azure environment against the desired state in your IaC definitions and alerts (or auto-remediates) when they diverge.
What metrics should I watch during an Azure deployment?
At minimum: HTTP error rates (watch for increases above 0.2% over baseline), p95 and p99 latency (degradation shows here before average latency moves), pod restart counts for AKS workloads, and relevant business metrics like conversion rate or checkout completion.
Monitor at the feature or deployment level, not just at the infrastructure level. "Error rate is up" tells you something is wrong. "Feature X caused a 15% increase in checkout errors" tells you what to fix.
Can I run A/B tests on Azure infrastructure changes, not just product features?
Yes. Experimentation works for engineering validation as well as product changes. Route a percentage of AKS workloads to a new node type, compare caching strategies, or test a new database configuration -- all with the same statistical guardrails you'd apply to a UI experiment. For teams with Azure Synapse Analytics, warehouse-native experimentation computes results directly in your data warehouse without additional ETL overhead.

Announcing OPA Policy Evaluation on Your Own Infrastructure
Let's face it: "move fast and break things" is a great way to end up sitting in a war room at 3:00 AM. Engineer burnout is at record highs, we don’t need sloppiness to hurt us further.
Look. Here’s the reality: thanks to AI code generation tools, we are writing more code than ever before. Delivering that with pipelines built for human-speed development? That’s become the chokepoint. Everything in delivery needs to get faster and better. That includes governance.
We’ve long used Open Policy Agent (OPA) to embed automated governance directly into delivery pipelines to stop teams from cutting corners. OPA is Policy as Code and by default evaluates on our secure cloud infrastructure. But for large, highly regulated enterprises, corporate firewalls and strict data residency rules present a classic dilemma:
What happens when a policy needs to access data that resides within a corporate firewall? How do we run these policies so that they connect to internal systems securely and access that data within the corporate trust boundary?
We’re tackling that challenge now. New to Harness is the ability to evaluate OPA Policies on Local Infrastructure.
The Architectural Hurdle: Firewalls & Local Secrets
Platform and security engineering teams love OPA because it allows them to gate pipelines based on real-time business logic. For example, you may want to implement a waiver or exceptions workflow that grants a one-time exception to a specific Policy from being broken. And you may want to track that a waiver was issued in a ticketing system like ServiceNow.
However, executing this evaluation in a standard SaaS model breaks down when:
- The Target System you are querying is Inbound-Protected: Your internal ticketing system, database schema verifier, or proprietary security scanner lives deep behind your corporate firewall.
- Secrets Must Stay Local: To query that internal system, OPA needs an API token, certificate, or password. Sending that credential to an external cloud environment—even one as secure as Harness—is often an immediate veto from Chief Information Security Officers (CISOs).
Historically, teams had to choose between drilling holes in their firewall, duplicating infrastructure, or reverting to manual spreadsheets and agonizing verification meetings.
Enter Local OPA Evaluation on Kubernetes
With this new capability, Harness lets you direct the OPA evaluation engine to run in your own environment (specifically on your local Kubernetes clusters).
How It Works
Instead of pulling your secure internal metrics out to the cloud for policy validation, Harness sends the evaluation intent down to your local cluster. The evaluation triggers locally, pulls secrets natively from your secure environment, queries your private behind-the-firewall tools, and passes a simple, immutable Pass/Fail status back to the Harness pipeline
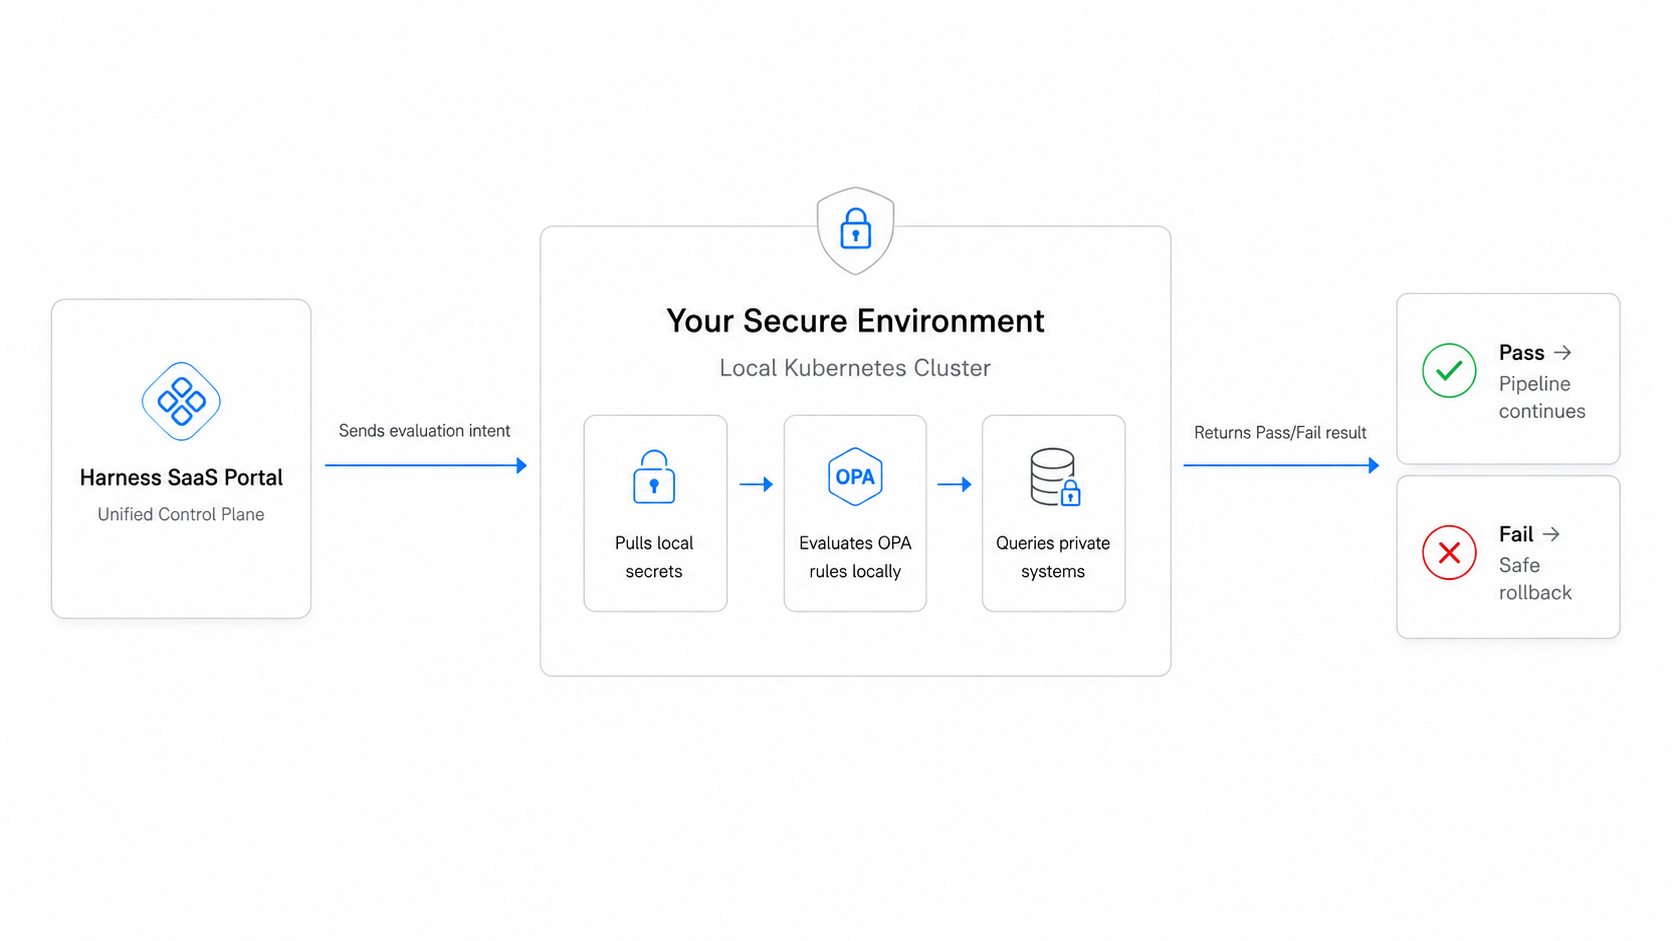
This approach delivers the best of both worlds: the ease and scalability of a unified platform control plane, backed by the absolute security of local execution
See It: Gating Pipelines on Secure Ticket States
Consider a classic enterprise scenario: gating a production deployment based on an internal ticketing system.
If the ticket is approved, the sync proceeds automatically. If the ticket is canceled, pending, or in an unexpected state, the pipeline halts or triggers an automated rollback strategy before any risk is introduced to production. Because the execution stays within your perimeter, your ticketing credentials remain entirely untouched by external systems.
Check out this quick demo video to see exactly how to configure your Kubernetes cluster to handle OPA evaluations locally:
Use Cases
Use Case 1- Allowing for OPA waivers/exceptions
A common pattern we saw amongst our customers was they wanted an “exceptions” or “waiver” workflow where customers, for certain use cases, could waive a failed OPA policy for a particular scenario. Let’s take the following example:
- You have a pipeline that has an OPA policy mandating that there’s >95% test coverage before a deployment is done
- A hotfix comes in at the last minute that fails the 95% test coverage
- Given the urgency of the situation, you want to bypass the OPA policy
In these kinds of situations, teams often want some kind of mechanism to allow a waiver where they allow the pipeline to run this one specific time due to special circumstances. Additionally, customers want to keep track that a waiver was issued in a third-party ticketing system (like JIRA or ServiceNow). With the Local OPA evaluations capability, you can now write policies that query the internal ticketing system as shown above.
Use Case 2 - Using OPA to check for Pipeline Tampering
Another common authorization workflow we saw was customers trying to ensure that their pipeline YAMLs hadn’t been tampered with. For example, customers often want to ensure that the pipeline they have authored and stored in Harness SaaS is exactly the one that runs at the time of deployment. They want to ensure that no third party tampers with the pipeline YAML before it is actually being run. The approach we saw customers take was the following:
- They would author a pipeline in Harness SaaS
- They would take the pipeline YAML and take a hash of the pipeline
- They would store the hash of the pipeline within their internal database/system
- At the time of the pipeline actually running, they compare the hash of the “correct pipeline” with the hash of the pipeline being run to check for equivalence
The steps outlined above allow for ensuring that nobody has tampered with the pipeline’s yaml before it is run. However, to write a rego policy that can actually do a hash code equivalence check (step 4) you need to make a call to the internal database system where the hash code of the correct pipeline lives. This again necessitated having the rego policy read credentials and connect to a 3rd party system. Again, one way to solve this problem was to allow customers to run these OPA policies on their own K8s clusters.
Use Case 3 - Very Large or Sensitive Payloads
Finally, some customers use our custom policy step action to perform an authorization check midway through a pipeline. For several of these situations, customers want to send data for the OPA policy to check that is sensitive in nature. For such use cases, they don’t want the sensitive payload to be sent to the OPA service running in Harness SaaS. Instead they want the payload to be sent to the OPA rego policy running in their own infrastructure.
Zero Friction, Maximum Compliance
So, what does this mean for your daily operations?
The beauty of local OPA evaluation is that your developers won't notice a single change in their daily workflow. They continue to leverage the fastest builds and automated continuous delivery pipelines they love.
Meanwhile, Platform Leaders gain a comprehensive, immutable audit trail of every single evaluation, ensuring painless compliance reviews without hampering developer velocity.
Ready to eliminate toolchain chaos and secure your deployment guardrails? Get started with Harness Continuous Delivery & GitOps today.

Mainframe DevOps: Modern CI/CD for Big Iron
For Platform Engineering teams, the goal has always been clear: build a secure, scalable internal developer platform that reduces cognitive load and accelerates time-to-market. Yet, a massive obstacle often remains hidden in plain sight: the mainframe.
While your distributed teams are shipping cloud-native microservices multiple times a day, your core backend mainframe applications frequently remain locked in an isolated silo, lagging behind on slow monthly or quarterly cadences.
The reality of modern enterprise software is deeply interconnected. A single customer-facing feature might require an update to a mobile front-end running in the cloud, an API layer, and a core COBOL application running on a mainframe. When these components are fractured across disconnected deployment tools, it creates an operational nightmare for platform teams.
It is time to eliminate the legacy boundaries. Here is how you can bring mainframe applications out of isolation and orchestrate them alongside your distributed, cloud-native stack using a single, unified developer platform.
One strategic CI/CD platform
Maintaining separate toolchains (modern CI/CD platforms for the cloud and legacy, script-heavy workflows for the mainframe) forces platform teams to absorb massive technical debt.
- Eliminate Toolchain Chaos: Operating disparate point solutions for different hosting tiers compounds your team's maintenance overhead and integration toil.
- Consolidate Visibility and Insights: Fragmented tools create a complete blind spot. Without a single pane of glass, it is nearly impossible for platform leads to pull accurate, process-agnostic DORA metrics across the entire enterprise portfolio.
- Mitigate Release Coordination Risk: When complex applications have mainframe backends and distributed front-ends, cross-tier releases quickly turn into a chaotic mess of manual spreadsheets, endless sync meetings, and high change failure rates.
By pulling mainframe applications into the same automated platform that governs your cloud environments, you deliver a consistent developer experience, enforce centralized standards, and significantly reduce total cost of ownership (TCO).
With advances in mainframe build-and-deploy tooling, orchestration is easier than ever.
See Mainframe CI/CD in Action
Want to see how easy it is to replace manual compilation and deployment routines with an elegant, visual pipeline template? Watch this brief demonstration highlighting the end-to-end integration between modern orchestration, IBM DBB, and Wazi Deploy:
Modern Mainframe Pipelines: Declarative, Automated, and Secure
Bringing modern CI/CD to the mainframe doesn't require a risky architectural rewrite; it requires wrapping your "Big Iron" infrastructure in a modern, pipeline-driven automation layer. Harness seamlessly integrates with your existing IBM ecosystem and your broader DevSecOps toolchain to make mainframe delivery as repeatable and secure as any cloud deployment.
1. Automated, Smart Builds with IBM DBB
Instead of relying on tribal knowledge or manual build scripts, your platform can natively trigger utilities like IBM Dependency Based Build (DBB). Your centralized continuous integration pipeline orchestrates the workflow, while DBB analyzes code changes and manages dependencies to compile only what is necessary directly on z/OS.
2. Shift-Left Security Gates
Incorporate policy-as-code and automated security scanning tools directly into the mainframe lifecycle. By embedding static analysis or open-source vulnerability scans straight into the pipeline, you can flag risks early and prevent security issues from escaping into production without adding developer friction.
3. Standardized Deployments with Wazi Deploy
When binaries are ready to move through your testing and production environments, the platform handles the deployment mechanics by executing IBM Wazi Deploy. This replaces highly customized, brittle deployment scripts with a structured, declarative configuration that updates application components natively on z/OS.
Taming Complex, Multi-Service Releases
The biggest win for a Platform Engineering Lead is solving the "pipeline of pipelines" dilemma. When a synchronized product release requires coordinating dependencies across separate teams, technologies, and cadences, you need a powerful orchestration engine.
Harness moves beyond isolated, single-service pipelines to provide Enterprise Release Orchestration. This gives your platform team a visual, unified calendar and workflow engine to cleanly sequence dependencies across both distributed and mainframe pipelines.
Every action is governed by granular, environment-aware role-based access control (RBAC), built-in approval workflows (such as Jira or ServiceNow integrations), and a comprehensive, immutable audit trail. If a deployment fails at any tier, the platform provides immediate visibility into the root cause, protecting system uptime and shielding your organization from compliance risks.
Harness Named a Leader in the 2026 Gartner® Magic Quadrant™ for DevSecOps Platforms for the Third Consecutive Year
Harness has been recognized as a Leader in the 2026 Gartner® Magic Quadrant™ for DevSecOps Platforms for the third consecutive year. Harness was also positioned furthest on the Completeness of Vision axis in the report.
Our Key takeaways:
- Harness is named a Leader for the third consecutive year
- Harness is positioned furthest on the Completeness of Vision axis
- Harness continues investing in governed, AI-powered DevSecOps
Harness is the AI platform for engineering, security, and operations teams to build, secure, deploy, govern, and optimize software delivery across the SDLC.
We believe our recognition in the Gartner Magic Quadrant for DevSecOps Platforms reflects the continued evolution of the Harness platform and our commitment to helping teams deliver software faster, safer, and with greater governance across the software delivery lifecycle.
We’re thrilled to share this recognition, which we believe reflects the strength of our product strategy, the breadth of our platform, and our continued investment in helping enterprises modernize software delivery with security, reliability, cost management, and AI built into the development lifecycle.
Today, organizations across industries like United Airlines, Ancestry, and Citi rely on Harness to reduce delivery complexity, improve developer productivity, strengthen governance, and accelerate innovation across increasingly complex software environments.
Why This Matters Now
Software delivery has entered a new era. AI coding assistants are helping teams create software faster than ever, but faster code generation also means more changes, more tests, more vulnerabilities, more deployments, and more incidents for organizations to manage. The next era of DevSecOps will not be defined by who can generate code faster. It will be defined by who can safely convert that speed into reliable business outcomes.
Our view is that the future of DevSecOps is autonomous AI agents, governed and directed by expert engineers. As humans and AI agents both contribute to software change, enterprises will need one connected platform to understand, validate, secure, deploy, observe, optimize, roll back, and prove every change across the software delivery lifecycle.
Our Journey
As a pioneer in modern software delivery, Harness offers over 15 platform products and has built one of the industry’s most comprehensive platforms to support the full spectrum of application development, deployment, security, reliability, feature management, cost management, and operations.
Harness has evolved through a combination of product innovation, internal entrepreneurship, open source investment, and strategic acquisitions. We believe our recognition as furthest on the Completeness of Vision axis in the 2026 Gartner® Magic Quadrant™ for DevSecOps Platforms is proof that Harness is solving problems for our customers in a measurable way.
Over the past year, Harness has continued to expand platform capabilities and AI agents across:
- Security and risk management
- AI-native testing capabilities including flaky test detection and AI impact testing
- Feature Management and Experimentation
- Cloud and AI Cost Management
- AI DLC insights
- Resilience Testing, and more
This matters because software delivery is no longer just about building and deploying code. Teams must now manage security risk, release complexity, infrastructure cost, compliance requirements, production reliability, and the growing impact of AI-generated software. The Harness platform allows teams to adopt what they need, when they need it, in one place.
With operations across North America, Europe, APAC, Latin America, and India, Harness serves organizations of all sizes across industries. Customers choose Harness not only for the breadth of the platform but also for the flexibility to adopt individual modules or the full platform based on their needs, maturity, and business priorities.
What’s Next for Harness
This recognition in our opinion is a milestone, and we’re proud, but we’re even more excited by the road ahead.
We build security in the software delivery lifecycle natively, not as a separate stage or disconnected toolchain. As AI increases the volume of code, changes, and security findings, enterprises will need platforms that connect detection, prioritization, policy, remediation, deployment, and runtime defense into a single, governed workflow.
Harness is focused on helping enterprises meet that moment. We will continue investing in AI software delivery to help teams move faster without losing control. Our goal is to help every organization deliver software that is faster to build, safer to release, easier to govern, and more resilient in production.
Thank you to our customers, partners, employees, and community for your continued trust. We’re excited about the journey ahead and can’t wait to show you what’s next.
Learn More
Get a complimentary copy of the 2026 Gartner® Magic Quadrant™ for DevSecOps Platforms.
Or, to talk to someone about Harness, please contact us.
Gartner Disclaimer
Gartner, Magic Quadrant for DevSecOps Platforms, 2026, Keith Mann, Thomas Murphy, Bill Holz, 15 June 2026
Gartner does not endorse any vendor, product, or service depicted in its research publications and does not advise technology users to select only those vendors with the highest ratings or other designation. Gartner research publications consist of the opinions of Gartner’s research organization and should not be construed as statements of fact. Gartner disclaims all warranties, expressed or implied, with respect to this research, including any warranties of merchantability or fitness for a particular purpose.
GARTNER is a registered trademark and service mark of Gartner, and Magic Quadrant is a registered trademark of Gartner, Inc. and/or its affiliates in the U.S. and internationally, and is used herein with permission. All rights reserved.

Core Java vs Enterprise Java: Jakarta EE, Spring Boot & Modern Trade-offs [2026 Guide]
- The "Java EE vs Java SE" framing is dated. In 2026, every modern enterprise Java app runs on Java SE 21 or 25 LTS. The real decision is which framework or runtime sits on top — Spring Boot, Quarkus, Helidon, Micronaut, or vanilla Jakarta EE on Open Liberty, Payara, or WildFly.
- The javax.* → jakarta.* namespace migration is the upgrade gate most teams are still working through. Jakarta EE 9 (2020) renamed every package. Spring Boot 3 and 4 require the new namespace. Any framework or library jump in 2026 has to reckon with it.
- The "heavyweight app server" critique no longer applies to the runtimes anyone is choosing. Quarkus, Helidon, and Open Liberty's lightweight profiles compile to native images, start in tens of milliseconds, and run in under 100 MB — competitive with Go and Node on cold-start and footprint.
- Standardizing delivery velocity matters more than framework preference. Mixed Java fleets (Spring Boot + Quarkus + legacy Jakarta EE) are the norm. AI-powered CD, GitOps, and policy-as-code give platform teams a single operational model across all of them, without forcing framework consolidation.
When you're architecting an enterprise Java application, one decision quietly shapes everything downstream: runtime footprint, deployment pipelines, and how your platform team handles incidents at 3 a.m. For two decades, that decision was framed as Java SE vs Java EE. In 2026, that framing has quietly inverted.
Nearly every modern enterprise Java app runs on Java SE 21 or 25 LTS. The real choice now sits one layer up: which framework or runtime sits on top of the JVM. Spring Boot. Quarkus. Helidon. Micronaut. Vanilla Jakarta EE on Open Liberty, Payara, or WildFly. These options have converged on the same underlying APIs. Spring Boot 3 and 4 sit on jakarta.* packages, the same namespace Jakarta EE itself uses. But they differ sharply in startup time, memory footprint, deployment topology, and what your CI/CD pipeline has to do to ship them safely.
This guide is for the platform engineer, architect, or staff engineer who needs to make that call once and live with it across dozens of services. We'll cover what changed, where the stacks still diverge, and how to standardize delivery across a mixed Java fleet without forcing consolidation no team wants.
What is Java SE?
Java SE (Standard Edition) is the foundation of every Java application, from a five-line script to a globally distributed system. It's the language, the runtime, and the core libraries every Java program assumes is there.
But describing Java SE as just "the foundation" undersells what's happened to it in the last three years. Java SE in 2026 is not the Java SE of 2018.
What Java SE provides
At its core, Java SE includes:
- The Java language itself, including modern features like records, sealed classes, pattern matching, and switch expressions
- The JVM, which gives you platform independence and decades of mature garbage collection, JIT compilation, and observability tooling
- Core libraries for collections, concurrency, file I/O, networking, and HTTP
- Build and dev tools: javac, jshell, jpackage, and the AOT cache introduced in recent LTS releases
These pieces form the runtime baseline that every Java framework, including Spring Boot, Quarkus, and Jakarta EE implementations, sits on top of.
What's new in Java SE that actually matters
If you've been away from the platform for a few years, four changes are worth knowing about before you make any architectural decisions:
Virtual threads (stable in Java 21). Project Loom collapsed the cost of a thread from megabytes of stack to a few hundred bytes. A single JVM can now run millions of concurrent virtual threads. This is the biggest concurrency change in Java's history and it removes the main argument for reactive frameworks like WebFlux on most workloads. Blocking code is fast again.
AOT compilation and native images. GraalVM native image and the JDK's own ahead-of-time caching turn Java apps into binaries that start in tens of milliseconds and use a fraction of the memory of a warm JVM. This used to be a Quarkus or Micronaut differentiator. It's now table stakes across the ecosystem, including Spring Boot 3+.
Records, sealed classes, and pattern matching. The boilerplate that used to push teams toward Lombok or Kotlin is mostly gone. Data-oriented programming in modern Java looks closer to Scala or Kotlin than to Java 8.
Java 25 LTS performance work. Compact object headers shrink object overhead by roughly 22% on heap-heavy workloads. The G1 garbage collector got a redesigned card table in Java 26 that delivers measurable throughput gains on reference-heavy code.
What Java SE doesn't give you
Plain Java SE is honest about its scope. It does not give you:
- A web server or HTTP routing layer
- Dependency injection
- Database access beyond raw JDBC
- Transaction management
- Security, authentication, or authorization frameworks
- A configuration system
You can build all of these by hand. Almost no one does. In practice, "I'm using Java SE" in 2026 means "I'm using Java SE plus a framework that supplies the missing pieces." That framework is the actual decision, which is where the rest of this guide focuses.
What is Jakarta EE? (Formerly Java EE)
Jakarta EE is the modern successor to Java EE, the standardized set of APIs and specifications for building enterprise-scale Java applications. If you wrote enterprise Java between 2000 and 2017, you wrote Java EE. Everything since 2018 is Jakarta EE.
The name change wasn't cosmetic. It came with a migration that every Java team upgrading in 2026 still has to plan for.
What changed: Java EE became Jakarta EE
Oracle transferred Java EE to the Eclipse Foundation in 2017. The platform was renamed Jakarta EE because Oracle retained the "Java" trademark. Java EE 8 (2017) was the last release under the old name. Jakarta EE 8 (2019) was the same platform under new governance.
Then came the breaking change. Starting with Jakarta EE 9 (2020), every package was renamed from javax.* to jakarta.*. An import that used to read import javax.persistence.Entity now reads import jakarta.persistence.Entity. The change was mechanical, but it touched every file in every Jakarta EE codebase on the planet, and it forced every framework that depended on those APIs to publish a major-version break.
This is why Spring Boot 3 (late 2022) was a hard upgrade. Spring Boot 3 dropped javax.* and adopted jakarta.*. Any Spring Boot 2.x application moving to 3.x or 4.x has to migrate the namespace. Tools like Eclipse Transformer and OpenRewrite automate most of it, but the migration is still the gating event for many platform upgrades happening in 2026.
What Jakarta EE provides today
Jakarta EE 11, released in 2025, is the current stable platform. Jakarta EE 12 is in development. The headline specifications most teams interact with are:
- CDI (Contexts and Dependency Injection), the dependency injection container at the center of every modern Jakarta EE app. CDI replaced EJB as the default DI mechanism years ago. EJB still exists but is largely a legacy concern.
- Jakarta Persistence (JPA) for ORM and database access
- Jakarta REST (JAX-RS) for REST endpoints
- Jakarta Servlet and WebSocket for HTTP and bidirectional communication
- Jakarta Data, new in Jakarta EE 11. A standardized repository pattern, similar in feel to Spring Data, that simplifies persistence access
- Jakarta Concurrency, updated in Jakarta EE 11 with first-class virtual thread support
- Jakarta Messaging (JMS), Jakarta Transactions (JTA), Jakarta Security, Jakarta Validation, and Jakarta Batch for the rest of the platform
If you're a Spring developer, several of these will look familiar. That's not coincidence. Spring's annotations and patterns shaped Jakarta EE's modernization, and Jakarta EE's specifications now define the underlying APIs Spring builds on. The two ecosystems converged.
Jakarta EE Core Profile: the cloud-native subset
A common objection to Jakarta EE is that it's too heavy for microservices. Jakarta EE 10 answered this directly with the Core Profile: a minimal subset of specifications (CDI Lite, JAX-RS, JSON-P, JSON-B, Annotations, Interceptors, Dependency Injection) explicitly designed for lightweight cloud-native runtimes and AOT compilation.
The Core Profile is what runtimes like Quarkus implement when they want Jakarta EE compatibility without the full platform's footprint. It's the answer to "Jakarta EE doesn't fit in a container." It does. The original critique was about WebSphere and WebLogic, not about Jakarta EE the specification.
Modern Jakarta EE runtimes
In 2026, picking Jakarta EE doesn't mean picking a multi-gigabyte application server. The runtimes teams actually choose are:
- Quarkus (Red Hat). Compiles to GraalVM native images. Cold start under 50 ms, memory footprint under 50 MB. Built for containers, serverless, and Kubernetes from day one.
- Helidon (Oracle). Available in two flavors: Helidon SE (reactive, lightweight) and Helidon MP (full MicroProfile and Jakarta EE). Native image support.
- Open Liberty (IBM). Modular runtime where you load only the features you need. The lightweight profile is competitive with Spring Boot on memory.
- Payara Micro and Payara Server. The successor to GlassFish, with strong support for incremental modernization of legacy Java EE workloads.
- WildFly (Red Hat). The community upstream of JBoss EAP. Suitable for both traditional app server deployments and bootable JAR packaging.
The legacy "heavyweight Java EE" stereotype belongs to WebSphere full profile and WebLogic. Those are real products with real footprints, but in 2026 they're an active migration target, not a forward choice for new development.
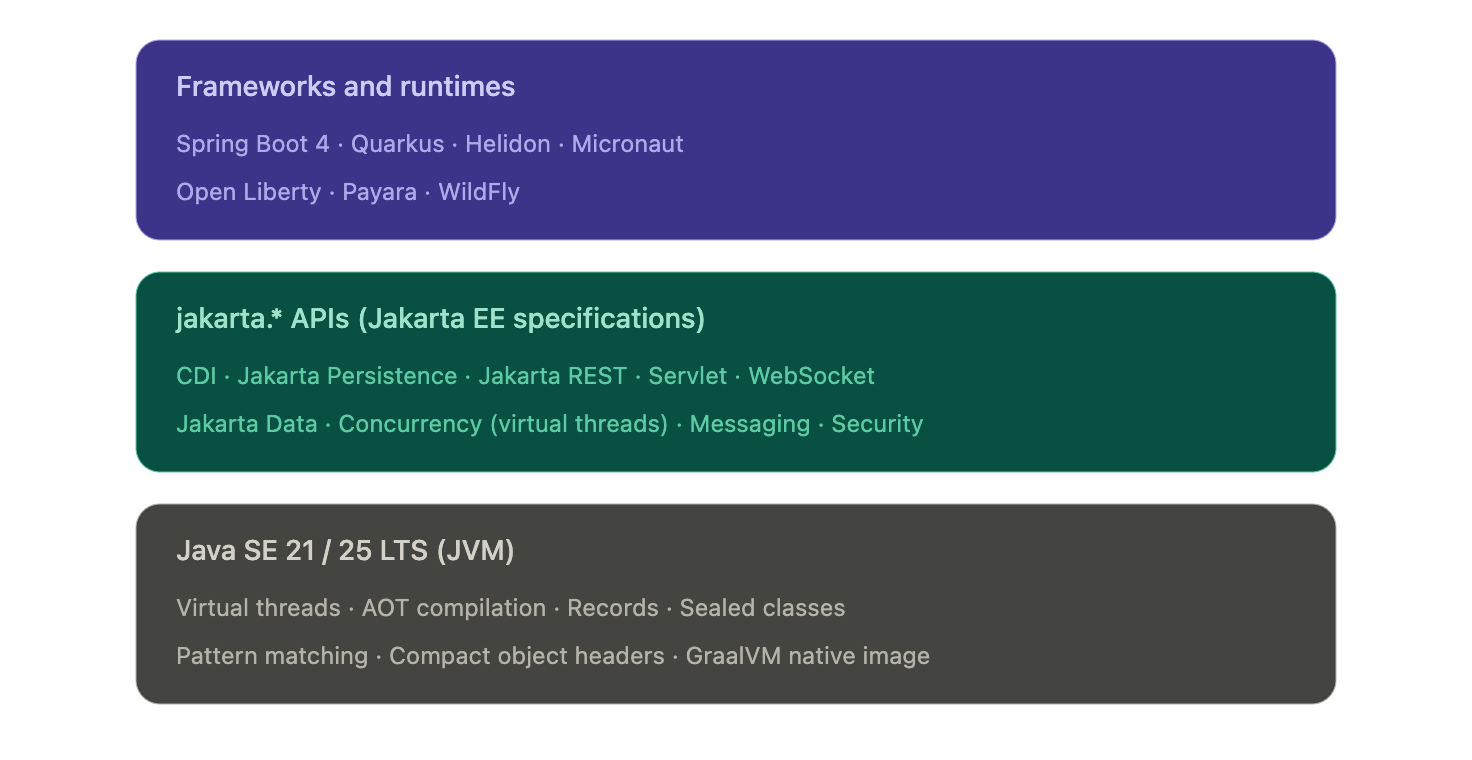
Figure: Modern enterprise Java is a layered stack. Frameworks and runtimes pick their packaging and opinions, but they all sit on the same jakarta.* API surface and the same JVM.
Where the modern Java stacks actually differ
- The honest answer to "Spring Boot vs Jakarta EE" in 2026 is that they differ less than they used to and more than the convergence story implies. The two questions worth separating are: what's actually shared now, and where does the choice still change your life as a platform engineer.
- What's converged (no longer a real differentiator)
- Three things used to be on every Java EE vs Spring comparison and aren't anymore:
- The API surface. Spring Boot 3 and 4 use the same jakarta.* packages Jakarta EE itself defines. A Servlet is a Servlet. A @PersistenceContext is a @PersistenceContext. The annotations and types your business logic touches are the same on both stacks.
- Concurrency model. Virtual threads (Java 21) work identically under any framework. Both Spring Boot and Jakarta EE Concurrency expose virtual-thread executors. The reactive-or-blocking debate that defined the last five years has largely collapsed for typical CRUD services.
- Native compilation. GraalVM native image works for Spring Boot (via Spring AOT), Quarkus, Helidon, Micronaut, and most Jakarta EE runtimes. Cold-start under 100 ms and memory under 100 MB are no longer Quarkus differentiators. They're available on every modern stack with varying degrees of polish.
- If a comparison article tells you the choice between Spring Boot and Jakarta EE comes down to APIs, threading, or native compilation, it's working from a 2020 mental model.
- Where the stacks still diverge
- Four areas actually shape your platform team's day-to-day:
- Packaging and deployment. Spring Boot's fat-JAR plus embedded Tomcat or Netty is the assumed baseline across most of the industry. Quarkus and Helidon SE produce equally simple bootable JARs but lean harder on native images for cold-start-sensitive workloads. Open Liberty, Payara, and WildFly support deployable WAR or EAR archives onto a runtime, which still matters in regulated environments where the runtime is provisioned and audited separately from the application.
- Startup and memory profile. This is where the real numbers diverge. A typical Spring Boot service on the JVM starts in 2 to 5 seconds and runs in 200 to 400 MB. Quarkus on the JVM lands closer to 1 second and 150 MB. Quarkus or Helidon as a native binary starts in 30 to 80 ms and runs in 30 to 80 MB. If you're scaling to zero, running on edge nodes, or paying per-millisecond on a serverless platform, that gap is the entire reason to look beyond Spring Boot.
- Configuration philosophy. Spring Boot leans hard on auto-configuration: pull in a starter, get sane defaults, override what you need. Jakarta EE leans harder on explicit declaration through CDI and standard configuration sources. Neither is objectively better, but they shape how readable a 50-service codebase is to a new hire. Spring Boot wins on initial productivity. Jakarta EE wins on "what is this service actually doing" once the codebase has aged for three years.
- Ecosystem and hiring. Spring Boot has the larger community, the larger Stack Overflow corpus, and the deeper integration library ecosystem. For most enterprise teams, that gravity is the dominant factor. Jakarta EE runtimes and Quarkus, Helidon, and Micronaut all have first-class documentation, but the available talent pool is meaningfully smaller. This is a delivery risk, not a technology risk, and it's worth treating it as one.
- The honest framing for a platform team in 2026: pick the stack whose packaging, runtime profile, and ecosystem maturity match your actual workload. Don't pick based on philosophical preferences for "standards" or "convention over configuration." Those debates were settled in the convergence.
From convergence to choice: what actually drives the decision in 2026
By this point in the article, the framing should be obvious: Spring Boot, Quarkus, Helidon, Micronaut, and vanilla Jakarta EE on Open Liberty or Payara are not five different platforms. They're five different opinions sitting on the same jakarta.* APIs and the same JVM. So how do teams actually decide?
In practice, four signals do most of the work.
Signal 1: What does the rest of your fleet run?
The single biggest predictor of which stack a new service uses is which stack the team's other services already use. This is not laziness. It's a sound platform decision. Two services on the same framework share build tooling, base container images, observability libraries, configuration patterns, deployment templates, and on-call runbooks. A team running 40 Spring Boot services will pay a real operational tax to introduce a Quarkus service, even if Quarkus is technically the better fit for that one workload.
The exception is when the new workload has a specific profile that the existing stack genuinely can't serve well. A Spring Boot shop building one event-driven function that needs to scale to zero on AWS Lambda has a legitimate reason to reach for Quarkus or a native Spring Boot image. A Jakarta EE shop building one async data-processing service has a legitimate reason to reach for Spring Boot's mature integration ecosystem. The decision rule is not "best tool for the job in isolation," it's "best tool given what we already operate."
Signal 2: What's the deployment target?
The deployment target matters more than most architecture discussions admit. Three patterns dominate:
- Long-running services on Kubernetes or VMs. Any framework works. Spring Boot is the path of least resistance because the ecosystem assumes it. Quarkus, Helidon, and Open Liberty's lightweight profiles are competitive on the JVM and pull ahead on memory.
- Serverless and scale-to-zero. Cold start is the dominant cost. Native compilation moves from a nice-to-have to a requirement. Quarkus native and Spring Boot native are the realistic options. Helidon SE native is competitive.
- Traditional application servers. If the deployment target is an existing WebLogic or WebSphere environment, the question isn't which framework to adopt. The question is whether to keep deploying onto that runtime (Open Liberty and Payara are the modernization paths) or to refactor toward a JAR-based deployment model.
Signal 3: What's the team's reactive vs imperative bias?
Five years ago, this was a religious debate. Virtual threads have mostly settled it for new code. But existing services that are already reactive don't get a free migration, and teams that have built fluency with Project Reactor, RxJava, or Mutiny will keep getting value from those investments.
The practical guidance:
- New service, no existing reactive code, typical CRUD or RPC workload: write imperative code on virtual threads. Spring Boot or Jakarta EE either way.
- New service, high-fan-out integration or backpressure-sensitive streaming: reactive still wins. Spring WebFlux or Quarkus with Mutiny.
- Existing reactive codebase: do not migrate to imperative just because virtual threads exist. The migration cost is real. The benefit is marginal for code that already works.
Signal 4: How much governance do you need?
This is the question that quietly distinguishes Jakarta EE from Spring Boot in regulated environments. Jakarta EE is a specification with multiple compatible implementations. A regulated bank or insurer can require "any Jakarta EE 11 compatible runtime" in a procurement document and have meaningful vendor portability. Spring Boot is a single implementation, governed by VMware. That's fine for most teams. It's a real consideration for organizations with compliance requirements around vendor lock-in.
Quarkus, Helidon, and Open Liberty all sit on the Jakarta EE side of this line because they implement Jakarta EE specifications. Spring Boot does not, despite using jakarta.* packages. The distinction matters less than it used to, but it has not gone away.
The takeaway
The convergence at the API layer means most teams can pick any of these stacks and ship perfectly good software. The choice is no longer a technology bet. It's a fit-to-fleet, fit-to-deployment-target, and fit-to-governance-model decision. The teams that get this wrong are the ones still litigating it as a technology choice.
Why your stack choice shapes reliability and AI SRE
Stack choice does not end at deployment. It shapes how your services emit telemetry, how incidents propagate, and how quickly your platform team can pin down the root cause when something breaks at 2 a.m. The convergence story makes parts of this easier (shared APIs mean shared observability standards) and parts of it harder (mixed fleets mean more surface area for incidents to hide in).
Three operational realities worth thinking through.
1. Mixed fleets are the norm, not the exception
The 2026 platform team rarely operates a single-framework fleet. Most enterprise Java estates look like this: a long tail of Spring Boot services, a growing edge of Quarkus or native-compiled services for cold-start-sensitive workloads, and a stable core of older Jakarta EE applications running on Open Liberty, Payara, or WildFly. Sometimes a few WebLogic or WebSphere systems are still in active modernization.
This mix is fine. It reflects real organizational decisions made over time. But it means your reliability strategy cannot assume framework homogeneity. Health endpoint conventions, log formats, metric names, and tracing instrumentation differ across these stacks unless you actively unify them. The teams that struggle most with incident response are the ones who let each service team pick its own conventions.
2. Observability standards have converged. Implementations have not.
OpenTelemetry has become the cross-stack standard for traces, metrics, and logs in enterprise Java. Spring Boot, Quarkus, Helidon, Micronaut, and most Jakarta EE runtimes all ship with OpenTelemetry instrumentation either built-in or one dependency away. This is genuinely good news for platform teams.
The catch: standardization at the protocol layer does not give you standardization at the convention layer. Two services emitting OpenTelemetry traces can still tag spans with completely different attribute names. Two services emitting metrics can still use different naming conventions for the same operation. AI SRE platforms perform best when the signals they ingest are semantically consistent. That consistency is a platform-engineering decision, not a framework decision.
The practical guidance: pick a single OpenTelemetry semantic convention (the OTel HTTP and database conventions are reasonable defaults) and enforce it across stacks through your shared observability libraries. The framework choice does not matter as much as whether you've made the convention choice at all.
3. Cold-start patterns differ enough to change incident behavior
A typical Spring Boot service on the JVM takes 2 to 5 seconds to start, hits steady-state CPU and memory after another 30 to 60 seconds of JIT warmup, and produces meaningful traces and metrics throughout. A Quarkus native binary starts in under 100 milliseconds and reaches steady state immediately. These are different operational profiles. They produce different incident patterns.
Spring Boot deployments tend to fail visibly during startup or warmup. Native deployments tend to fail at build time or never. Spring Boot scaling events are slower and more forgiving. Native scaling events are faster but more brittle when something is wrong with the binary itself. AI SRE platforms detect anomalies based on baselines, and your baselines should reflect the runtime profile of the service being monitored. A 3-second startup that is normal for a JVM service is a critical anomaly for a native service.
Where AI-driven reliability earns its keep
This is where AI SRE platforms like Harness AI SRE become operationally meaningful. In a single-framework fleet, a senior SRE can mostly hold the operational model in their head. In a mixed fleet of 50 to 500 services across Spring Boot, Quarkus, and legacy Jakarta EE, no human can. The questions AI SRE answers well are exactly the questions mixed-fleet teams ask:
- Which of these 12 simultaneous alerts are symptoms of the same root cause?
- Is this latency spike on Service A correlated with the deployment of Service B 40 minutes ago?
- Has this service's startup pattern drifted from its historical baseline in a way that predicts a future outage?
- Across this fleet, which services share the dependency that just got a critical CVE?
These questions are tractable for AI when the underlying telemetry is consistent. They are intractable for humans regardless of telemetry quality. That's the operational case for treating AI SRE as platform infrastructure rather than as a tool individual teams adopt.
The framework choice shapes the data. The platform decision is what you do with it.
See how Harness AI SRE correlates incidents across mixed Java fleets.
Framework decision matrix: which stack fits which workload
The honest answer to "which Java stack should we use" depends on what you're building, what you already operate, and what your deployment target looks like. The matrix below is opinionated and concrete. Use it as a starting point, not a final answer.
Spring Boot
Choose when:
- Your team already runs Spring Boot. The hiring pool, ecosystem, and shared platform tooling pay for themselves several times over.
- You need the broadest integration library coverage. Spring Data, Spring Security, Spring Cloud, and the surrounding ecosystem are deeper than any Jakarta EE alternative.
- You want a single mainstream choice that any senior Java engineer will recognize on day one.
- You need a mature reactive option for backpressure-sensitive or very high fan-out workloads (Spring WebFlux).
Avoid when:
- Cold-start time is your dominant cost and you don't want to take on Spring Boot AOT and native image build complexity.
- Procurement requires multi-vendor specification compatibility. Spring Boot is a single VMware-governed implementation.
Current version baseline: Spring Boot 4.0 (released late 2025), running on Java 21 or 25 LTS. Spring Boot 3.x remains a reasonable choice for teams not ready to upgrade Spring Framework to 7.
Quarkus
Choose when:
- You're deploying to serverless, edge, or scale-to-zero environments where cold start and memory footprint are the dominant operational costs.
- Native image is a first-class concern, not an afterthought. Quarkus was designed around it.
- You want Jakarta EE compatibility with cloud-native packaging and a developer experience optimized for fast feedback loops (live reload, dev services).
- You're greenfield or building a clearly-bounded subset of services where the team can absorb the smaller talent pool.
Avoid when:
- The team has no existing Quarkus expertise and the workload doesn't actually need native compilation. The startup-time gains on the JVM are real but marginal compared to the hiring cost.
- You're deeply invested in Spring-specific libraries (Spring Cloud, Spring Data's full feature set). Quarkus has equivalents for most things, but the migration cost is real.
Helidon
Choose when:
- You're an Oracle-aligned shop or run on Oracle Cloud Infrastructure. Helidon is well-supported there.
- You want a clear choice between a reactive flavor (Helidon SE) and a full Jakarta EE / MicroProfile flavor (Helidon MP) inside the same product family.
- You need native image support backed by an enterprise vendor.
Avoid when:
- You're not in an Oracle-leaning environment. The community and ecosystem around Helidon are smaller than Quarkus or Spring Boot, and the network effects matter.
Micronaut
Choose when:
- You want compile-time dependency injection to avoid reflection overhead and improve startup time on the JVM, without committing to a native image build.
- You're building polyglot teams across Java, Kotlin, and Groovy and want consistent ergonomics.
- You like the architectural opinions: ahead-of-time everything, no runtime classpath scanning, fast cold start without GraalVM as a hard requirement.
Avoid when:
- You need a deep ecosystem of integration libraries on day one. Micronaut's ecosystem is solid but smaller than Spring's.
Vanilla Jakarta EE on Open Liberty, Payara, or WildFly
Choose when:
- You have existing Java EE applications you're modernizing incrementally. These runtimes support the deployable WAR or EAR model and let you upgrade Java versions and Jakarta EE versions without rewriting deployment topology.
- Procurement or compliance requires multi-vendor specification compatibility. "Any Jakarta EE 11 compatible runtime" is a meaningful procurement clause. "Spring Boot 4" is not.
- You want long-term stability over framework innovation. Jakarta EE specifications evolve more slowly and with stronger backwards compatibility guarantees than Spring Boot.
- Your operations team is already proficient with one of these runtimes and the cost of switching outweighs the benefit.
Avoid when:
- You're greenfield with no Jakarta EE legacy. The other options on this list will move faster.
A note on legacy WebSphere and WebLogic
Neither of these is a forward choice in 2026. Both are real products with real production footprints, but new development on them is rare outside very specific enterprise circumstances. If you're running WebSphere full profile or WebLogic, the relevant question is the modernization path: typically Open Liberty (the IBM-supported migration target from WebSphere) or Helidon and WildFly (common WebLogic migration targets).
How to actually decide
If you've read this far and the matrix still feels like five reasonable options, default to one of two answers:
- Greenfield, no strong existing fleet bias: Spring Boot. The ecosystem advantage compounds over time, and any future "we should have picked X for cold start" pain is fixable with Spring Boot AOT or by introducing a second framework for that specific workload.
- Greenfield, cold start matters from day one: Quarkus. The investment in native image tooling and the Quarkus dev experience pays off when scale-to-zero and per-millisecond billing are real costs.
For everything else, the matrix above is a tiebreaker. The decision rule that beats every other rule is: pick the framework your platform team can operate well at 2 a.m.
What this looks like in practice
The article has been pushing toward one conclusion: in 2026, most enterprise Java estates are mixed-framework by design, and the platform team's job is to make that mix operable rather than to force consolidation.
What that looks like concretely:
A Spring Boot core handles the long tail of CRUD services and customer-facing APIs. A handful of Quarkus or native Spring Boot services sit at the edges where cold start matters: serverless functions, event handlers, scale-to-zero workloads. A stable set of Jakarta EE applications on Open Liberty or Payara handles the deeply-integrated systems that have been running reliably for years and would cost more to rewrite than to maintain. Java 21 is the floor across all of it, with a planned migration to Java 25 LTS over the next 12 to 18 months.
This is not an architectural compromise. It is the correct answer for organizations that have grown over time and have services with genuinely different operational profiles. The mistake is treating the mix as a problem to solve rather than an environment to operate.
Four questions worth asking before any new service
When a team proposes adding a new service to the fleet, four questions separate good decisions from defaults:
- What does the rest of our fleet run, and is there a specific reason this service should differ? If yes, name the reason. If no, match the fleet.
- What's the deployment target, and does cold start materially affect cost or user experience? If yes, native compilation is on the table. If no, the JVM is fine.
- What does the service need to integrate with, and which framework's ecosystem makes that easiest? This is usually the strongest signal.
- Who's going to operate this at 2 a.m., and what do they already know? The answer almost always points back to the existing fleet.
These questions matter more than any framework comparison because they're the questions a senior platform engineer asks before writing the first line of code. The frameworks themselves have converged enough that the operational fit dominates the technical fit.
From stack choice to delivery velocity: standardize with AI-powered CD and GitOps
The four questions at the end of the previous section all point at the same operational problem. A platform team running a mixed-framework Java fleet faces the same delivery bottleneck regardless of which frameworks are in the mix: ticket-ops and pipeline sprawl that compound with every new service.
The frameworks have converged. The pipelines have not. Most enterprise Java teams still operate one CI/CD configuration for Spring Boot, a different one for Quarkus, a third for Jakarta EE on Open Liberty or Payara, and a long tail of bespoke automation for whatever legacy systems are still in flight. Every new service adds operational surface area. Every framework upgrade creates a coordination problem.
This is the layer where AI-powered continuous delivery and GitOps practices stop being aspirational and become structural. Pull-based deployments through GitOps eliminate the manual approval steps that previously gated Spring Boot rollouts but not Quarkus ones. Policy as Code guardrails enforce the same release strategies, security requirements, and resource limits across every framework in the fleet. Automated verification catches deployment anomalies against each service's own baseline, whether that baseline is a 3-second JVM startup or a 50-millisecond native cold start. Intelligent rollbacks protect production without requiring on-call engineers to remember which framework needs which recovery playbook.
The platform decision is no longer which Java framework to standardize on. It's how to operate the mix you already have without paying a coordination tax on every change.
Frequently asked questions
What is the difference between Java SE and Jakarta EE in 2026?
Java SE is the language, JVM, and core libraries every Java application runs on. Jakarta EE is a set of standardized APIs (CDI, Jakarta Persistence, Jakarta REST, Servlet, Jakarta Data, and others) that extend Java SE for enterprise applications. In 2026, the choice is rarely between Java SE and Jakarta EE directly. It's between frameworks and runtimes (Spring Boot, Quarkus, Helidon, Micronaut, Open Liberty, Payara, WildFly) that all sit on Java SE and most of which implement or interoperate with the Jakarta EE specifications.
Is Java EE the same as Jakarta EE?
Jakarta EE is the direct successor to Java EE under new governance at the Eclipse Foundation. Oracle transferred Java EE to Eclipse in 2017 and the platform was renamed because Oracle retained the "Java" trademark. Java EE 8 (2017) was the last release under the old name. Jakarta EE 8 (2019) was the same platform under the new name. Jakarta EE 11 (2025) is the current stable version.
What is the javax to jakarta namespace migration?
Starting with Jakarta EE 9 in 2020, every Jakarta EE package was renamed from javax.* to jakarta.*. An import that used to read import javax.persistence.Entity now reads import jakarta.persistence.Entity. Spring Boot 3 (late 2022) and Spring Boot 4 both require the new namespace, which means any Spring Boot 2.x application upgrading to 3.x has to migrate every affected import. Tools like Eclipse Transformer and OpenRewrite automate most of the migration, but it remains the gating event for many platform upgrades happening in 2026.
Should I use Spring Boot or Jakarta EE for a new microservice in 2026?
For most greenfield services, Spring Boot is the path of least resistance because of its ecosystem and hiring advantages. Choose a Jakarta EE runtime like Quarkus when cold start time and memory footprint are your dominant operational costs, when you need native compilation as a first-class concern, or when procurement requires multi-vendor specification compatibility. The technical capabilities have largely converged. The decision is mostly about ecosystem fit, deployment target, and what your platform team already operates well.
What's the performance difference between Spring Boot and Quarkus?
On the JVM, a typical Spring Boot service starts in 2 to 5 seconds and runs in 200 to 400 MB, while a Quarkus service starts closer to 1 second and runs in 150 to 250 MB. As GraalVM native binaries, both Spring Boot (via Spring AOT) and Quarkus start in 30 to 100 milliseconds and run in 30 to 80 MB. The real performance difference shows up in cold-start-sensitive deployments like serverless and scale-to-zero workloads, where native compilation moves from a nice-to-have to a requirement.
Which Java version should I target in 2026?
Java 21 LTS is the production baseline for most enterprise Java fleets, and Java 25 LTS (released September 2025) is what platform teams are migrating to over the next 12 to 18 months. Java 17 should be treated as the floor, not the target. Avoid non-LTS releases (currently Java 26) for production unless you have a specific reason to track preview features, since support windows for non-LTS versions are six months. Both Spring Boot 4 and Jakarta EE 11 support Java 21 with first-class enhancements when running on Java 25.
Can Jakarta EE and Spring Boot services run in the same Kubernetes cluster?
Yes, and most enterprise Java fleets do exactly this. The technical compatibility is straightforward because both stacks produce standard container images and both expose health, metrics, and logs through OpenTelemetry-compatible instrumentation. The harder problem is operational consistency: enforcing the same release strategies, observability conventions, and governance policies across both stacks. Policy-as-code and unified delivery pipelines solve this regardless of which frameworks are in the mix.
Is Java EE dead?
Java EE under that name ended in 2017, but the platform is alive and actively developed under the Jakarta EE name at the Eclipse Foundation. Jakarta EE 11 shipped in 2025 with new specifications including Jakarta Data and first-class virtual thread support. Modern runtimes like Quarkus, Helidon, Open Liberty, Payara, and WildFly implement Jakarta EE specifications in cloud-native form. The "Java EE is dead" narrative was specifically about heavyweight application servers like WebLogic and WebSphere full profile, which are an active migration target rather than a forward choice.
Experience AI-powered continuous delivery and native GitOps with Harness

Automated Release Management: From CABs to Continuous Delivery
- CABs optimize for perceived safety, not actual risk reduction. Batched releases, surface-level reviews, and meeting cadence latency create the very risks they are intended to mitigate.
- Policy as code, automated quality gates, and continuous change tracking enforce the same rules on every change, consistently and at scale.
- Speed and safety are not a trade-off if you build the right controls. Smaller, iterative releases with automated verification limit the blast radius and shorten recovery time.
The thing with Change Advisory Boards is that the intent was always good. Get smart people in a room, look at the evidence, and make sure nothing catastrophic goes out the door. In theory, that's hard to argue with.
It doesn't scale in practice. Things happen between meetings. Teams rush to hit the window. The CAB meeting may not catch every risky deployment, but at least everyone can feel good about the process before the incident happens.
Automated release management asks a different question entirely. Not "did a human approve this?" but "has this change actually proven it's safe?" Governance moves into the pipeline itself, running the same checks on every change at whatever speed your teams ship.
That's exactly what Harness Continuous Delivery is built for: policy-driven pipelines, automated assurance, and governance that scales with your teams.
Automated Release Management: What Is It?
Automated release management replaces manual review and approval steps with automated quality gates, policy enforcement, and deployment orchestration.
Rather than routing change decisions through a central committee, automated systems evaluate each change against defined criteria like test coverage, security scans, rollback definitions and compliance checks, then approve or block it based on objective results.
That does not get rid of governance. It brings governance into the delivery pipeline and consistently applies it to all changes, not just the ones that make it onto a CAB agenda.
Automated release management paired with a continuous delivery platform allows teams to deploy frequently, recover quickly, and audit completely, with no meeting necessary.
The Traditional Model: Why CABs Can't Keep Up
The CAB model made sense when software changed slowly and release cycles were long. Cross-functional stakeholders would review evidence packets, testing results, deployment plans, security scans and determine if a release was safe to promote.
The problem is that the model doesn't scale well as the speed of delivery accelerates. Some patterns keep repeating themselves:
- Surface inspection. CAB members typically don't have deep, application-level context on the changes they are approving. Reviews are about whether the evidence packet looks complete, not if the change is actually safe.
- Grouped risk. Changes build up between cycles and ship together in larger releases. The bigger the release, the bigger the blast radius when things go wrong.
- Delayed compounding. Delays build up across teams and sprints waiting for the next CAB slot. Delivery speed becomes a function of the meeting cadence, not the capability of the team.
- Big overhead for engineers. Senior engineers spend hours compiling evidence packets and presenting to committees, time that could be spent shipping.
DORA's research provides a useful gut-check here: high-performing engineering teams deploy far more frequently than their peers with lower change failure rates, not higher. It's not approval volume that matters; it's pipeline discipline.
The fundamental problem is not that governance is bad. It is that a meeting-based governance model cannot keep up with a continuous delivery operating model.
From Approval Gates to Automated Assurance
The difference in automated release management boils down to a different question at the heart of the process.
Old model: Who approved this? New model: What did this change prove before we shipped it?
That reframe yields a meaningfully different architecture. Governance takes place on every change, not at scheduled times. Pass/fail criteria are deterministic, not subjective. Compliance is an output of the pipeline, not a prerequisite to enter it.
Building an Automated Release Management Pipeline
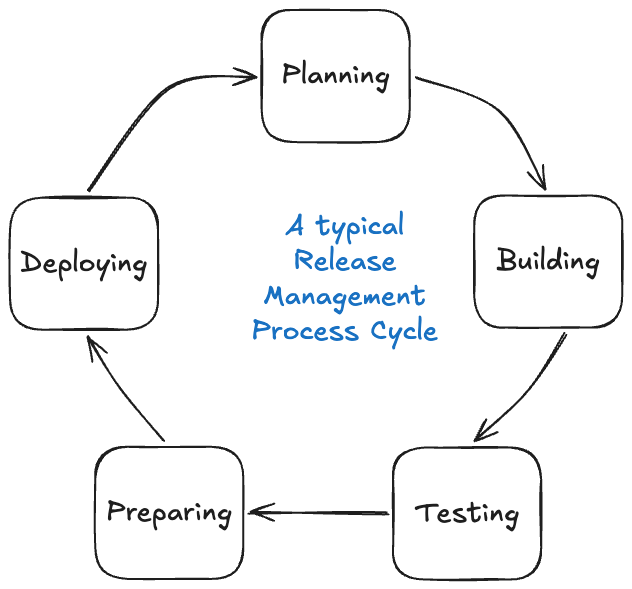
1. Continuous Change Tracking
All changes must be traceable without requiring manual compilation. Version control becomes the single source of truth. CI systems automatically generate commit history, build artifacts and deployment-linked changelogs as part of normal pipeline execution. By default, the audit trail is there.
Harness GitOps takes this a step further, using Git as the single source of truth for the state of the deployment. All configuration changes are versioned, all deployments are tracked, and drift is detected automatically.
2. Automated Quality Gates
Validation moves from presentations to execution. Quality gates run on every change: unit and integration tests, end-to-end validation, security and compliance scans, and performance checks. These are not release-window activities. They are part of the standard CI/CD pipeline, running continuously on every change that moves through.
Harness Powerful Pipelines supports multi-stage pipeline orchestration across complex environments with built-in test intelligence and conditional execution logic. Quality gates run fast and don't create unnecessary bottlenecks.
3. Policy as Code
CAB rules get codified in an automated release management model. No critical vulnerabilities before production promotion. Minimum thresholds for test coverage. Mandatory rollback procedure definitions. These policies are automatically enforced in the pipeline. Pass, and the change proceeds. Fail, and it's reliably blocked at scale, with no human bottleneck in the critical path.
That's what policy as code is all about: governance that's version-controlled, auditable and applied the same way every time.
Harness DevOps Pipeline Governance lets teams define and enforce pipeline policies in one place. Compliance is not something you check at the end. It's something the pipeline enforces throughout.
4. AI-Assisted Deployment Verification
Even with strong quality gates, production deployments carry residual risk. Test environments do not always mirror what production surfaces.
Harness AI-Assisted Deployment Verification automatically analyzes deployment health using ML to compare metrics, logs and traces against baseline behavior. When something drifts, it surfaces the signal quickly, enabling rollback before an incident escalates. This closes the loop between deployment and validation, making the pipeline genuinely self-correcting, not just self-approving.
Managing Complex, Interdependent Releases
In practice, systems rarely exist in isolation. One change can affect backend services, APIs, web apps, mobile apps and edge targets all at once. In tightly coupled systems, changes to one component can cause another to break, and partial deployments can be risky without careful coordination.
Traditional coordination uses spreadsheets, emails, and war rooms. Modern automated release management means orchestration: platforms that model service dependencies, trigger pipelines in the right order, and ensure all components pass quality gates before release. Multi-team coordination becomes a single-action, end-to-end deployment.
Harness Continuous Delivery has built-in support for orchestrated multi-service deployments with dependency mapping and conditional promotion logic. Deploy Anywhere extends this to cloud, hybrid, on-prem and edge environments without requiring separate toolchains for each target.
Harness pipelines also support canary deployments and GitOps-based progressive delivery for rollout strategies tailored to deployment risk.
Reducing Coupling Over Time
Managing interdependent releases is a good start. The goal is to reduce the coupling itself so teams can ship independently without synchronized multi-team deployments. Three practices tend to accelerate that:
- Contract testing. Services define and verify their contracts, so a change in one will not silently break others.
- Feature flags. Feature flags decouple code deployment from feature activation. Code ships continuously; features turn on when they're ready. They also act as a safety net post-deployment. If a feature causes unexpected behavior in production, it can be disabled instantly without a full rollback.
- Backward-compatible APIs. Designing for backward compatibility means downstream services do not have to be updated simultaneously with upstream changes.
Together, these patterns move teams toward the continuous delivery ideal: frequent, small, independent releases, each of which is safe on its own.
What Automated Release Management Delivers
The results of replacing CAB-driven processes with policy-driven pipelines and automated assurance are measurable:
- More velocity. Releases are continuous, not fixed to a cadence. Time to production goes from weeks to hours.
- Consistent quality. All changes go through the same validation, not just the ones that make it onto a CAB agenda.
- Less risk. Smaller incremental releases mean a smaller blast radius. Automated rollback means quicker recovery when things go wrong.
- Complete auditability. All changes, gates, policy checks and deployments are automatically documented with no manual evidence collection required.
Harness CD Visualize DevOps Data surfaces deployment frequency, change failure rates and mean time to recovery in real time. These are the DORA metrics that measure delivery health with zero instrumentation overhead.
Build Controls That Don't Slow You Down
CABs were created for a slower world, where a weekly review meeting could credibly keep up with the cadence of releases. That world is long gone for most engineering organizations today.
The takeaway here is this: automated release management doesn't remove governance. It rebuilds governance as a system that is fast, consistent, auditable and embedded directly in the delivery pipeline. The teams that move fastest aren't the ones with the loosest controls. They're the ones with controls that don't slow them down.
If you're ready to move from approval bottlenecks to automated assurance, Harness Continuous Delivery is built for exactly that.
Release Management: Frequently Asked Questions (FAQs)
What is automated release management?
Automated release management is the practice of using automated quality gates, policy enforcement and deployment orchestration to replace manual approval steps in the software release process. Rather than routing changes to a committee, the pipeline evaluates each change against predefined criteria and approves or blocks it based on objective results.
What is the difference between automated release management and a CAB process?
A CAB relies on scheduled human review to approve changes before they go into production. Automated release management takes that validation and builds it into the pipeline itself, running the same checks on every change instead of batching them for periodic review. The result is faster delivery with more consistent governance.
What are quality gates in a release pipeline?
Quality gates are automated checkpoints a change must pass before moving to the next stage. Common examples include test coverage thresholds, security scan results, and performance benchmarks. A change that fails a gate is blocked automatically, without human intervention.
What is policy as code?
Policy as code is the practice of expressing governance rules in version-controlled configuration files rather than documents or meeting agendas. The pipeline then automatically enforces those rules on every deployment, making compliance consistent and auditable by default.
What is the role of feature flags in automated release management?
Feature flags decouple code deployment from feature activation. Teams can ship code continuously without exposing unfinished features to users, and can disable a feature instantly if it causes issues in production, without triggering a full rollback.
What deployment strategies work best with automated release management?
Incremental strategies like canary deployments work well because they limit the blast radius of any given change. Paired with automated verification, the pipeline can catch problems early in the rollout and halt or roll back before they affect all users.
How does Harness support automated release management?
Harness Continuous Delivery provides end-to-end pipeline orchestration, built-in policy governance, GitOps-based change tracking, AI-assisted deployment verification, and real-time DORA metrics. It's designed to replace manual release processes with automated systems that scale across any environment.

Introducing Harness Release Orchestration: Enterprise Release Management, Reimagined
Modern software delivery has evolved far beyond single-service deployments. Today's releases span dozens of services, multiple teams, and complex approval workflows—coordinated through spreadsheets, Slack channels, and manual checklists scattered across tools. When a production release involves deploying ten microservices across three environments, enabling five feature flags, running security scans, collecting approvals from four stakeholders, and coordinating with three different teams, the question isn't whether you can ship—it's whether you can track what shipped, when it shipped, and who approved it.
Release Orchestration solves this. It provides a unified framework for modeling, scheduling, automating, and tracking complex software releases across teams, tools, and environments—giving you end-to-end visibility from planning through production deployment and monitoring.
Why Release Orchestration Matters
Without orchestration, enterprise releases become coordination nightmares. Status lives in spreadsheets that go stale within hours. Coordination happens through email threads spanning dozens of messages. There's no single source of truth for what was deployed, when, or by whom. Manual checklists drift out of sync. Approval workflows rely on memory and goodwill. And when something goes wrong at 2 AM, reconstructing what happened requires археology across multiple systems.
Release Orchestration transforms this chaos into structured, auditable, repeatable processes. Model your release blueprint once—defining phases, activities, dependencies, and approval gates—then execute it repeatedly with different configurations. Automate pipeline-backed steps while retaining manual sign-offs where governance requires them. Track activity-level status, phase-level progress, and overall release health in real time. Enforce approvals, capture sign-offs, and maintain a full audit trail linking code to deployment to business outcome.
The result? Releases that used to require days of coordination now run faster with complete visibility and zero spreadsheets.
How Release Orchestration Works
Release Orchestration introduces a structured, visual approach to modeling and executing releases. Define Processes—reusable blueprints composed of Phases (Build, Testing, Deployment) and Activities (automated pipelines, manual approvals, or nested subprocesses). Release Groups define cadences and automatically generate releases. The Release Calendar provides unified visibility across all releases. The Activity Store and Input Store promote reusability—define once, execute many times with different configurations. And ad hoc releases let you execute any process on demand when you need flexibility outside your regular schedule.
At its core, Release Orchestration delivers the foundational capabilities enterprise teams need: process modeling with visual editors, scheduled and recurring releases through release groups, real-time execution tracking with dependency management, comprehensive audit trails for compliance, and AI-powered process creation that transforms natural language descriptions into structured workflows. These capabilities form the foundation for enterprise release management at scale.
What's New: Capabilities Launching with Release Orchestration
Release Orchestration launches with a comprehensive set of capabilities designed for enterprise release management. Here's what you can do today.
Ad Hoc Releases: Create Releases On-the-Go
Not every release fits a scheduled release. Customer-specific deployments, unscheduled maintenance, and process testing need one-off releases. Ad hoc releases let you create and execute releases on demand-select a process, configure timing, provide inputs, and optionally run immediately. Test new processes in isolation, handle customer deployments without disrupting your calendar, or orchestrate emergency maintenance with full tracking and audit capabilities.
Multi-Service & Multi-Environment Support
Modern releases deploy multiple services across multiple environments. Release Orchestration's input system handles this through variable mapping—define global variables like releaseVersion and `targetEnvironment` once, and they flow automatically to all activities. Deploy to QA with "QA Inputs," production with "Production Inputs"—same process, different configurations. This eliminates repetitive data entry, ensures consistency, and scales from three services to thirty without growing complexity.
Notifications: Stay Informed at Every Step
Release Orchestration integrates with Harness's centralized notification framework, delivering alerts when releases start, pause for input, complete, or fail. Route notifications to Slack, email, PagerDuty, Microsoft Teams, or webhooks. Platform teams managing multiple releases shift from reactive monitoring to proactive awareness—get notified immediately when action is required.
Reporting: Download Detailed Execution Reports
Compliance reviews and post-mortems require detailed records. Release Orchestration provides downloadable Excel reports with complete execution history—every activity, status, timestamps, approvals, and inputs used. Generate reports for individual releases (sprint retrospectives) or release groups (quarterly audits). Activity-level detail meets compliance needs; process-level overviews serve executive summaries. All execution data is captured in the audit trail, allowing you to reconstruct exactly what happened during any release.
Filters: Find What Matters Fast
As releases scale, filters help you focus. Filter by source (ad hoc vs recurring), status (in progress, completed, failed), time window (this sprint, Q1 2026), environment (production, staging), or scope (specific orgs/projects). Platform teams filter to ad hoc releases for one-off deployments. Release managers filter by status for in-progress releases. Compliance teams filter by date range for audit periods. Transform an overwhelming calendar into a focused view of exactly what you need.
Hotfix Process: Fast-Track Emergency Releases
Production incidents don't wait for your release cadence. Release Orchestration supports hotfix workflows that fast-track emergency releases while maintaining governance. Mark releases as hotfixes to distinguish them in calendars and reports. The system detects execution conflicts—if a hotfix targets an environment where a release is running, you get visibility to coordinate decisions. Hotfixes use the same process structure, ensuring that approvals and audit trails are maintained. The hotfix designation flows through reports and logs, documenting emergency procedures for post-incident reviews. Speed meets governance.
Manual Activities: Approvals and Sign-Offs in Context
Not everything can be automated. Security reviews, architectural approvals, and stakeholder sign-offs require human judgment. Release Orchestration treats manual activities as first-class citizens with the same visibility and dependency support as automated activities. Manual activities pause execution until someone provides input—an approval, verification, or checklist confirmation. Notifications alert the responsible person; they review the context and complete the activity, optionally leaving notes. Manual activities can depend on automated activities (approval after deployment) or vice versa (deployment after approval). All completions appear in audit trails and reports for compliance documentation.
Building Releases That Match How You Work
Release Orchestration provides primitives—processes, phases, activities, dependencies, inputs—that compose to match how your organization ships software. Model microservice releases with parallel deployments and end-to-end tracking. Define compliance-driven releases with approval gates at critical checkpoints. Create streamlined hotfix workflows for emergencies. Coordinate feature flag enablement with deployments. Assign phase owners for multi-team coordination with notification-driven handoffs. The system scales from simple three-phase releases to complex workflows with fifty activities and nested subprocesses.
AI-Powered Process Creation
Harness AI transforms natural language descriptions into structured processes. Describe your workflow—"Create a multi-service release with phases for build, testing, deployment, and monitoring. Assign owners for Development, QA, and DevOps,"—and AI generates the complete structure with phases, activities, and dependencies. Refine the generated process by adding activities, adjusting dependencies, and configuring inputs. This reduces process modeling time from hours to minutes, making it practical to create specialized processes for different release types.
Real-Time Visibility Across the Release Lifecycle
Release Orchestration provides real-time tracking at three levels: activity (running, succeeded, failed, waiting), phase (overall progress), and process (end-to-end status). The execution graph shows phases as nodes, dependencies as arrows, and color-coded status on each activity. Drill into pipeline executions from the release view with one click. See approval history for manual activities—who approved, when, and with what notes. This unified view eliminates the need to check multiple systems. Platform teams can see at a glance which releases are progressing smoothly, which are awaiting approval, and which need attention. [Learn more →](https://developer.harness.io/docs/release-orchestration/execution/activity-execution-flow)
Get Started with Release Orchestration
Release Orchestration is available now in Harness. Contact Harness Support to enable the module for your account. Once enabled, explore Processes (model release blueprints), Release Calendar (schedule and track releases), Activity Store (reusable activities), and Input Store (configuration sets). The getting started guide walks you through creating your first AI-powered process, adding activities, and executing a release.
What's Next
We're actively developing additional capabilities: deeper analytics and insights (release velocity metrics, phase duration trends, failure pattern analysis), advanced dependency modeling (cross-release dependencies, environment-level locking), enhanced collaboration (in-line comments, Slack-native monitoring), a template marketplace for common release patterns, and API/GitOps for managing processes as code. The roadmap prioritizes capabilities that help teams ship faster with greater confidence.
Transform Your Release Process
Software delivery has evolved far beyond single-service deployments, but release management tooling hasn't kept pace. Spreadsheets, email coordination, and manual checklists don't scale to modern microservice architectures, multi-team workflows, and compliance requirements. Release Orchestration provides the unified framework enterprise teams need to model, automate, and track complex releases across teams, tools, and environments.
Define reusable processes. Execute them with different inputs. Track activity-level progress. Enforce approvals and capture sign-offs. Maintain complete audit trails. All in one place, integrated with the pipelines and deployment workflows you already use.
Ready to see it in action? Explore the Release Orchestration documentation or reach out to your Harness account team to discuss how Release Orchestration can transform your release workflows.
The future of release management isn't about doing the same manual coordination faster—it's about orchestrating releases as structured, repeatable, auditable processes. That future is available today.
Q1 2026 Product Update: Harness Pipeline
Welcome to our Q1 2026 Pipeline update! This quarter brings eight major enhancements that make pipeline development faster, validation easier, and governance stronger. From Git tags for immutable pipeline versions to AI-assisted policy authoring, these capabilities address the most common friction points teams encounter when scaling pipeline automation across their organizations. This update complements our Continuous Delivery & GitOps update released today, which covers expansions to the deployment platform and AI-powered verification.
Git Experience Enhancements
Pipeline development workflows gain significant GitX improvements this quarter, bringing immutable versioning, flexible testing, and pre-commit validation directly into your Git-based workflows.
Git Tags for Pipeline Executions
Pipelines stored in Git can now be triggered and executed from Git tags, not just branches. This unlocks release workflows where pipeline versions align with semantic versioning tags in your repository—when you tag a release as `v2.1.0` in Git, run that exact pipeline version via the UI or API. Tags provide immutable references to specific pipeline states, making it easy to replay historical pipeline configurations for compliance audits, debugging, or managing multiple product versions in parallel.
Learn more about Git tags for pipelines →
Branch Selection for Child Pipelines
Pipeline chaining now supports branch selection for child pipelines, not just the default master branch. When configuring a Pipeline stage, specify which branch of the child pipeline to execute, enabling proper testing of parent-child pipeline integrations before merging to production. This is crucial when output variables from the child pipeline are only available in a feature branch, or when you're testing coordinated changes across multiple chained pipelines.
Learn more about pipeline chaining →
Dry-Run Validation API
A new validation API lets you check pipeline YAML before committing changes to your repository. The API validates YAML syntax, schema conformance, entity references (Services, Environments, Connectors, Templates), RBAC permissions, OPA policy compliance, and expression syntax—all without actually running the pipeline or updating it in Harness. This closes a critical gap in GitOps workflows: changes made directly in GitHub bypass Harness validation, enabling teams to validate bulk updates in feature branches before merging and to catch configuration errors early.
DAG Support
Directed Acyclic Graph (DAG) execution support moves to Phase 2 with full UI integration. Define complex step dependencies in which multiple steps can run in parallel but must complete before downstream steps begin, within a single stage. DAG support enables sophisticated deployment patterns, such as parallel infrastructure provisioning followed by application deployment, or concurrent test suite execution with a final aggregation step. The visual graph makes it easy to understand execution flow and identify bottlenecks, while the declarative YAML representation keeps configuration simple.
Observability & Notifications
Pipeline observability and notification capabilities expand to give platform teams better visibility into queue states and more granular control over failure alerting.
Queued Pipeline Visibility
A new Account Settings page surfaces all queued pipelines across your entire account, showing queue position, org/project filters, and estimated execution order. The queue view includes bulk abort capabilities for queued pipelines and is available to Account Admins. For teams using pipeline queues to manage deployment locks or shared resource access, this visibility eliminates the mystery of why a pipeline is waiting and how long it's likely to remain queued.
Learn more about pipeline queuing →
Step-Specific Failure Notifications
Centralized notifications now support step-specific failure triggers, not just stage-level or pipeline-level failures. Configure notifications to fire only when a particular critical step fails—like a production deployment step or a compliance validation check—reducing alert noise and ensuring teams get notified about failures that actually matter. This granular control means you can route different failure types to different teams or channels: a failed security scan notifies the security team, while a failed deployment step notifies the on-call engineer.
Learn more about pipeline notifications →
Governance & Policy
OPA policy capabilities receive significant AI-powered enhancements and full GitX integration, making governance more accessible and easier to scale across organizations.
AI-Assisted Policy Authoring
An AI assistant helps write OPA policies, reducing the expertise barrier for policy creation. Describe your governance requirements in natural language, and the assistant generates the corresponding Rego policy with explanations of how it works. This democratizes policy authoring beyond Rego experts, enabling security teams, compliance officers, and platform engineers to codify governance requirements without deep OPA expertise.
Learn more about OPA AI Assistant →
Git Experience Support for OPA Policies
OPA policies now support the full GitX experience, including branch switching, bidirectional sync, and package name management. Policies can be developed and tested in feature branches before rolling out to production, with PR workflows providing change review and approval. This brings the same infrastructure-as-code benefits you have for pipelines and templates to your governance layer, enabling version control, change tracking, and collaborative policy development.
Learn more about OPA GitX integration →
Enhanced Policy Evaluation APIs
New APIs support evaluation by both policy set IDs and entity-type/action pairs, giving teams greater flexibility in structuring and applying policies across their organizations. This enables more sophisticated policy architectures in which different evaluation strategies can be applied to distinct workflows or organizational structures.
Learn more about OPA policies →
Get Started Today
The features highlighted in this update are available now in Harness Platform. Ready to see them in action? We've created a comprehensive video playlist that walks through these capabilities, featuring live demos and configuration guides.
Watch the Q1 2026 Pipeline Feature Playlist →
From Git-based pipeline versioning to AI-assisted policy authoring, this quarter delivers capabilities that streamline development workflows, improve validation practices, and strengthen governance controls. Whether you're managing dozens or thousands of pipelines, these enhancements reduce configuration overhead and align with how modern platform engineering teams scale automation across their organizations.
Be sure to also check out our companion post covering [Continuous Delivery & GitOps innovations](#)—including AI-powered verification, Azure Container Apps support, Windows deployment enhancements, and more.
Explore the documentation links throughout this post to dive deeper into each feature, or reach out to your Harness account team to discuss how these capabilities can accelerate your pipeline development and governance workflows.
What's coming next? Q2 2026 will bring advanced pipeline debugging capabilities, expanded expression engine functionality, and continued investment in GitX experience improvements. Stay tuned for more updates - we're just getting started.
Q1 2026 Product Update: Harness Continuous Delivery & GitOps
Welcome back to the quarterly update series! If you've been following along, you've seen how Q3 2025 brought [deeper control and strengthened integrations], while Q4 2025 [closed the year strong] with platform upgrades and quality-of-life improvements. The first quarter of 2026 builds on these foundations with AI-powered continuous verification that eliminates configuration overhead, expanded deployment platform support, and GitOps workflow enhancements that align with how teams actually ship software.
Deployments
Azure Container Apps Deployments
Native support for Azure Container Apps brings serverless container orchestration to your Azure workloads with the full Harness deployment experience. Azure Container Apps provides a fully managed platform for running microservices and containerized applications with automatic scaling based on HTTP traffic or events, and now you can deploy to it with the same confidence and control you have for Kubernetes, ECS, and other platforms.
Harness gives you two deployment strategies designed for Azure Container Apps' architecture. Choose Basic deployments for immediate traffic cutover when you need speed, or leverage Canary deployments with progressive traffic shifting (20% → 70% → 100%) using Azure Container Apps' built-in revision management to validate new versions under real production load. The platform includes an automated rollback that captures container app state before deployment, enabling instant recovery if issues arise. Authentication is flexible—support for both Azure OIDC (keyless authentication) and Service Principal methods means you can deploy across subscriptions using a single connector, with full support for Azure Container Registry (ACR) and Docker Hub as artifact sources.
Learn more about Azure Container Apps deployments →
Accelerating Windows Deployments
This year, we're focusing heavily on Windows deployments to address the performance and scalability challenges that enterprise Windows teams face every day. The two enhancements shipping this quarter are just the beginning—we're bringing the same innovation velocity to Windows deployments that you've come to expect across all Harness platforms. Stay tuned for more Windows Deployment capabilities throughout 2026 that will continue to streamline your deployment processes and eliminate friction in enterprise Windows environments.
Learn more about Windows deployments →
Windows Deployment Session Reuse
Windows Session Reuse eliminates redundant connection overhead by enabling delegate-wide session pooling, cutting connection setup time from 30-60 seconds to instant reuse in JEA environments. When a command step executes, Harness checks the pool for an existing idle session to the target host with matching credentials and reuses it immediately, dramatically reducing pipeline execution time for workflows with multiple command steps.
Learn more about Windows Session Reuse →
Multi-Host Deployment with Dynamic Targeting
Multi-Host Deployment with Dynamic Targeting extends Windows Deployment credential setup to dynamically target different hosts, enabling true parallel execution across multiple Windows servers. Configure multiple host groups within a single credential configuration, and Harness automatically routes commands to the appropriate servers based on your deployment strategy. This unlocks centralized credential management while maintaining the security boundaries required in JEA environments, enabling teams managing large Windows server fleets to deploy faster with reduced credential sprawl.
Learn more about Multi-Host Windows Deployments →
Smarter Amazon Elastic Container Service Management
Amazon ECS deployments get two powerful new capabilities that bring operational flexibility and automation to your container workloads.
Standalone ECS Scaling
Standalone ECS Scaling lets you scale services up or down without triggering a full deployment, enabling operators to respond to real-time demand without triggering change management processes. The new ECS Scale step lets you modify desired task counts on demand—whether you're responding to traffic spikes, performing maintenance windows, or testing capacity limits—without redeploying your application.
Learn more about ECS scaling →
ECS Scheduled Actions
ECS Scheduled Actions enable time-based scaling policies directly within your ECS service deployments, eliminating the need to manage scheduled actions separately in the AWS console while keeping your entire ECS configuration under version control. Define scheduled actions to automatically adjust desired task counts at specific times—scale up services before anticipated morning traffic, scale down during off-peak hours, or align capacity with predictable business patterns.
Learn more about ECS scheduled actions →
Terraform Security Enhancements
Terraform deployments now include automatic security protections that prevent accidental exposure of sensitive data throughout your pipeline workflows.
Masking Sensitive Terraform Outputs
Terraform outputs marked as `sensitive = true` are now automatically masked in the Harness UI, preventing accidental exposure of credentials, API keys, and other secrets in pipeline execution logs and output tabs. When Terraform outputs are marked as sensitive, Harness respects that designation and redacts the values wherever they appear—you can still reference these outputs in downstream steps using expressions, but the actual values remain encrypted and hidden from view.
Learn more about masking sensitive outputs →
Continuous Verification
This quarter's focus on continuous verification centers on eliminating configuration overhead through AI automation and expanding observability platform integrations. From zero-config deployment health analysis to Git-based configuration management, these capabilities make verification accessible to more teams while reducing the time to production-ready monitoring.
AI-Powered Continuous Verification
Alongside AI Verify, AI-assisted health source configuration makes traditional verification setup effortless through a guided workflow that discovers available signals from your observability platform, classifies them by deployment impact, and generates verification-ready configurations. Describe your service and monitoring goals in natural language, and the Configuration Agent automatically discovers relevant metrics, organizes them into intelligent categories, and generates the queries and thresholds for you—with human checkpoints for selection and refinement at every stage.
Fine-tune configurations with simple natural language inputs or create custom composite metrics on the fly. What used to take hours now takes minutes.
AI Verify eliminates the manual setup complexity that has traditionally slowed the adoption of continuous verification. No more baseline configuration, threshold tuning, or monitored service management. AI Verify deploys lightweight data-collection plugins into your Kubernetes cluster that collect, aggregate, and provide observability data while stripping personally identifiable information before it leaves your environment.
The plugins gather logs and metrics from your observability platforms and perform statistical and algorithmic anomaly detection. Large language models then contextualize these anomalies against your deployment verification criteria, filter false positives based on business-criticality, and synthesize natural-language root-cause insights with actionable remediation suggestions—all without requiring explicit baseline data. This shifts continuous verification from weeks of configuration work to immediate, intelligent monitoring that understands your services from day one.
Learn more about AI-powered verification →
Dynatrace DQL Support for Grail Metrics
Harness Continuous Verification now supports Dynatrace Query Language (DQL) for querying timeseries metrics from Dynatrace Grail, their next-generation data lakehouse. Craft sophisticated metric analysis using aggregation functions, enable dimension-based data splitting for per-instance continuous verification, and combine multiple data sources in a single query. This extends beyond the traditional Full Stack Observability model, giving you direct access to custom metric queries rather than relying solely on predefined metric packs.
Learn more about Dynatrace DQL support →
GitOps
GitOps workflows gain AI-powered intelligence, unified notifications, and enhanced PR capabilities this quarter. These improvements streamline application management, improve operational visibility, and align GitOps workflows with how teams naturally collaborate through pull requests.
AI-Powered GitOps Operations
AI-powered operations management brings natural language queries and intelligent automation to GitOps applications, AppSets, and clusters. Ask questions like "What applications are out of sync?" or "Which syncs failed in the past 24 hours?" and get instant answers drawn from your entire GitOps deployment landscape. The AI agent can also trigger operations—such as syncing all applications managing non-prod services with a single command or generating pipeline snippets for common GitOps workflows. This transforms dashboards and manual queries into conversational operations management, making GitOps accessible to platform teams, developers, and operators alike.
[Learn more about AI-powered GitOps →]
Centralized Notifications for GitOps Applications
GitOps applications now integrate with Harness's centralized notification framework, bringing the same notification capabilities available for pipelines to your GitOps workflows. Track application sync events—start, complete, success, and failure—alongside ApplicationSet creation, sync, and error events through Slack, email, PagerDuty, Microsoft Teams, or any webhook-compatible system. Configure notification rules at the account, organization, or project level using the same interface you already use for pipeline notifications.
Learn more about GitOps notifications →
Enhanced PR Workflows for GitOps
GitOps PR-based workflows get two key improvements. The Update Release Repo step can now block until the raised PR is merged, eliminating the need for separate Merge PR steps and manual approval stage coordination—the step creates the PR, waits for review, and proceeds once merged. Squash and Merge Support brings native squash-and-merge strategies to the Merge PR step, working with GitHub App tokens and following your repository's configured merge strategies to maintain a clean, linear repository history.
[Learn more about PR pipelines →]
Get Started Today
The features highlighted in this update are available now in Harness CD and GitOps. Ready to see them in action? We've created a comprehensive video playlist that walks through these capabilities, featuring live demos and configuration guides.
Watch the Q1 2026 Feature Playlist →
From AI-powered verification that understands your deployments from day one to Windows performance breakthroughs and GitOps workflow enhancements, this quarter delivers capabilities that eliminate configuration overhead, expand platform coverage, and align with how modern teams ship software.
Explore the documentation links throughout this post to dive deeper into each feature, or reach out to your Harness account team to discuss how these capabilities can accelerate your delivery workflows.
What's coming next? Q2 2026 will bring deeper integrations with cloud-native platforms, expanded AI capabilities across the deployment lifecycle, and continued investment in developer experience improvements. Stay tuned for more updates—we're just getting started.
_%20Formula%2C%20Examples%20%26%20DevOps%20Use%20Cases.png)
Mean Time to Failure (MTTF): What It Is and Why It Matters for Platform Engineering
- Mean Time to Failure (MTTF) turns repeated failures into a signal that can be predicted, allowing platform teams to plan for the number of incidents, the amount of capacity they need, and the SLOs they can actually meet.
- To get an accurate Mean Time to Failure, you need to have clean data, clear definitions of failure, and separate short-lived components from long-lived services instead of averaging everything together.
- Connecting Mean Time to Failure with MTTR, SLOs, and AI-powered automation from Harness changes how you think about failures from random chaos to an automated control loop that runs reliability.
Your production problems aren't just random. If a Kubernetes node fails every 72 hours or your CI runners crash every 4 builds, that's a clear pattern. Mean Time to Failure (MTTF) turns these failures into data that you can control, plan for, and improve over time.
MTTF should not be a decoration on a dashboard for platform engineering leaders; it should be a decision-making tool. With the right calculations, you can set realistic SLOs, plan capacity, and cut down on developer work by focusing on the parts that break the most often. You'll get exact formulas for distributed systems, data collection patterns that avoid common mistakes, and a playbook to turn reliability improvements into measurable ROI through automated resilience practices alongside faster recovery metrics.
Stop letting unpredictable failures drain your team's time and budget. With Harness Continuous Integration and Continuous Delivery, you can turn MTTF insights into concrete pipeline changes, progressive delivery strategies, and guardrails that keep reliability improving release after release.
What Is Mean Time to Failure (MTTF)?
Mean Time to Failure (MTTF) is the average operating time of non-repairable components before failure across a population.
At a basic level:
MTTF = total operating time ÷ number of failures
If 100 CI runners each run for 50 hours during a week (5,000 runner‑hours total) and 20 runners experience at least one hard failure, then:
MTTF = 5,000 ÷ 20 = 250 hours
Historically, MTTF is used for physical assets you replace instead of fix (light bulbs, disks, sealed devices). In software, the same concept fits ephemeral resources such as:
- Short‑lived containers and pods.
- CI/CD job runners and build agents.
- Batch jobs and serverless functions that are recreated after failure.
MTTF tells you how long things run, on average, before they fail and must be replaced. MTTF is an approximation, not a strict reliability model.
MTTF vs MTTR vs MTBF in DevOps Workflows
Three reliability metrics show up in every platform review:
- Mean Time to Failure (MTTF): Measures how long non‑repairable or ephemeral components run before failing and being replaced.
- Mean Time to Repair/Restore (MTTR): Measures how long it takes to restore a service to healthy operation after a failure.
- Mean Time Between Failures (MTBF): Measures how much uptime you get between failures for systems that are repaired and returned to service.
Use them to answer different questions:
- MTTF: How often do our ephemeral components fail?
- MTTR: How quickly can we restore user‑visible services when they do?
- MTBF: How stable are our long‑lived systems between failures?
For example:
- Track MTTF for pod lifetimes or CI runner stability so you can forecast incident volume and choose when to add redundancy or auto‑healing.
- Track MTTR for customer‑facing services and tie it to SLOs and incident response.
- Track MTBF for databases or API gateways so you can plan maintenance windows and capacity around real behavior instead of theoretical SLAs.
Your platform scorecards should display all three together, alongside SLO health and error budget burn, so teams see the full reliability picture instead of optimizing a single metric in isolation.
When MTTF Applies to Software
The theoretical rules around MTTF and MTBF are straightforward; the ambiguity comes when you apply them to real cloud‑native stacks. Concrete examples help.
Where MTTF is Most Meaningful
These components typically behave like non‑repairable items:
- Pods and containers that are recreated on failure.
- CI runners and ephemeral build agents that are provisioned per job or per batch.
- Batch jobs and workers that run to completion and are never “repaired” mid‑flight.
- Serverless functions are triggered on demand and recreated automatically.
For each of these, you can treat a single lifecycle (from start to failure/termination) as one observation in your MTTF dataset.
Where MTBF (Plus MTTR) is A Better Fit
These components behave more like classic repairable systems:
- Databases and stateful services that are brought back through restart, patch, or failover.
- API gateways, control planes, and load balancers that remain logically continuous across many incidents.
- Long‑running worker pools that survive node or pod replacements.
For these, you care more about how much uptime you get between failures (MTBF) and how quickly you can restore full health (MTTR).
The Common Pitfall: Equating Infra MTTF With User Reliability
It is tempting to say “our nodes have an MTTF of 720 hours, so our service is very reliable.” That is only true if your architecture masks those failures from users. User‑facing reliability lives at the service boundary, measured via SLOs and error budgets; component MTTF is an input that helps you:
- Find noisy dependencies.
- Plan redundancy and failover.
- Decide where to add automation or chaos tests.
MTTF helps you understand where things break; SLOs and MTTR tell you how much that matters to customers.
How to Calculate MTTF for Distributed Systems
The MTTF calculation is trivial. The work is in collecting honest data across a distributed system without losing important details.
1. Define Specific Failure Events
For each component type, decide exactly what counts as “failed,” for example:
- Container exits with a non‑zero status.
- Pod enters CrashLoopBackOff or is evicted for resource pressure.
- CI pipeline reaches a terminal “failed” state (not just retried).
- Node is in NotReady for longer than an agreed threshold.
Document these in your platform taxonomy so every team logs and reports failures the same way.
2. Track Lifecycle Start and End for Each Instance
For each instance in the population you’re measuring, capture:
- Start time – when the instance began its lifecycle.
- End time – either the failure time or the end of your observation window.
- Instance identifier – pod name, job ID, runner ID, etc.
Then compute:
MTTF = total operating time across all instances ÷ number of failed instances
This gives you MTTF for that class (e.g., “Linux GPU runners in prod”).
3. Segment by Workload Class and Aggregate With Weights
Never pool dissimilar components into a single MTTF number. Instead:
- Group instances into workload classes (service, environment, hardware profile, or usage pattern).
- Compute MTTF for each class independently.
- When needed, roll up with weighted exposure hours, not a simple average.
Example:
- Class A: 1,000 hours, 5 failures → MTTF_A = 200 hours.
- Class B: 100 hours, 1 failure → MTTF_B = 100 hours.
Fleet MTTF (weighted) = (1,000 + 100) ÷ (5 + 1) ≈ 183 hours, not the naive (200 + 100) ÷ 2.
4. Include Right‑censored Data
Some instances will still be running when you take the snapshot. If you drop them:
- You shrink total operating time.
- You keep the same number of failures.
- Your MTTF ends up artificially low.
When censored samples are common, use basic survival analysis (like Kaplan–Meier) so that "still running" instances add to the exposure instead of being thrown away. If you give them clear timestamps and labels, observability tools and data teams can usually take care of this for you.
Using MTTF to Set SLOs and Reduce Toil
MTTF becomes strategically important when you use it to shape SLOs, error budgets, and reliability investments, not just track uptime.
1. Project Incident Volume From MTTF
If a class of components has an MTTF of 72 hours, a single instance will fail about:
8,760 hours/year ÷ 72 ≈ 121 failures/year
With multiple instances and redundancy, not every failure becomes a user‑visible incident, but you can still estimate:
- Roughly how many failures will your platform team see?
- How often will those failures stress specific SLOs or error budgets?
2. Prioritize Components That Generate the Most Toil
MTTF highlights which components generate excessive manual work:
- A CI runner class with low MTTF forces engineers to babysit builds.
- A particular pod type that fails often might drive a disproportionate share of pages.
Use this to:
- Rank components by failure frequency × human touch time.
- Focus on resilience and automation work where you retire the most pages and tickets per unit effort.
3. Translate MTTF improvements into business outcomes
Because MTTF underpins incident rates, any improvement can be tied to measurable gains:
- Fewer incidents and on‑call pages.
- Less time lost to debugging failures that do not reach customers.
- Less need for excess capacity added as a buffer against frequent failures.
Treat MTTF as a leading indicator: when you raise it on critical components, you should see downstream improvements in SLO attainment and delivery cadence.
Practical Ways to Improve Mean Time to Failure
Once you know which components have the lowest MTTF and the highest operational cost, you can systematically improve them. In modern delivery pipelines, four patterns tend to pay off quickly.
1. Stabilize CI Pipelines and Build Infrastructure
Flaky CI is one of the most common sources of low MTTF and wasted engineering time.
You can improve CI‑related MTTF by:
- Reducing test‑driven failures with Harness Test Intelligence, which selects only tests relevant to a change and helps you isolate flaky tests instead of letting them hammer your MTTF.
- Identifying failure hot spots using Harness CI analytics and insights to see which repos, branches, or services correlate with most build failures.
- Shortening build exposure windows using incremental builds, which reuse previous build outputs, reducing the time during which build infra can fail.
Result: higher MTTF for pipelines and runners, fewer broken builds, and fewer interruptions for developers.
2. Use Progressive Delivery and Rollback to Protect Service MTTF
You cannot prevent every bad change, but you can limit how many become full‑blown incidents that count against your service‑level MTTF.
Key tactics:
- Design for redundancy across environments with Harness “deploy anywhere”, so a single node or zone failure does not reset service health.
- Configure canary, blue‑green, or rolling strategies in Harness “powerful pipelines” so new versions are exposed gradually and can be rolled back quickly.
- Wire in verification steps so bad versions are caught early rather than after a significant SLO hit.
This keeps effective MTTF for user‑facing services higher, even if underlying components still fail regularly.
3. Enforce Reliability Guardrails With Pipeline Governance
Many MTTF regressions start as “just one more config change” that slips past informal reviews. Prevent those with:
- Policy‑as‑code in Harness DevOps pipeline governance, where you define rules around high‑risk changes, mandatory checks, and SLO states.
- Conditional approvals for changes that touch historically fragile services or dependencies.
- Blocks on deployments when key reliability gates, like SLO burn or unresolved incidents, are breached.
This ensures the MTTF gains you’ve earned are not eroded by ad‑hoc changes and one‑off exceptions.
4. Continuously Validate Resilience With Chaos Engineering
To sustainably raise MTTF, you need confidence that your architecture and runbooks can handle real failures, not just happy‑path tests.
By running targeted chaos experiments on the components with the lowest MTTF, you can:
- Discover previously hidden failure modes.
- Fix them before they cause production incidents.
- Demonstrate to stakeholders how your changes improve resilience over time.
Monitoring and Improving MTTF with AI‑Powered Automation
When failures happen, MTTF tells you how often they occur. AI‑powered automation helps you decide what to do next—fast—so more failures stay under control and never become major incidents.
AI‑assisted Detection and Rollback
Harness AI‑assisted deployment verification analyzes metrics and logs during and after each deployment:
- It learns what “normal” looks like for each service.
- It flags anomalies in latency, error rates, or custom SLO indicators.
- It can recommend or trigger rollback directly through your CD pipelines.
The result is fewer deployments turning into user‑visible failures and a higher effective MTTF for your services, because many problematic changes are automatically rolled back before customers notice.
On the CI side, AI‑driven analysis works with Test Intelligence and analytics to:
- Cluster failures by likely root cause.
- Surface patterns, such as a particular dependency, test suite, or environment causing repeated failures.
- Guide you toward changes that will increase MTTF for builds and jobs.
SLO‑driven Guardrails Instead of Ad‑hoc Decisions
SLOs and error budgets turn raw data into rules. Instead of making teams watch dashboards and make decisions on their own, you can:
- Use SRM to set SLOs for important services and keep an eye on how much of the error budget is being used.
- Set up pipeline rules that automatically slow down or stop deployments when SLOs are in danger.
- Direct engineering efforts toward services with a decreasing MTTF and an increasing error-budget burn.
This completes the cycle: MTTF informs SLO design. Guardrails are based on SLOs, and AI-powered verification and rollbacks work on those guardrails at machine speed.
Want to turn MTTF insights into automated reliability improvements?
Explore Harness CI/CD to reduce failure rates, enforce guardrails, and improve SLO performance.
MTTF: Frequently Asked Questions (FAQs)
MTTF can feel abstract until you have to justify reliability decisions or explain incident patterns to stakeholders. These FAQs break down the most common questions practitioners ask about MTTF and how it relates to other reliability metrics.
How is MTTF different from MTBF?
MTTF is the average time it takes for a group of parts, like pods or temporary CI runners, to fail in a way that can't be fixed. MTBF tells you how long systems you fix and put back into service, like databases or long-running services, are up and running before they break down again.
When should I use MTTF instead of MTTR?
When you need to know how often failures happen so you can plan for redundancy or auto-healing, use MTTF. Use MTTR to find out how quickly you can fix services that users can see after they go down. Both metrics work together and are usually used to help make decisions about SLOs and error budgets.
Can I trust MTTF if I only have a few failures?
MTTF estimates are very uncertain when there aren't many failures. To make the number more reliable, put similar workloads together, add up the exposure hours for each class, and think of MTTF as a range or trend instead of a single point. If a part didn't fail in your window, don't assume that it will never fail; instead, treat that as incomplete data.
What data quality issues most often skew MTTF?
Most of the time, MTTF is skewed by dropping instances that are still running when the measurement is taken (right-censoring), combining environments (staging, load, and production) into one metric, and having different or unclear definitions of failure across teams. Fixing these problems usually makes MTTF more useful than any other advanced statistical method.
When is MTTF the wrong metric for modern platforms?
MTTF doesn't work when failures are very similar or when you're measuring systems that are fixed instead of replaced. In those cases, MTBF and MTTR, when looked at through SLOs and error budgets, usually give better advice than just one MTTF value.
How does MTTF connect to business outcomes?
When the MTTF is higher on important parts, there are fewer problems, fewer pages, and less time lost by developers fixing them. You can link improvements directly to faster safe release velocity, lower downtime risk, and lower operational costs when you combine MTTF with SLOs, error budgets, chaos engineering, and AI-powered automation.

From Deployment to Confidence: Why Continuous Verification Is the Missing Piece in Modern CD Pipelines
Modern engineering teams have become exceptionally good at shipping software quickly.
With modern CI/CD platforms, what once required careful coordination, late-night release windows, and layers of approvals now happens almost invisibly. Pipelines execute in minutes. Releases flow continuously. The friction that once slowed everything down has been engineered away.
From the outside, it looks like progress in its purest form. Automation removed bottlenecks. Cloud infrastructure removed limits. Pipelines removed human delay. But beneath that acceleration, there is a quieter reality that only reveals itself at the worst possible moment.
Speed does not guarantee safety. And more importantly, speed does not guarantee confidence. Most teams today can answer one question with absolute certainty:
Did the deployment succeed?
Green pipeline. All checks passed. No errors.
But when you ask slightly different questions, the answers become far less certain:
Did the deployment actually make the system better? And more importantly - did it improve customer experience, accelerate transactions, and drive business outcomes, or did it quietly degrade performance and impact revenue?
That difference may sound subtle, but in practice, it is where reliability either exists - or quietly breaks. This gap between deployment success and validated system behavior is exactly where continuous verification becomes critical.
And nowhere has this been more evident than in a financial services transformation I witnessed firsthand, where a perfectly “successful” deployment slowly degraded a live payment system without anyone noticing.
When a successful deployment quietly degraded payments
A large global bank was deep into modernizing its digital payment platform. They were not experimenting. They were executing at scale. Their architecture was exactly what you would expect from a mature engineering organization. Kubernetes-based microservices, fully automated CD pipelines, Infrastructure defined as code and testing embedded across every stage. Over time, they had achieved something remarkable. Deployments had become routine. What once required weekend coordination and careful planning was now happening several times a day, almost without discussion. Releases were no longer events. They were background activities.
Their typical deployment pipeline looked something like this:
Build → Security scan → Integration tests → Deploy → Smoke tests
.png)
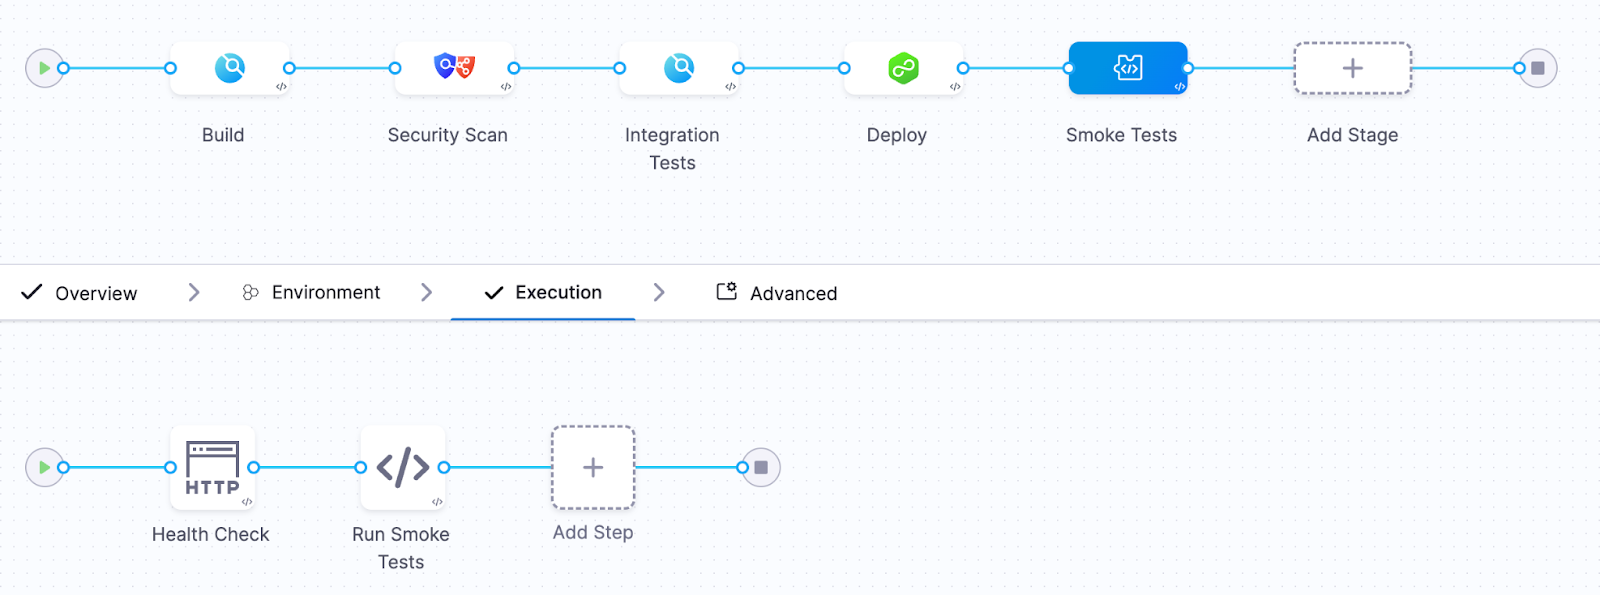
Build flowing into security scanning, into integration testing, then deployment, followed by smoke tests. It was elegant. Automated. The kind of pipeline you would proudly present at a conference. And for a while, it worked perfectly. Until one Friday afternoon…
The incident
A new version of the transaction validation service was deployed.
The release pipeline executed flawlessly.
Every step reported success.
- All automated tests passed
- The deployment completed successfully
- Kubernetes health checks reported that the service was ready
The pipeline marked the deployment as successful. The release moved forward. Engineers moved on to other tasks. But about twenty minutes later, something subtle began to happen. Payment processing latency began creeping upward. At first it was small.
Then the following symptoms appeared:
- payment processing latency increased by 40%
- transaction retries began increasing
- error rates slowly started climbing
Nothing catastrophic happened. The system did not crash. Pods did not fail. Containers did not restart. From the perspective of Kubernetes, everything looked healthy.
But the platform was slowly degrading. Revenue and customer experience were definitely impacted. Because the pipeline had already declared success, there was no mechanism to reconsider that decision. No feedback loop connecting real system behavior back into the deployment outcome.
The problem remained undetected for nearly half an hour. By the time engineers realized what was happening, the impact had already spread. Thousands of delayed transactions. Customer complaints increasing. Engineering teams pulled into urgent investigation.
The cause, when eventually identified, was deceptively simple. A small change in a database query. Slightly inefficient. Invisible under test conditions. But under real production load, it introduced just enough latency to ripple across the system.
Unit tests did not catch it. Integration tests did not catch it. Kubernetes health checks did not catch it. But the signals were there, visible in the observability platform. They simply were not part of the deployment decision.
A pattern I keep seeing in the field
What makes this story compelling is not that it happened. It is that it keeps happening. Over the past six months, across multiple enterprise environments, I have seen the same pattern emerge with striking consistency.
Different companies. Different industries. Different teams.
The same blind spot.
Every organization had invested heavily in observability. Their platforms were powered by tools like Datadog, Dynatrace, New Relic, AppDynamics, and Grafana.
Their systems were instrumented in depth. Metrics, logs, traces, business indicators - everything was being captured. Their dashboards were rich. Their visibility was impressive.
They could see everything. But only after the fact.
Because when I examined how deployments were validated, the story changed completely.
Pipelines relied almost exclusively on Kubernetes readiness and liveness checks, sometimes complemented by simple smoke tests. If the service started and responded, the deployment was considered successful. And that was the end of the decision process. Observability existed - but outside the pipeline.
It was a tool for humans to investigate problems, not a mechanism for the system to prevent them. In every case, the realization was the same. They had built world-class observability capabilities. But none of it was being used to decide whether a deployment should proceed.
Kubernetes health checks answer the wrong question
Kubernetes health checks are essential. They are incredibly effective at keeping systems running and enabling self-healing behavior. But they were never designed to answer the question that matters most during a deployment.
They tell you whether something is alive. They tell you whether it can receive traffic. They do not tell you whether it is behaving correctly. And that distinction is where modern incidents live.
A system can be fully operational from Kubernetes’ perspective while simultaneously degrading the experience for every user interacting with it.
I have seen systems where database latency doubles without any restart. Where memory usage slowly increases over hours. Where microservices begin retrying requests in subtle feedback loops. Where queues build silently until they become bottlenecks.
All of it happening while every pod remains in a perfectly “ready” state. Kubernetes reports success. Users experience degradation. The pipeline sees green. Reality is different. This is the illusion of a successful deployment.
The missing piece: continuous verification
Continuous verification changes the nature of the question. Instead of asking whether the deployment completed, it asks whether the system is behaving as expected.
It takes the signals already present in your preferred Observability platforms and brings them directly into the pipeline itself. Now the pipeline is no longer blind. It observes latency. Error rates. Throughput. Infrastructure signals. Even business-level indicators. It compares the behavior of the new version against a known baseline. And most importantly, it acts.
If the system begins to drift away from expected behavior, even subtly, the pipeline can stop the rollout and revert to a known good state automatically. No delay. No escalation. No manual intervention.
What the new pipeline looked like
After the incident, the platform team redesigned their approach. They integrated continuous verification using Harness with telemetry from their loved Observability tool.
Their new pipeline looked like this:
Build → Security Scan → Integration tests → Canary deployment → Continuous verification → Promote or rollback
.png)
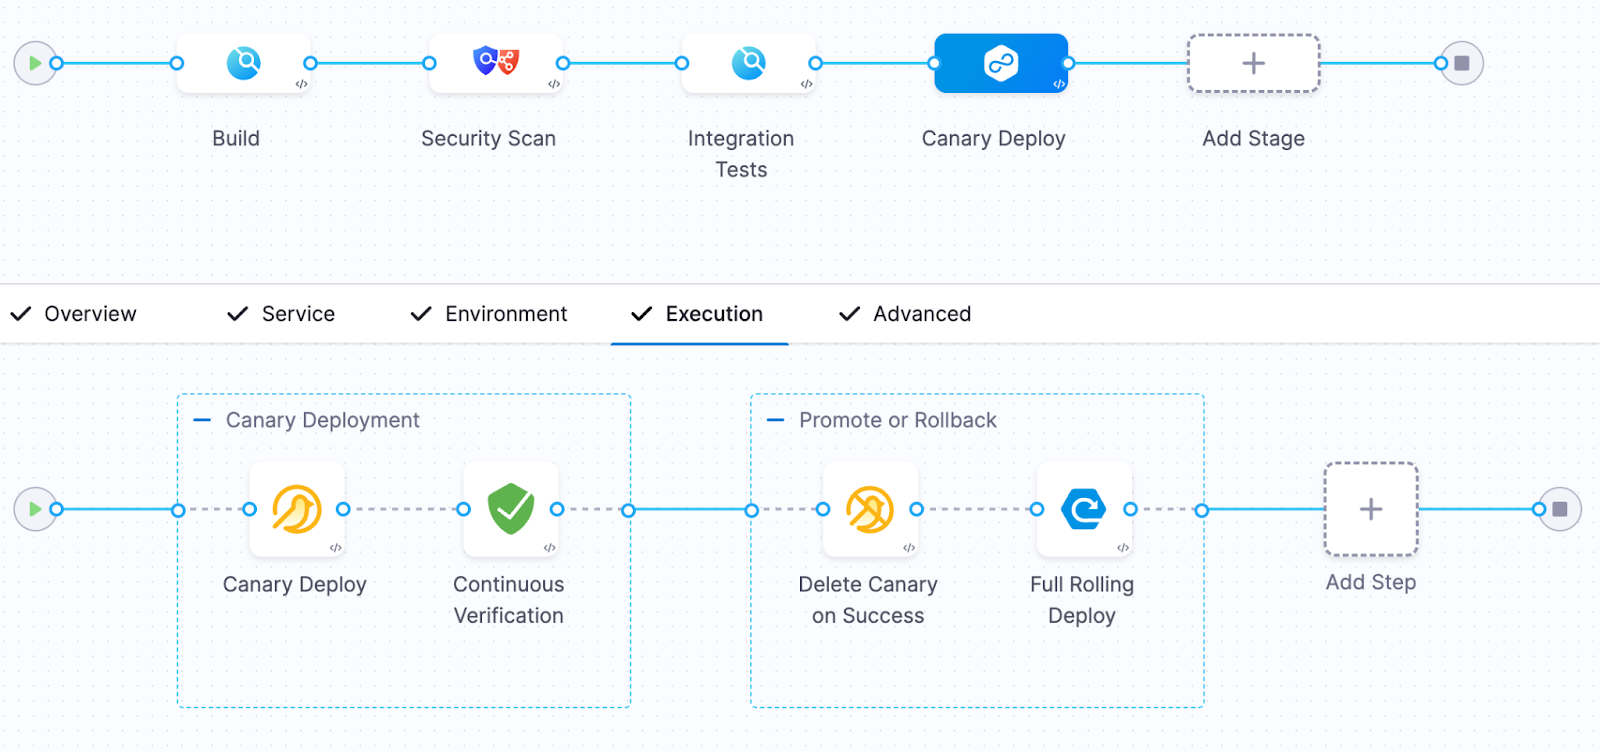
During the canary phase, only a small percentage of traffic was routed to the new version.
The verification step analyzed key signals including:
- p95 request latency
- API error rates
- database query duration
- CPU and memory pressure
- custom business metrics
The system compared two sets of signals:
Baseline behavior (previous version)
versus
Canary behavior (new version)
If the canary version performed worse than the baseline, the system immediately rejected the release.
The next deployment
Two weeks later, another release was pushed. This time, the sequence unfolded differently. The canary deployment began. Traffic started flowing. Observability data was analyzed in real time. Within minutes, a deviation appeared. Not dramatic. Not catastrophic. But enough.
Latency began to drift beyond acceptable thresholds. This time, the pipeline saw it. And without hesitation, it rolled back. No incident. No escalation. No customer impact. Just a silent correction, executed automatically. The kind of outcome most users will never notice - but that defines operational excellence.
Why continuous verification matters
Traditional pipelines answer a binary question.
Did the code deploy?
Continuous verification answers the questions that actually matter.
Did the system behave correctly after deployment? Did it improve customer experience?
In modern systems - distributed, dynamic, deeply interconnected - failures rarely present themselves as crashes. They appear as degradation. And if your pipeline cannot detect degradation, it is only solving half the problem. Continuous verification transforms observability into an automated safety gate for releases.It closes the loop.
The measurable impact
After implementing continuous verification, the platform team observed significant improvements. But the most important improvement was not technical. It was cultural. Engineers regained the confidence to deploy frequently without fear of hidden regressions.
DevSecOps needs runtime verification
Modern DevSecOps practices have matured significantly. We validate security. We enforce compliance. We ensure code quality. But we still tend to stop validation at the moment of deployment. Continuous verification extends that validation into real system behavior. It transforms the pipeline into a closed loop. Not just build, test, deploy. But build, test, deploy, verify. And that final step is where trust is established.
The future of continuous delivery
The most advanced engineering organizations are already evolving toward a new model. Deployment decisions are no longer based solely on pre-release validation. They are informed by live system behavior.
Observability is no longer a dashboard. It becomes part of the control system.
Platforms like Harness, integrated with your Observability tools, are enabling this shift. And once teams adopt this model, the difference is profound.
Final thought
Continuous delivery solved the problem of speed. Continuous verification solves the problem of confidence.
If your pipeline stops when deployment succeeds, you are still operating with incomplete information. Because in modern software delivery, success is not defined by whether something was deployed. It is defined by whether that deployment made the system better.
And the only reliable way to answer that - automatically, consistently, and at scale - is through continuous verification. Start treating observability as a release gate - not just a dashboard!

AI for GitOps: Tame your Argo Sprawl
Innovation is moving faster than ever, but software delivery has become the ultimate chokepoint. While AI coding assistants have flooded our repositories with an unprecedented volume of code, the teams responsible for actually delivering that code, our Platform and DevOps engineers, are often left drowning in manual toil.
If you’re managing Argo CD at an enterprise scale, you’re painfully familiar with the "Day 2" reality. It can become tab fatigue as a service: jumping between dozens of instances, chasing out-of-sync applications, and manually diffing YAML just to figure out where your configuration drifted.
Today, we are thrilled to introduce AI for Harness GitOps. It’s an agentic intelligence layer designed to help you manage, monitor, and troubleshoot your entire GitOps estate through simple, natural language.
From "ClickOps" to Conversational Control
Standard GitOps tools are excellent at syncing state, but they often lack the high-level orchestration required by complex enterprises. When an application goes out of sync, you shouldn't have to click through multiple tabs and clusters just to find out why.
With AI for GitOps, Harness brings a new level of context-aware, agentic intelligence to your delivery lifecycle:
- Fleet-Wide Troubleshooting: Imagine asking, "I have four out-of-sync apps; are they out of sync for the same reason?" Instead of checking each one manually, the Harness DevOps Agent researches the resource trees across your clusters, identifies a common Kustomization CRD issue, and provides a resolution in seconds.
- Agentic Configuration Management: The AI doesn't just read data; it acts on it. You can now manage the configuration of GitOps applications and Harness resources directly.
- Intelligent Workflow Orchestration: The AI can now modify and optimize the Harness Pipelines that surround your GitOps activities. If a deployment pattern is consistently failing due to timeout issues, you can instruct the agent to "Adjust the orchestration logic in the deployment pipeline to include an automated verification gate" and increase the health check timeout.
- Deep-Dive Diagnostics: Instantly retrieve container logs, track deployment events, and map resource dependencies using natural language prompts.
Why This Matters for the Enterprise
We built this because scaling GitOps shouldn't mean scaling your headcount. Our mission is to provide an Enterprise Control Plane that enhances your existing Argo investment rather than replacing it.
1. Eliminate "Day 2" Toil
Platform engineering teams are often overwhelmed and understaffed. By moving from manual root cause analysis to automated reasoning and active configuration management, we free up engineers to focus on innovation rather than repetitive maintenance tasks.
2. Accelerate MTTR
By leveraging the Harness Software Delivery Knowledge Graph, our AI understands your unique workflows, policies, and ecosystem. It doesn't just show you an error; it explains it in the context of your specific environment and can proactively suggest (or execute) the configuration changes needed to resolve the issue. The goal here is to move the needle on Mean Time to Recovery (MTTR) from hours to minutes.
3. Governance at Speed
Here’s the thing: speed without safety is just a faster way to break things, and work more nights and weekends fixing them. Harness ensures that enterprise-grade governance is built in, not bolted on. Every AI-driven action, including configuration updates and pipeline modifications, is governed by your existing RBAC and OPA (Open Policy Agent) policies, providing an immutable audit trail for every change.
Bottom Line: Ship Faster & Safer with AI
The promise of AI for developers has been held back by the limitations of the deployment pipeline. Harness AI for GitOps bridges that gap, providing a "prompt-to-production" workflow that is finally as fast as the code being written.
Simply put, it's time to stop syncing and start orchestrating. Experience the future of intelligent delivery with Harness.
Want to see it live? Get a demo.

The pipeline that never reached production
How template-driven CD prevents governance drift
Modern CI/CD platforms allow engineering teams to ship software faster than ever before.
Pipelines complete in minutes. Deployments that once required carefully coordinated release windows now happen dozens of times per day. Platform engineering teams have succeeded in giving developers unprecedented autonomy, enabling them to build, test, and deploy their services with remarkable speed.
Yet in highly regulated environments-especially in the financial services sector-speed alone cannot be the objective.
Control matters. Consistency matters. And perhaps most importantly, auditability matters.
In these environments, the real measure of a successful delivery platform is not only how quickly code moves through a pipeline. It is also how reliably the platform ensures that production changes are controlled, traceable, and compliant with governance standards.
Sometimes the most successful deployment pipeline is the one that never reaches production.
This is the story of how one enterprise platform team redesigned their delivery architecture to ensure that production pipelines remained governed, auditable, and secure by design.
The subtle risk in fast CI/CD platforms
A large financial institution had successfully adopted Harness for CI and CD across multiple engineering teams.
From a delivery perspective, the transformation looked extremely successful. Developers were productive, teams could create pipelines quickly, and deployments flowed smoothly through various non-production environments used for integration testing and validation. From the outside, the platform appeared healthy and efficient.
But during a platform architecture review, a deceptively simple question surfaced:
“What prevents someone from modifying a production pipeline directly?”
There had been no incidents. No production outages had been traced back to pipeline misconfiguration. No alarms had been raised by security or audit teams.
However, when the platform engineers examined the system more closely, they realized something concerning.
Production pipelines could still be modified manually.
In practice this meant governance relied largely on process discipline rather than platform enforcement. Engineers were expected to follow the right process, but the platform itself did not technically prevent deviations. In regulated industries, that is a risky place to be.
The architecture shift: separate authoring from execution
The platform team at the financial institution decided to rethink the delivery architecture entirely. Their redesign was guided by a simple but powerful principle:
Pipelines should be authored in a non-prod organization and executed in the production organization. And, if additional segregation was needed due to compliance, the team could decide to split into two separate accounts.
Authoring and experimentation should happen in a safe environment. Execution should occur in a controlled one.
Instead of creating additional tenants or separate accounts, the platform team decided to go with a dedicated non-prod organization within the same Harness account. This organization effectively acted as a staging environment for pipeline design and validation.
Architecture diagram
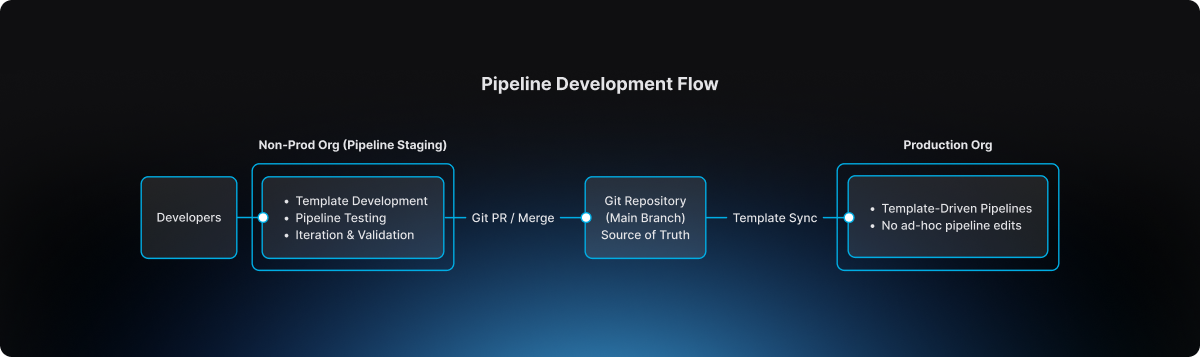
This separation introduced a clear lifecycle for pipeline evolution.
The non-prod organization became the staging environment where pipeline templates could be developed, tested, and refined. Engineers could experiment safely without impacting production governance.
The production organization, by contrast, became an execution environment. Pipelines there were not designed or modified freely. They were consumed from approved templates.
Guardrail #1: production pipelines must use templates
The first guardrail introduced by the platform team was straightforward but powerful.
Production pipelines must always be created from account-level templates.
Handcrafted pipelines were no longer allowed. Project-level template shortcuts were also prohibited, ensuring that governance could not be bypassed unintentionally.
This rule was enforced directly through OPA policies in Harness.
Example policy
package harness.cicd.pipeline

deny[msg] {
  template_scope := input.pipeline.template.scope
  template_scope != "account"
  msg = "pipeline can only be created from account level pipeline template"
}
This policy ensured that production pipelines were standardized by design. Engineers could not create or modify arbitrary pipelines inside the production organization. Instead, they were required to build pipelines by selecting from approved templates that had been validated by the platform team.
As a result, production pipelines ceased to be ad-hoc configurations. They became governed platform artifacts.
Guardrail #2: governance starts in the non-prod organization
Blocking unsafe pipelines in production was only part of the solution.
The platform team realized it would be even more effective to prevent non-compliant pipelines earlier in the lifecycle.
To accomplish this, they implemented structural guardrails within the non-prod organization used for pipeline staging. Templates could not even be saved unless they satisfied specific structural requirements defined by policy.
For example, templates were required to include mandatory stages, compliance checkpoints, and evidence collection steps necessary for audit traceability.
Example policy
package harness.ci_cd

deny[msg] {
  input.templates[_].stages == null
  msg = "Template must have necessary stages defined"
}

deny[msg] {
  some i
  stages := input.templates[i].stages
  stages == [Evidence_Collection]
  msg = "Template must have necessary stages defined"
}
These guardrails ensured that every template contained required compliance stages such as Evidence Collection, making it impossible for teams to bypass mandatory governance steps during pipeline design.
Governance, in other words, became embedded directly into the pipeline architecture itself.
The source of truth: Git
The next question the platform team addressed was where the canonical version of pipeline templates should reside.
The answer was clear: Git must become the source of truth.
Every template intended for production usage lived inside a repository where the main branch represented the official release line.
Direct pushes to the main branch were blocked. All changes required pull requests, and pull requests themselves were subject to approval workflows that mirrored enterprise change management practices.
Governance flow
.png)
This model introduced peer review, immutable change history, and a clear traceability chain connecting pipeline changes to formal change management records.
For auditors and platform leaders alike, this was a significant improvement.
The promotion workflow
Once governance mechanisms were in place, the promotion workflow itself became predictable and repeatable.
Engineers first authored and validated templates within the non-prod organization used for pipeline staging. There they could test pipelines using real deployments in controlled non-production environments.
The typical delivery flow followed a familiar sequence:
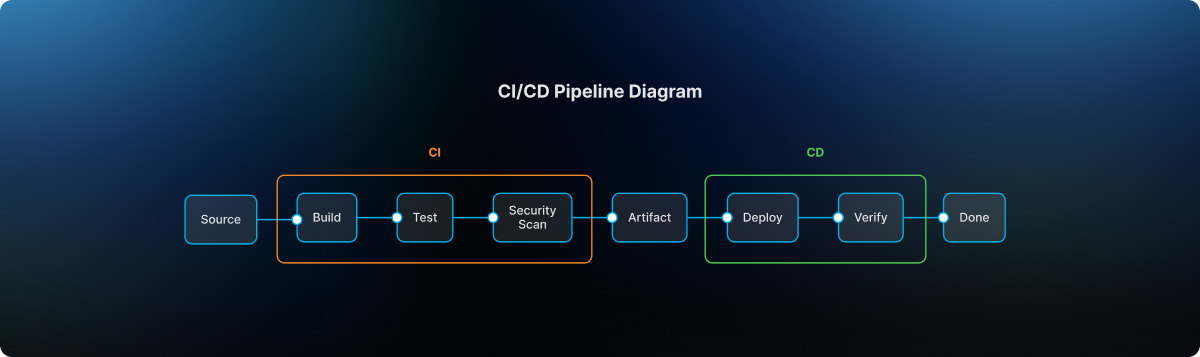
After validation, the template definition was committed to Git through a branch and promoted through a pull request. Required approvals ensured that platform engineers, security teams, and change management authorities could review the change before it reached the release line.
Once merged into main, the approved template became available for pipelines running in the production organization. Platform administrators ensured that naming conventions and version identifiers remained consistent so that teams consuming the template could easily track its evolution.
Finally, product teams created their production pipelines simply by selecting the approved template. Any attempt to bypass the template mechanism was automatically rejected by policy enforcement
The day the model proved its value
Several months after the new architecture had been implemented, an engineer attempted to modify a deployment pipeline directly inside the production organization.
Under the previous architecture, that change would have succeeded immediately.
But now the platform rejected it. The pipeline violated the OPA rule because it was not created from an approved account-level template.
Instead of modifying the pipeline directly, the engineer followed the intended process: updating the template within the non-prod organization, submitting a pull request, obtaining the necessary approvals, merging the change to Git main, and then consuming the updated template in production.
The system had behaved exactly as intended. It prevented uncontrolled change in production.
Why this model works
The architecture introduced by the large financial institution delivered several key guarantees.
Production pipelines are standardized because they originate only from platform-approved templates. Governance is preserved because Git main serves as the official release line for pipeline definitions. Auditability improves dramatically because every pipeline change can be traced back to a pull request and associated change management approval. Finally, platform administrators retain the ability to control how templates evolve and how they are consumed in production environments.
The lesson for platform teams
Pipelines are often treated as simple automation scripts.
In reality they represent critical production infrastructure.
They define how code moves through the delivery system, how security scans are executed, how compliance evidence is collected, and ultimately how deployments reach production environments. If pipeline creation is uncontrolled, the entire delivery system becomes fragile.
The financial institution solved this problem with a remarkably simple model. Pipelines are built in the non-prod staging organization. Templates are promoted through Git governance workflows. Production pipelines consume those approved templates.
Nothing more. Nothing less.
Final takeaway
Modern CI/CD platforms have dramatically accelerated the speed of software delivery.
But in regulated environments, the true achievement lies elsewhere. It lies in building a platform where developers move quickly, security remains embedded within the delivery workflow, governance is enforced automatically, and production environments remain protected from uncontrolled change.
That is not just CI/CD. That is platform engineering done right.

Introducing Zero Trust Architecture for Software Delivery
For the world’s largest financial institutions, places like Citi and National Australia Bank, shipping code fast is just part of the job. But at that scale, speed is nothing without a rock-solid security foundation. It’s the non-negotiable starting point for every release.
Most Harness users believe they are fully covered by our fine-grained Role-Based Access Control (RBAC) and Open Policy Agent (OPA). These are critical layers, but they share a common assumption: they trust the user or the process once the initial criteria are met. If you let someone control and execute a shell script, you’ve trusted them to a great extent.
But what happens when the person with the "right" permissions decides to go rogue? Or when a compromised account attempts to inject a malicious script into a trusted pipeline?
Harness is changing the security paradigm by moving beyond Policy as Code to a true Zero Trust model for your delivery infrastructure.
The Challenge: When Permissions Aren't Enough
Traditional security models focus on the "Front Door." Once an employee is authenticated and their role is verified, the system trusts their actions. In a modern CI/CD environment, this means an engineer with "Edit" and "Execute" rights can potentially run arbitrary scripts on your infrastructure.
If that employee goes rogue or their credentials are stolen, RBAC won't stop them. OPA can control whether shell scripts are allowed at all, but it often struggles to parse the intent of a custom shell script in real-time.
The reality is that verify-at-the-door is a legacy mindset. We need to verify at execution time. CI/CD platforms are a supply-chain target that are often targeted. The recent attack against the Checkmarx GitHub Action has been a painful reminder of the lesson the Solarwinds fiasco should have taught the industry.
Introducing Harness Zero Trust
Harness Zero Trust is a new architectural layer that acts as a mandatory "interruption" service at the most critical point: the Harness Delegate (our lightweight runner in your infrastructure).
Instead of the Delegate simply executing tasks authorized by the control plane, it now operates on a "Never Trust, Always Verify" basis.
How It Works: The Final Line of Defense
When Zero Trust is enabled, the Harness Delegate pauses before executing any task. It sends the full execution context to a Zero Trust Validator, a service hosted and controlled by your security team.
This context includes:
- User Identity: Who triggered the action?
- Task Specifics: Exactly what is the Delegate being asked to do?
- Script Content: The full body of any shell scripts.
- Environment Variables: The inputs and secrets being injected into the task.
The Delegate waits a moment. Only if the validator returns a "True" signal does the task proceed. If the signal is "False," the execution is killed instantly.
Why This Matters for Enterprise DevSecOps
By moving validation to the Delegate level, we provide a "Last Line of Defense" that hits several key enterprise requirements:
- Rogue Employee Protection: Even if a user has the rights to run a pipeline, your security service can flag suspicious patterns (like a script attempting to delete a production database or exfiltrate data) and stop it before it starts.
- Architectural Superiority: While competitors struggle with stability and baseline security, Harness is doubling down on a hardened architecture. RBAC protects the door; OPA governs the "what"; and Zero Trust validates the "how."
- Custom Judgement: Because Harness sends the complete task details, you can point this validator at a customer algorithm or an AI-powered security tool to judge the "safety" of scripts in real-time. Essentially, you are peer-reviewing every line of automation at execution time.
The Takeaway
We built this capability alongside some of the world's most regulated institutions to ensure it doesn't become a bottleneck. It’s designed to be a silent guardian. It shuts down the 1% of rogue actions while the other 99% of your engineers continue to innovate at high velocity.
The bottom line: at Harness, we believe that the promise of AI-accelerated coding must be met with an equally advanced delivery safety net. We’re building out that safety net every day. Zero Trust is the next piece.

Regression Testing in CI/CD: Deliver Faster Without the Fear
A financial services company ships code to production 47 times per day across 200+ microservices. Their secret isn't running fewer tests; it's running the right tests at the right time.
Modern regression testing must evolve beyond brittle test suites that break with every change. It requires intelligent test selection, process parallelization, flaky test detection, and governance that scales with your services.
Harness Continuous Integration brings these capabilities together: using machine learning to detect deployment anomalies and automatically roll back failures before they impact customers. This framework covers definitions, automation patterns, and scale strategies that turn regression testing into an operational advantage. Ready to deliver faster without fear?
What Is Regression Testing? (A Real-world Example)
Managing updates across hundreds of services makes regression testing a daily reality, not just a testing concept. Regression testing in CI/CD ensures that new code changes don’t break existing functionality as teams ship faster and more frequently. In modern microservices environments, intelligent regression testing is the difference between confident daily releases and constant production risk.
- The Simple Definition: Regression testing is the practice of re-running existing tests after code changes to ensure nothing that previously worked is unintentionally broken. Instead of validating new features, it safeguards stable functionality across your application.
- When Small Changes Create Big Problems: Even “low-risk” tweaks, like changing a payments API header, can silently break downstream jobs and critical flows like checkout. Regression tests catch these integration issues before production, protecting revenue and user experience.
- How This Fits Into Modern CI/CD: In modern CI/CD, regression tests run continuously on pull requests, main branch merges, and staged rollouts like canaries. In each case, the tests ensure the application continues to work as expected.
Regression Testing vs. Retesting
These terms often get used interchangeably, but they serve different purposes in your pipeline. Understanding the distinction helps you avoid both redundant test runs and dangerous coverage gaps.
- Retesting validates a specific fix. When a bug is found and patched, you retest that exact functionality to confirm the fix works. It's narrow and targeted.
- Regression testing protects everything else. After that fix goes in, regression tests verify the change didn't break existing functionality across dependent services.
In practice, you run them sequentially: retest the fix first, then run regression suites scoped to the affected services. For microservices environments with hundreds of interdependent services, this sequencing prevents cascade failures without creating deployment bottlenecks.
The challenge is deciding which regression tests to run. A small change to one service might affect three downstream dependencies, or even thirty. This is where governance rules help. You can set policies that automatically trigger retests on pull requests and broader regression suites at pre-production gates, scoping coverage based on change impact analysis rather than gut feel.
To summarize, Regression testing checks that existing functionality still works after a change. Retesting verifies that a specific bug fix works as intended. Both are essential, but they serve different purposes in CI/CD pipelines.
Where Regression Fits in the CI/CD Pipeline
The regression testing process works best when it matches your delivery cadence and risk tolerance. Smart timing prevents bottlenecks while catching regressions before they reach users.
- Run targeted regression subsets on every pull request to catch breaking changes within developer workflows. Keep these under 10 minutes for fast feedback.
- Execute broader suites on main branch merges using parallelization and cloud resources to compress full regression cycles from hours to minutes.
- Gate pre-production deployments with end-to-end smoke tests and contract validation before progressive rollout begins.
- Monitor live metrics during canary releases and feature experiments to detect regressions under real traffic patterns that test environments can't replicate.
- Combine synthetic monitoring with AI-powered automated rollback triggers to validate actual user impact and revert within seconds when thresholds are breached.
This layered approach balances speed with safety. Developers get immediate feedback while production deployments include comprehensive verification. Next, we'll explore why this structured approach becomes even more critical in microservices environments where a single change can cascade across dozens of services.
Why Regression Testing Matters for Microservices, Risk, and Compliance
Modern enterprises managing hundreds of microservices face three critical challenges: changes that cascade across dependent systems, regulatory requirements demanding complete audit trails, and operational pressure to maintain uptime while accelerating delivery.
Microservices Amplify Blast Radius Across Dependent Services
A single API change can break dozens of downstream services you didn't know depended on it.
- Cascade failures are the norm, not the exception. A payment schema change that seems harmless in isolation can break reconciliation jobs, notification services, and reporting pipelines across 47 dependent services. Resilience or “Chaos” testing can help you assess your exposure to cascading failures.
- Loosely coupled doesn't mean independent. NIST guidance confirms that cloud-native architectures consist of multiple components where individual changes can have system-wide impact.
- Higher deployment frequency requires higher automation. Research demonstrates that microservices require automated testing integration into CD pipelines to maintain reliability at scale.
Regulated Environments Demand Complete Audit Trails
Financial services, healthcare, and government sectors require documented proof that tests were executed and passed for every promotion.
- Compliance requires traceability. The DoD Cyber DT&E Guidebook mandates traceable test evidence for continuous authorization, noting that minor software changes can significantly impact system risk posture.
- Policy-as-code turns testing into a compliance enabler. Harness governance features enforce required test gates and generate comprehensive audit logs of every approval and pipeline execution.
- Auditors expect timestamped evidence on demand. Automated frameworks with audit logging eliminate scrambling when validation requests arrive.
Pre-Production Detection Reduces Operational Costs and MTTR
Catching regressions before deployment saves exponentially more than fixing them during peak traffic.
- The math is simple. A failed regression test costs developer time; a production incident costs customer trust, revenue, and weekend firefighting.
- Automated gates prevent breaks from reaching users. Research confirms that regression testing in pipelines stops new changes from introducing functionality failures.
- AI verification adds a final safety net. Harness detects anomalies post-deployment and triggers automated rollbacks within seconds, eliminating expensive emergency responses.
With the stakes clear, the next question is which techniques to apply.
Types of Regression Testing Techniques You'll Actually Use
Once you've established where regression testing fits in your pipeline, the next question is which techniques to apply. Modern CI/CD demands regression testing that balances thoroughness with velocity. The most effective techniques fall into three categories: selective execution, integration safety, and production validation.
Types of Regression Testing Techniques You'll Actually Use
Once you've established where regression testing fits in your pipeline, the next question is which techniques to apply. Modern CI/CD demands regression testing that balances thoroughness with velocity. The most effective techniques fall into three categories: selective execution, integration safety, and production validation—with a few pragmatic variants you’ll use day-to-day.
- Full regression suites rerun your critical end-to-end and high-value scenarios before major releases or architectural changes. They’re slower, but essential for high‑risk changes and compliance-heavy environments.
- Smoke and sanity regression focus on a small, fast set of tests that validate core flows (login, checkout, core APIs) on every commit or deployment. These suites act as your “always on” safety net.
- Unit-level regression runs targeted unit tests around recently changed modules. This is your fastest feedback loop, catching logic regressions before they ever hit cross-service integration or UI layers.
- Selective regression and test impact analysis run only the suites that exercise changed code paths, using dependency mapping to cut execution time without sacrificing confidence.
- Contract testing enforces backward compatibility through consumer-driven contracts like Pact, preventing integration failures between teams and services.
- API/UI regression testing locks in behavior at the interaction layer—REST, GraphQL, or UI flows—so refactors behind the scenes don’t break user-visible behavior.
- Performance and scalability regression ensure that latency, throughput, and resource usage don’t degrade between releases, especially for high-traffic or revenue-critical paths.
- Progressive delivery verification combines canary deployments with real-time metrics and error signals to surface regressions under actual traffic, with automated halt/rollback when thresholds are breached.
These approaches work because they target specific failure modes. Smart selection outperforms broad coverage when you need both reliability and rapid feedback.
How to Automate Regression Testing Across Your Pipeline
Managing regression testing across 200+ microservices doesn't require days of bespoke pipeline creation. Harness Continuous Integration provides the building blocks to transform testing from a coordination nightmare into an intelligent safety net that scales with your architecture.
Step 1: Generate pipelines with context-aware AI. Start by letting Harness AI build your pipelines based on industry best practices and the standards within your organization. The approach is interactive, and you can refine the pipelines with Harness as your guide. Ensure that the standard scanners are run.
Step 2: Codify golden paths with reusable templates. Create Harness pipeline templates that define when and how regression tests execute across your service ecosystem. These become standardized workflows embedding testing best practices while giving developers guided autonomy. When security policies change, update a single template and watch it propagate to all pipelines automatically.
Step 3: Enforce governance with Policy as Code. Use OPA policies in Harness to enforce minimum coverage thresholds and required approvals before production promotions. This ensures every service meets your regression standards without manual oversight.
With automation in place, the next step is avoiding the pitfalls that derail even well-designed pipelines.
Best Practices and Common Challenges (And How to Fix Them)
Regression testing breaks down when flaky tests erode trust and slow suites block every pull request. These best practices focus on governance, speed optimization, and data stability.
- Quarantine flaky tests automatically using policy enforcement and require test owners before suite re-entry. Research shows flaky tests reproduce only 17-43% of the time, making governance more effective than debugging individual failures.
- Parallelize and shard test execution across multiple agents to keep PR feedback under 5 minutes.
- Apply test impact analysis to run only tests affected by code changes, reducing unnecessary execution.
- Provision ephemeral test environments with seeded datasets to eliminate data drift between runs.
- Use contract-backed mocks for external dependencies to ensure consistent test behavior.
- Add AI-powered verification as a final backstop to catch regressions that slip past test suites.
Turn Regression Testing Into a Safety Net, Not a Speed Bump
Regression testing in CI/CD enables fast, confident delivery when it’s selective, automated, and governed by policy. Regression testing transforms from a release bottleneck into an automated protection layer when you apply the right strategies. Selective test prioritization, automated regression gates, and policy-backed governance create confidence without sacrificing speed.
The future belongs to organizations that make regression testing intelligent and seamless. When regression testing becomes part of your deployment workflow rather than an afterthought, shipping daily across hundreds of services becomes the norm.
Ready to see how context-aware AI, OPA policies, and automated test intelligence can accelerate your releases while maintaining enterprise governance? Explore Harness Continuous Integration and discover how leading teams turn regression testing into their competitive advantage.
FAQ: Practical Answers for Regression Testing in CI/CD
These practical answers address timing, strategy, and operational decisions platform engineers encounter when implementing regression testing at scale.
When should regression tests run in a CI/CD pipeline?
Run targeted regression subsets on every pull request for fast feedback. Execute broader suites on the main branch merges with parallelization. Schedule comprehensive regression testing before production deployments, then use core end-to-end tests as synthetic testing during canary rollouts to catch issues under live traffic.
How do we differentiate regression testing from retesting in practice?
Retesting validates a specific bug fix — did the payment timeout issue get resolved? Regression testing ensures that the fix doesn’t break related functionality like order processing or inventory updates. Run retests first, then targeted regression suites scoped to affected services.
How much regression coverage is enough for production?
There's no universal number. Coverage requirements depend on risk tolerance, service criticality, and regulatory context. Focus on covering critical user paths and high-risk integration points rather than chasing percentage targets. Use policy-as-code to enforce minimum thresholds where compliance requires it, and supplement test coverage with AI-powered deployment verification to catch regressions that test suites miss.
Should we run full regression suites on every commit?
No. Full regression on every commit creates bottlenecks. Use change-based test selection to run only tests affected by code modifications. Reserve comprehensive suites for nightly runs or pre-release gates. This approach maintains confidence while preserving velocity across your enterprise delivery pipelines.
What's the best way to handle flaky tests without blocking releases?
Quarantine flaky tests immediately, rather than letting them block pipelines. Tag unstable tests, move them to separate jobs, and set clear SLAs for fixes. Use failure strategies like retry logic and conditional execution to handle intermittent issues while maintaining deployment flow.
How do we maintain regression test quality at scale?
Treat test code with the same rigor as application code. That means version control, code reviews, and regular cleanup of obsolete tests. Use policy-as-code to enforce coverage thresholds across teams, and leverage pipeline templates to standardize how regression suites execute across your service portfolio.