Follow a Kubernetes deployment failure from initial diagnosis to root cause, uncovering pipeline issues, missing database dependencies, and schema errors.

TL;DR
- Diagnose Kubernetes deployment failures by analyzing pipeline logs, identifying configuration issues, and tracing errors to their root causes.
- Use AI-assisted debugging to resolve pipeline configuration problems and identify missing dependencies such as database services and application schemas.
- Improve deployment reliability with preflight checks, pod health verification, and database schema validation to catch failures before they impact deployments.
When a Kubernetes deploy fails in my pipeline, the error usually tells me that something broke, not why. Last week mine went red with just this line:
error: deployment "bbqbookeeper-web-good" exceeded its progress deadlineBy default, Kubernetes marks a Deployment's rollout as stalled if it makes no progress for 600 seconds (progressDeadlineSeconds). The deployment controller keeps retrying, but kubectl rollout status reports a failure. That tells me the rollout stalled, not why the pods weren't becoming ready. Finding the why is the part that eats an afternoon: you re-run the pipeline, read logs, guess, and re-run again.
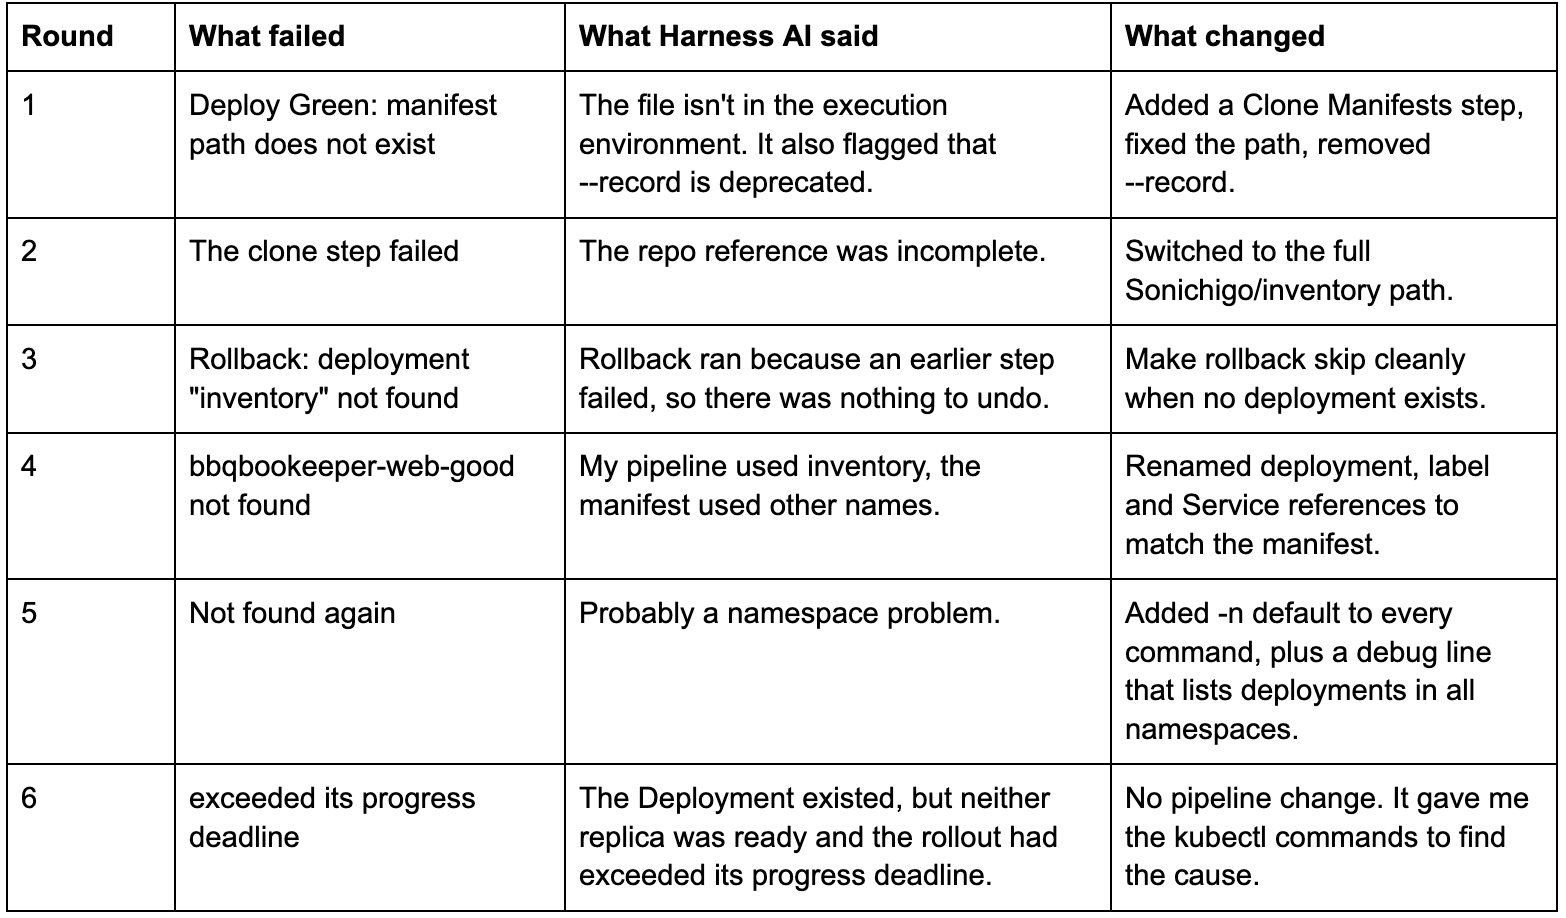
This post shows how I got from that one line to the root cause in a single session with Harness AI Chat, the assistant built into the Harness UI. Across six exchanges, the Harness agent helped me fix five pipeline configuration problems and then pointed me at the pods. Pod logs, with restart counts around 195, revealed two missing pieces: Postgres itself and the application schema.
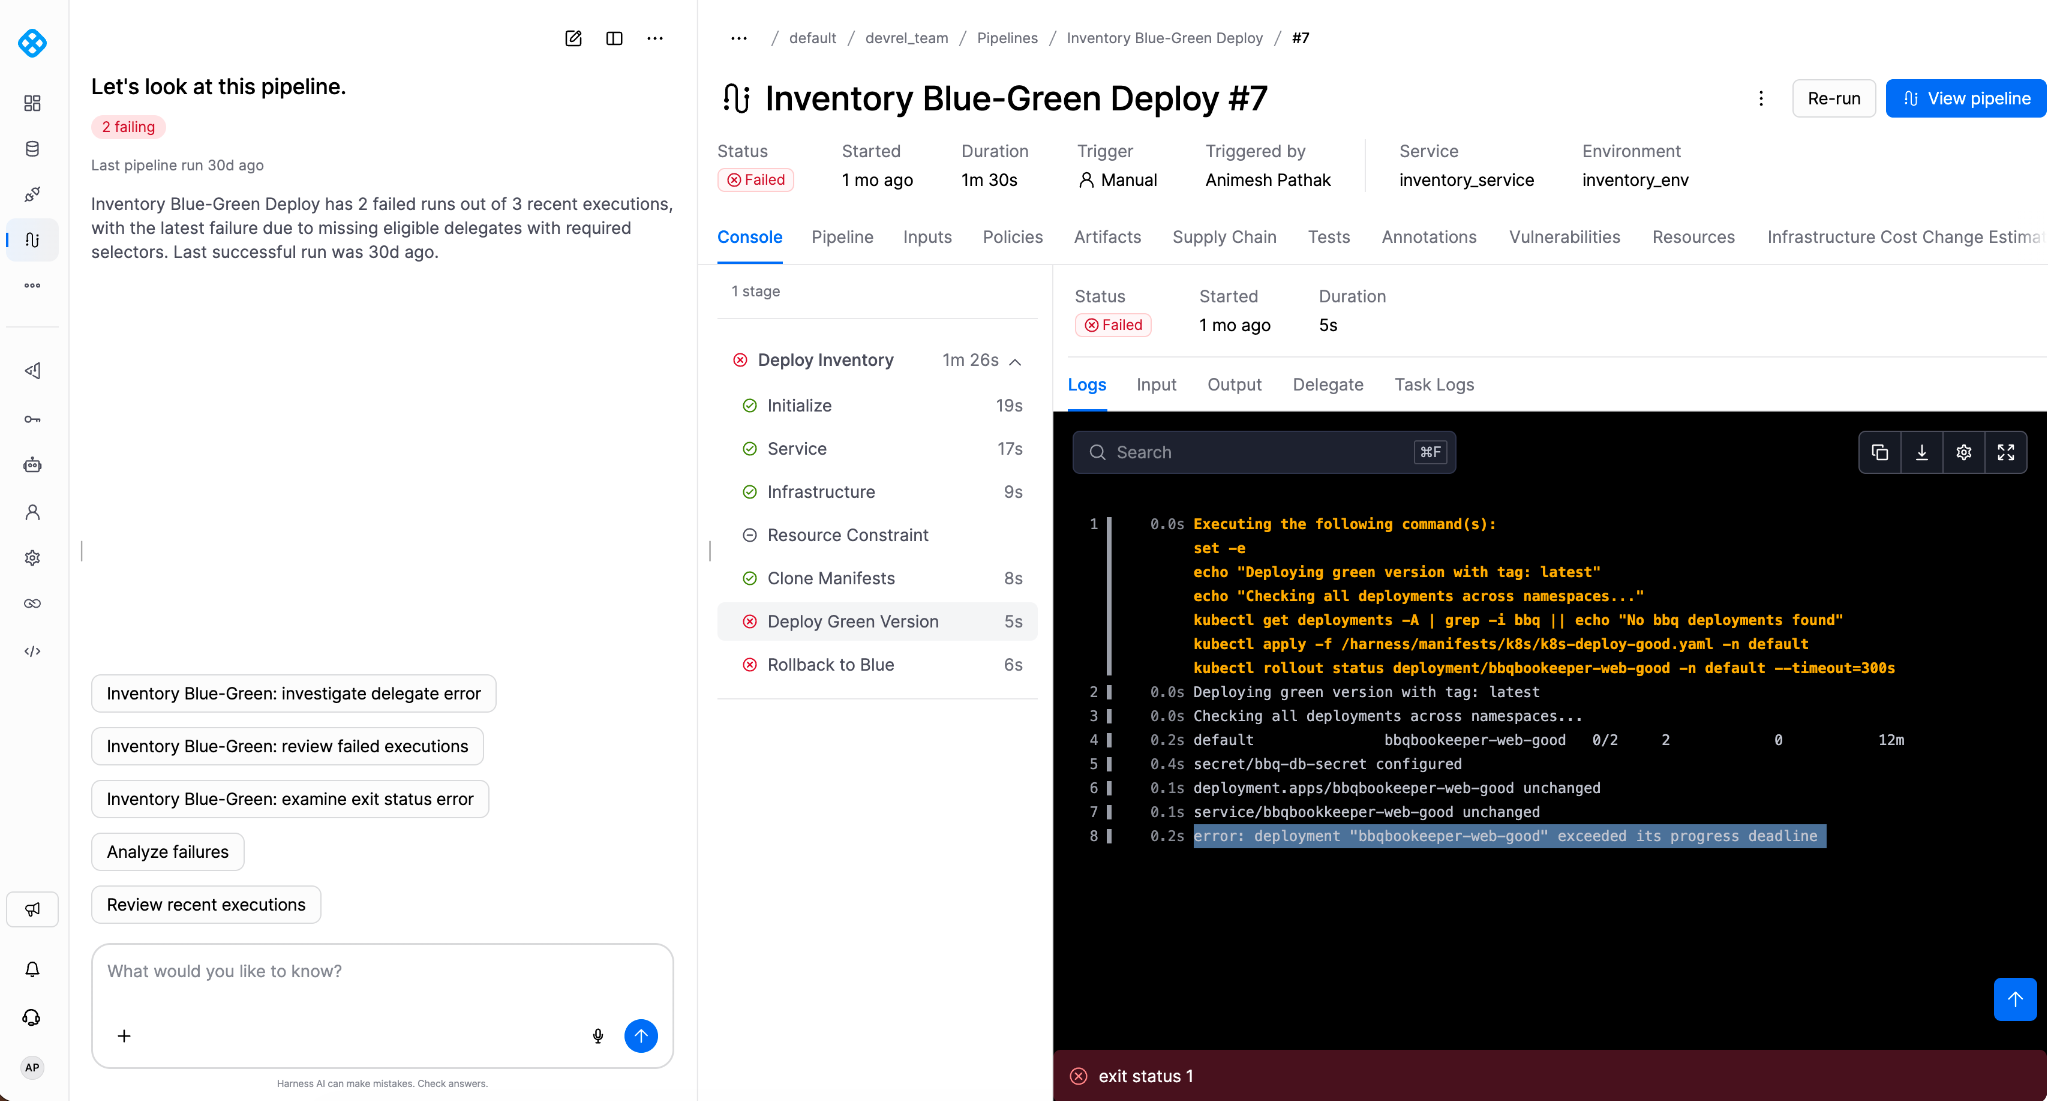
In the Console tab of Run #7, the left panel lists the stage's steps and the log on the right belongs to the Deploy Green Version. The run took 1m 30s overall, but that step failed after just five seconds. An earlier run in the same debugging session had already hit the progress deadline. Because this run reapplied an unchanged Deployment, kubectl rollout status reported the existing failure immediately. The debug output shows a 12-minute-old Deployment with 0 of 2 replicas ready.
Why I cared about the "why"
AI makes writing code fast. In my experience, the slow and risky part is everything after the commit: deploy, verify, roll back. A failed deployment is cheap in a demo and expensive in production, so I care less about a tool that writes YAML and more about one that tells me why a run failed and what to check next.
The setup
BBQBookkeeper is a small demo app: a Go API, Postgres, and a load generator sidecar. I run it with the Harness Software Delivery Agent. A pipeline is the ordered set of steps that takes code to a running cluster. Mine clones the manifests, deploys them with kubectl, verifies the pods, and swaps traffic. It runs on a local minikube cluster through a Harness delegate, the agent that runs pipeline steps inside your cluster.
The repo has the app Dockerfile, the Kubernetes manifests in k8s/, a postgres.yaml, and a database/ folder with the schema changes. To follow along, clone or fork it. For the pipeline in Step 4 you also need a delegate on your cluster and a GitHub connector (a saved, authenticated link from Harness to an outside system) in your Harness account, so the pipeline can clone your fork. Harness AI Chat also has to be enabled for your account (the Harness AI overview linked at the end explains where).
A quick note on words: a stage (here, Deploy Inventory) is a major phase of a pipeline, and it holds steps (Clone Manifests, Deploy Green Version, and so on), the individual commands that run inside it. In the run view, the left panel lists the stage and expands it to show its steps.
Six rounds with Harness AI Chat
Each of the six rounds was a different failure, not a retry of the same fix. Each exchange addressed a configuration issue or identified the next diagnostic step. I kept pasting the next failure into the same chat.
In Round 6, it told me to stop editing the pipeline and look at the pods. To get this view, select the failed step in the Console tab, open its logs and click the Harness AI dialog. In the panel on the left, the Root Cause paragraph is the part that sent me to the pods.
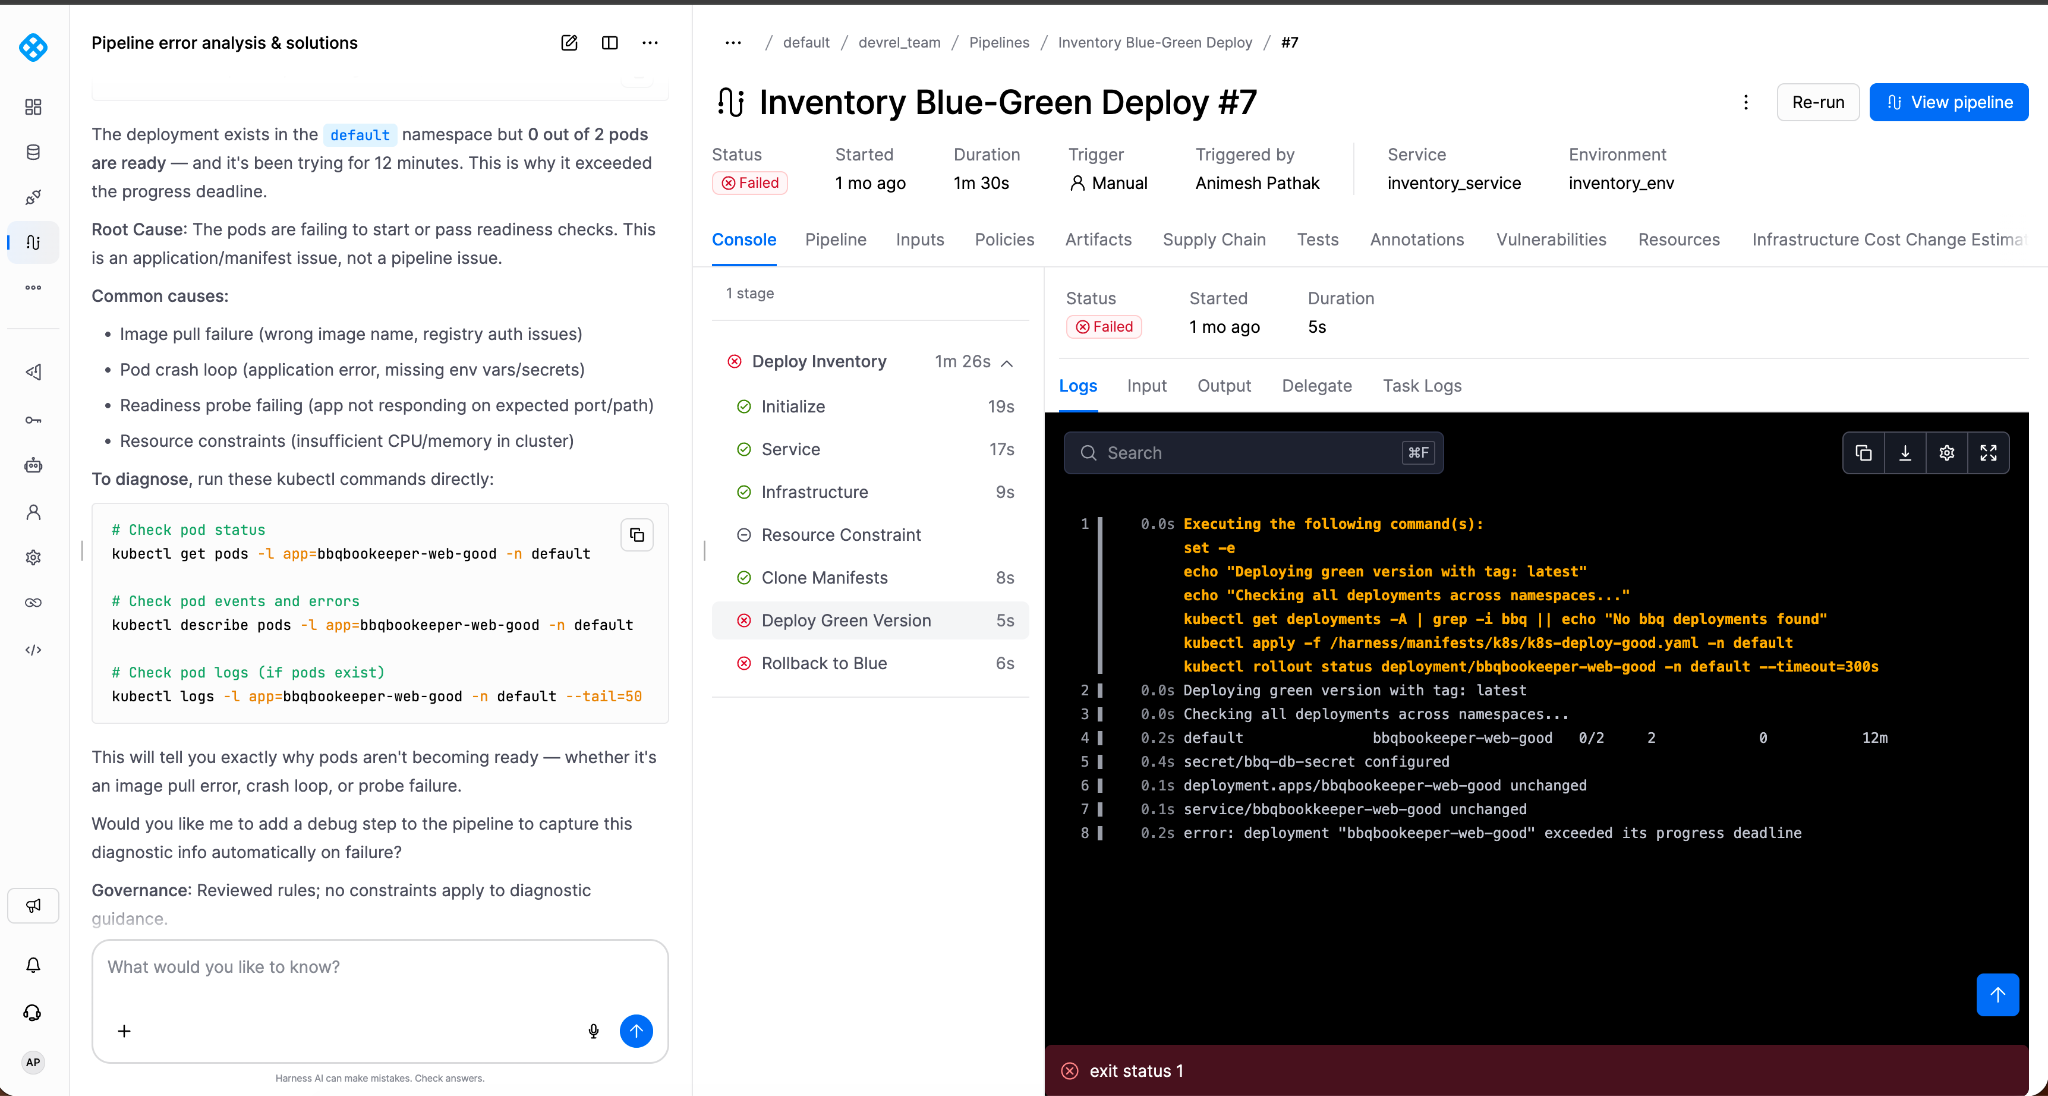
What the deployment error didn't reveal
In that same debugging session, I checked the pod status, events, and logs. The application containers were crash-looping, with restart counts around 195. The logs said:
DB not ready: lookup postgres-dbops ... server misbehavingThe log showed that the app couldn't resolve its database hostname. Because the startup waits for a database connection, the HTTP server never opened port 8080. Readiness checks failed, leaving the pods unready; liveness checks also failed and triggered container restarts. I then checked the cluster and found no Postgres pods in any namespace. I couldn't establish when Postgres had disappeared; a minikube reset was only a hypothesis.
I redeployed Postgres and both application pods became ready within seconds. Then the logs filled up again, this time with relation "inventory" does not exist. The new database was empty. In one minute, the logs showed 1,734 error lines because the load generator kept hitting endpoints whose tables weren't there.
The schema lives in a changelog in the repo's database/ folder. I applied it with the good context, which creates the tables plus 10k rows and indexes. After that, the pipeline went through.
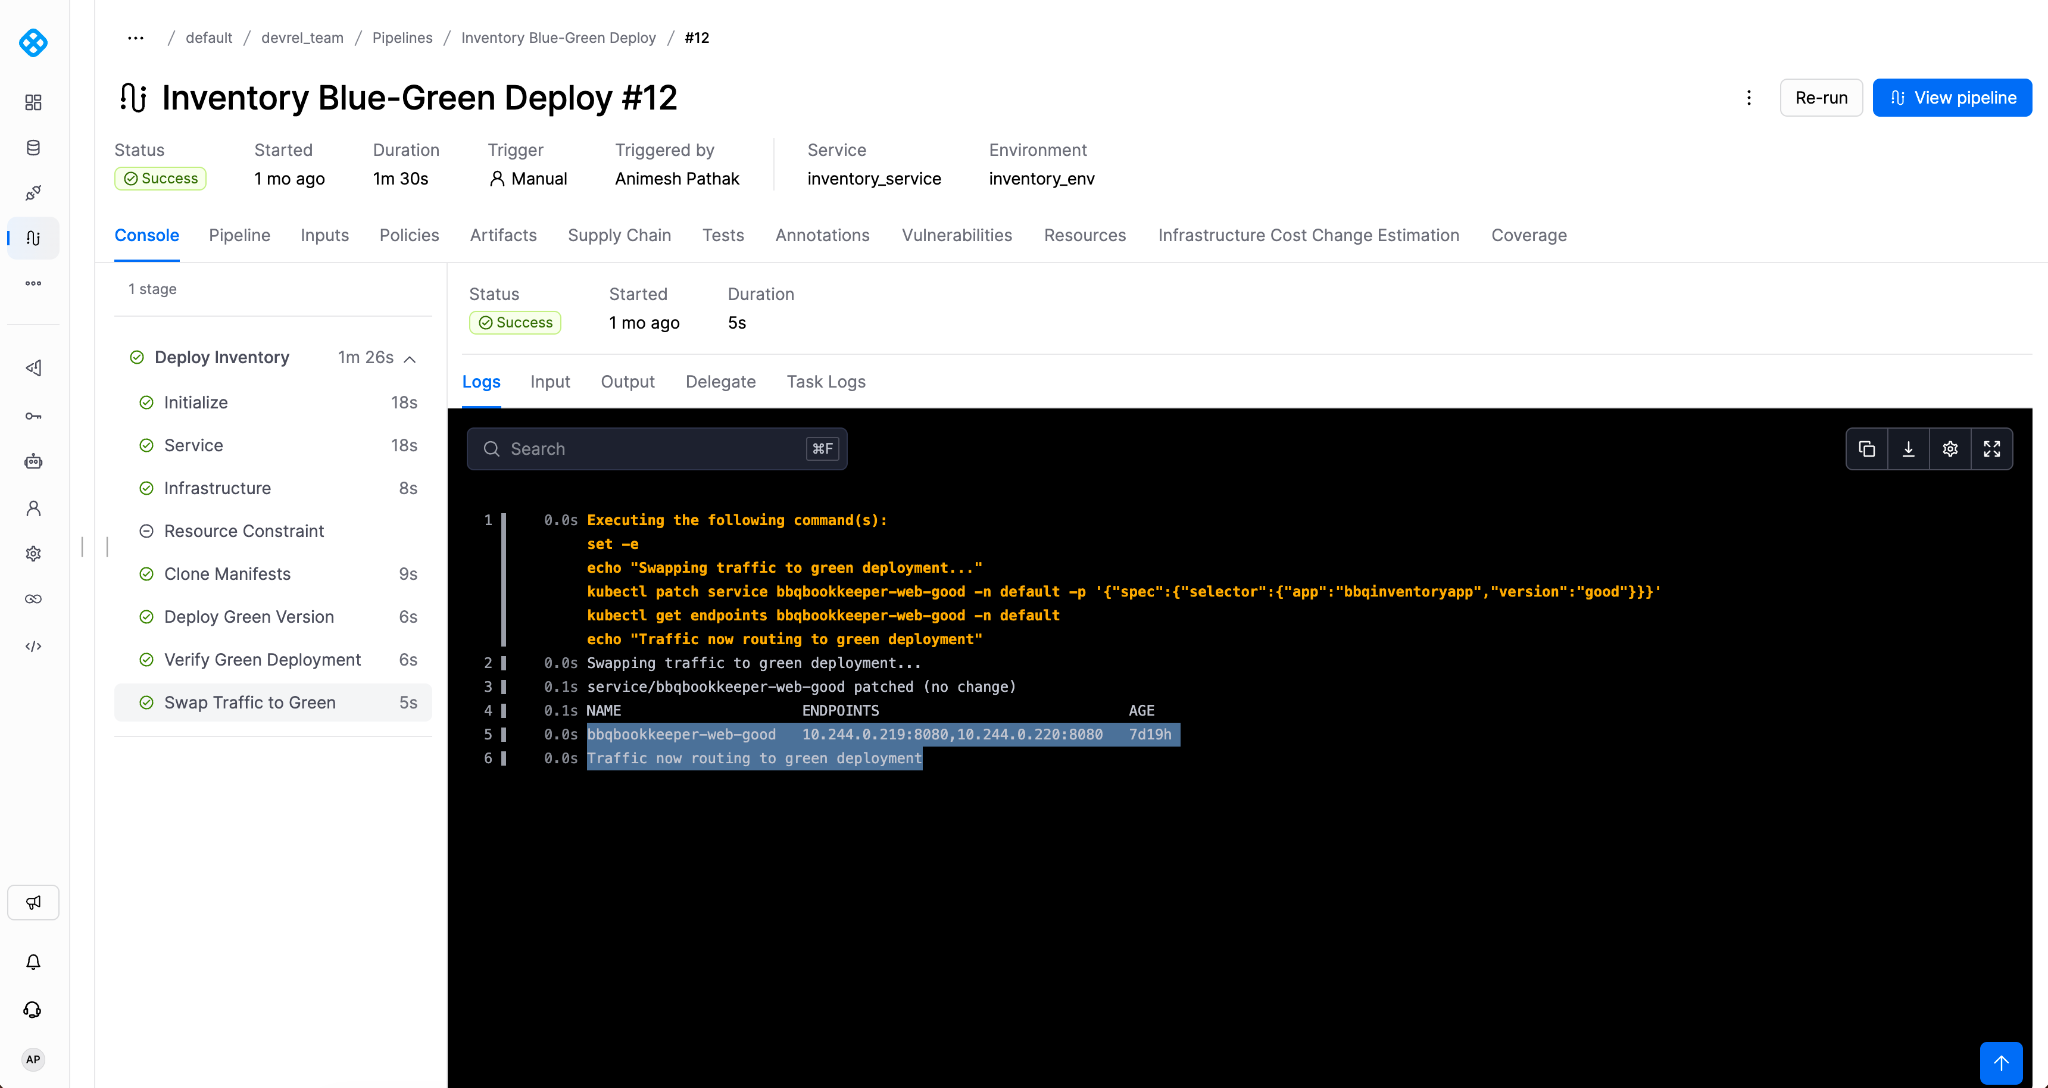
Run #12 of the same pipeline after the fixes: every step succeeds, including Swap Traffic to Green (right).
Try it yourself
This reproduces the same failure on a local cluster such as minikube or kind. The image is public, and the credentials are demo only. Execute this walkthrough exclusively on an isolated local cluster paired with a dedicated testing database. Applying the changelog deletes and reseeds data in the demo tables, so avoid running it against a shared environment or production instance.
Step 1: Deploy the app with no database
Save this as app.yaml. It is trimmed from the repo manifest: no sidecar, and a ClusterIP Service. The Deployment is named bbqbookeeper-web-good and the Service bbqbookkeeper-web-good, as in the repo, so copy the names exactly.
apiVersion: v1
kind: Secret
metadata:
  name: bbq-db-secret
  namespace: default
type: Opaque
stringData:
  db-init-user: "user"
  db-init-pass: "password"
  db-user: "user"
  db-password: "password"
---
apiVersion: apps/v1
kind: Deployment
metadata:
  name: bbqbookeeper-web-good
  namespace: default
  labels: { app: bbqinventoryapp, version: good }
spec:
  replicas: 2
  progressDeadlineSeconds: 120   # default is 600; shortened so you don't wait ten minutes
  selector:
    matchLabels: { app: bbqinventoryapp, version: good }
  template:
    metadata:
      labels: { app: bbqinventoryapp, version: good }
    spec:
      containers:
        - name: bbqinventoryapp
          image: ghcr.io/sonichigo/bbqbookkeeper:good
          imagePullPolicy: Always
          ports:
            - containerPort: 8080
          env:
            - name: DB_SERVER
              value: "postgres-dbops"
            - name: DB_INIT_USER
              valueFrom: { secretKeyRef: { name: bbq-db-secret, key: db-init-user } }
            - name: DB_INIT_PASS
              valueFrom: { secretKeyRef: { name: bbq-db-secret, key: db-init-pass } }
            - name: DB_USER
              valueFrom: { secretKeyRef: { name: bbq-db-secret, key: db-user } }
            - name: DB_PASSWORD
              valueFrom: { secretKeyRef: { name: bbq-db-secret, key: db-password } }
          readinessProbe:
            httpGet: { path: /health, port: 8080 }
            initialDelaySeconds: 5
            periodSeconds: 3
          livenessProbe:
            httpGet: { path: /health, port: 8080 }
            initialDelaySeconds: 10
            periodSeconds: 5
---
apiVersion: v1
kind: Service
metadata:
  name: bbqbookkeeper-web-good
  namespace: default
spec:
  selector: { app: bbqinventoryapp, version: good }
  ports:
    - port: 8080
      targetPort: 8080
Now, when we apply our changes :
kubectl apply -f app.yaml
kubectl rollout status deployment/bbqbookeeper-web-good -n default
After two minutes, you get the “exceeded its progress deadline” error. Now debug it:
kubectl get pods -l app=bbqinventoryapp -n default
kubectl logs -l app=bbqinventoryapp -n default --tail=20
The exact log line depends on your cluster's DNS. Either way, the app can't find postgres-dbops.
Step 2: Add the database
Save this as postgres.yaml:
apiVersion: v1
kind: PersistentVolumeClaim
metadata:
  name: postgres-dbops-pvc
  namespace: default
spec:
  accessModes: [ReadWriteOnce]
  resources:
    requests:
      storage: 1Gi
---
apiVersion: apps/v1
kind: Deployment
metadata:
  name: postgres-dbops
  namespace: default
spec:
  replicas: 1
  selector:
    matchLabels: { app: postgres-dbops }
  template:
    metadata:
      labels: { app: postgres-dbops }
    spec:
      containers:
        - name: postgres
          image: postgres:16-alpine
          env:
            - { name: POSTGRES_USER, value: "user" }
            - { name: POSTGRES_PASSWORD, value: "password" }
            - { name: POSTGRES_DB, value: "mydatabase" }
            - { name: PGDATA, value: "/var/lib/postgresql/data/pgdata" }
          ports:
            - containerPort: 5432
          readinessProbe:
            exec:
              command: ["pg_isready", "-U", "user", "-d", "mydatabase"]
            periodSeconds: 5
          volumeMounts:
            - { name: data, mountPath: /var/lib/postgresql/data }
      volumes:
        - name: data
          persistentVolumeClaim:
            claimName: postgres-dbops-pvc
---
apiVersion: v1
kind: Service
metadata:
  name: postgres-dbops
  namespace: default
spec:
  selector: { app: postgres-dbops }
  ports:
    - port: 5432
And now once the file is saved, let's apply deploy our postgres database:
kubectl apply -f postgres.yaml
kubectl rollout status deployment/postgres-dbops -n default
kubectl rollout restart deployment/bbqbookeeper-web-good -n default
kubectl get pods -l app=bbqinventoryapp -n default
kubectl logs -l app=bbqinventoryapp -n default --tail=5
Once the rollout completes, both application replicas are ready, with each pod showing 1/1. Database connectivity now works, but the tables are still missing. Send a request to “/inventory”, then inspect the application logs to see the missing-table error.
Step 3: Load the schema
The app's tables come from the changelog in the repo's database/ folder. This step needs the Liquibase on your machine or you can Database DevOps within Harness Platform itself. Forward the in-cluster Postgres to your machine and apply "database/changelog-master.yaml":
kubectl port-forward svc/postgres-dbops 5432:5432 -n default &
sleep 3
cd database
liquibase \
  --url=jdbc:postgresql://localhost:5432/mydatabase \
  --username=user --password=password \
  --changelog-file=changelog-master.yaml \
  --contexts=good \
  update
kill %1
--contexts=good selects the good variant of the schema: the tables plus 10k rows and indexes. kill %1 stops the port-forward and only works in an interactive shell. In a script, save the PID with $! and kill that instead. The sleep 3 line gives the port-forward time to open before Liquibase connects. Then check the logs again:
kubectl logs -l app=bbqinventoryapp -n default --since=30s --tail=-1 | grep -ci errorThe count should drop to 0 once the 30-second window has passed, with no restart needed.
Step 4: Reproduce the pipeline failures
The repo has two pipelines in the pipelines folder. inventory-blue-green-initial.yaml is the version I started with, reconstructed from the failing run. To reproduce Round 1, create a pipeline in your project, switch the editor to YAML view and paste the contents of that file. The other five failures appeared as I fixed each in turn and have no file of their own; the final file already includes those fixes. inventory-blue-green-final.yaml is where it ended up. In either file, replace these values with your own:
- <your_delegate>: the name of your Harness delegate
- <your_docker_connector>: a Docker registry connector, a saved link to your registry, used to pull the alpine/k8s image, which bundles kubectl
- <your_github_connector>: a GitHub connector, used by the final pipeline
- <your_github_user>: your GitHub username, so the clone step pulls your fork
- inventory_service, inventory_env and inventory_k8s_infra: the service, environment and infrastructure definition the stage deploys to. Create them in your project first, or the pipeline won't validate. The service is what you deploy, the environment is where it goes, and the infrastructure definition points that environment at your cluster.
- arch: arm64: this is what my setup uses. Set it to match the machine your delegate runs on.
The final version adds a clone step, the right names and labels, and two checks that act as gates. The preflight step confirms the database Service has a ready endpoint before anything deploys, so a missing database fails in seconds instead of after a ten-minute timeout. The verify step then fails if the app is running but its logs show missing tables. One caveat on the name: this is a simplified blue-green. It deploys only the good version, the swap step patches the Service to the selector it already has, and the rollback no longer switches back to a blue version.
What I'd do differently next time
- Paste everything: the YAML, the step output and the repo link. Each answer got sharper as I added context.
- Fix one failure at a time. Fix it, re-run, paste the next error.
- When the pipeline is clean and the deploy still fails, stop editing YAML and go to the pods. kubectl describe and kubectl logs found the real cause in two commands.
- Check the data layer too. Readiness is only as strong as its check. This app's /health endpoint verifies database connectivity, not whether the required tables exist.
To try this on your own failures, enable the Harness AI setting in your account settings then open a failed step's logs and click the Harness AI dialog.
Related
Docs and changelog entries for the same debugging flow: how to turn on Harness AI, what step analysis reads in a failed step, and what shipped recently.
- Harness AI overview: how to enable it and what it covers
- Harness AI Release: recent feature additions and product capabilities
- Step analysis with AI: what the agent reads when you analyze a failed step
- Harness release notes: platform changelog entries
- Harness AI posts: more write-ups on Harness AI