Harness AgentTrace unifies AI observability, evaluation, and guardrails to detect failures, improve quality, and secure AI agents in production.

- Agents fail silently with no errors, no bad status codes, so standard observability misses them. AgentTrace observes, evaluates, and acts on agents in one pipeline.
- Production failures can be one-click exported into eval cases, closing the loop between real failures and CI testing.
- Core layers (harness-sdk, harness-evals) are open-sourced under Apache 2.0 and work with any OTel backend, no Harness platform required.
AI agents fail differently from the software we spent the last two decades learning to monitor. We hear some version of the same story from teams shipping agents to production: an agent starts producing wrong answers. Not obviously broken: confident, well-formatted, plausible wrong. The logs are clean, latency looks healthy, and error rates sit at zero. Nothing flags a problem. A user eventually does.
None of the standard tooling was built to catch this. Our observability stack assumes misbehaving software leaves evidence: an exception, a timeout, a bad status code. Agents break that assumption: a hallucination returns HTTP 200, and a run that took fourteen needless tool calls looks identical to a clean one. A wave of LLM-observability tools has grown up to help, but almost all of it stops at observing, it shows you what the agent did, not whether it was any good, and they can't step in while a run is going wrong.
Closing that gap is the idea behind AgentTrace. It isn't a product you adopt; it's the framework Harness uses internally to observe, evaluate, and govern the AI agents across our own platform. It runs as a single pipeline: collect, filter, evaluate, act, so the system doesn't just record what an agent did; it can score whether the work was any good and intervene when it isn't. Today, we're describing how the framework works, and open-sourcing the two layers any team can run on their own stack — harness-sdk and harness-evals, under Apache 2.0.
Why observing isn't enough
Harness AgentTrace is a framework used by Harness to observe, evaluate, and govern AI agents by connecting production monitoring with evaluation metrics. It functions by allowing production failures to be converted into regression test cases, effectively closing the loop between identifying agent errors and preventing them in future releases.
The three gaps make plain tracing insufficient for agents.
1. It doesn't score quality. A distributed trace tells you an LLM call took 340ms and returned 200. It can't tell you whether the response was grounded in the context provided, whether the agent chose the right tools in the right order, or whether a correct answer came through a fragile path that breaks on the next input. Quality is invisible to timing and status codes.
2. The unit of work isn't a request. A microservice trace ends when the request returns. An agent only makes sense across two levels: a run — every model call, tool call, and state transition in a single execution — and a session — every run in one user interaction, so you can see behavior evolve or degrade across turns. Traditional tracing gives you neither.
3. Observing is passive. Even when tracing surfaces a bad run, it can only tell you after the fact. It has no way to intervene — to block a runaway tool call, cap a request about to blow a budget, or redirect a prompt headed somewhere it shouldn't. Watching and acting are different jobs, and agents in production need both.
So the requirement isn't “better tracing.” It's a framework that observes, judges, and acts — and connects them, so what you learn from one run shapes the next. That's what AgentTrace is.
How it's built: one framework, three tiers, two planes
AgentTrace is one pipeline of four stages, deployed across three tiers, connected by two planes. Start with the whole picture:
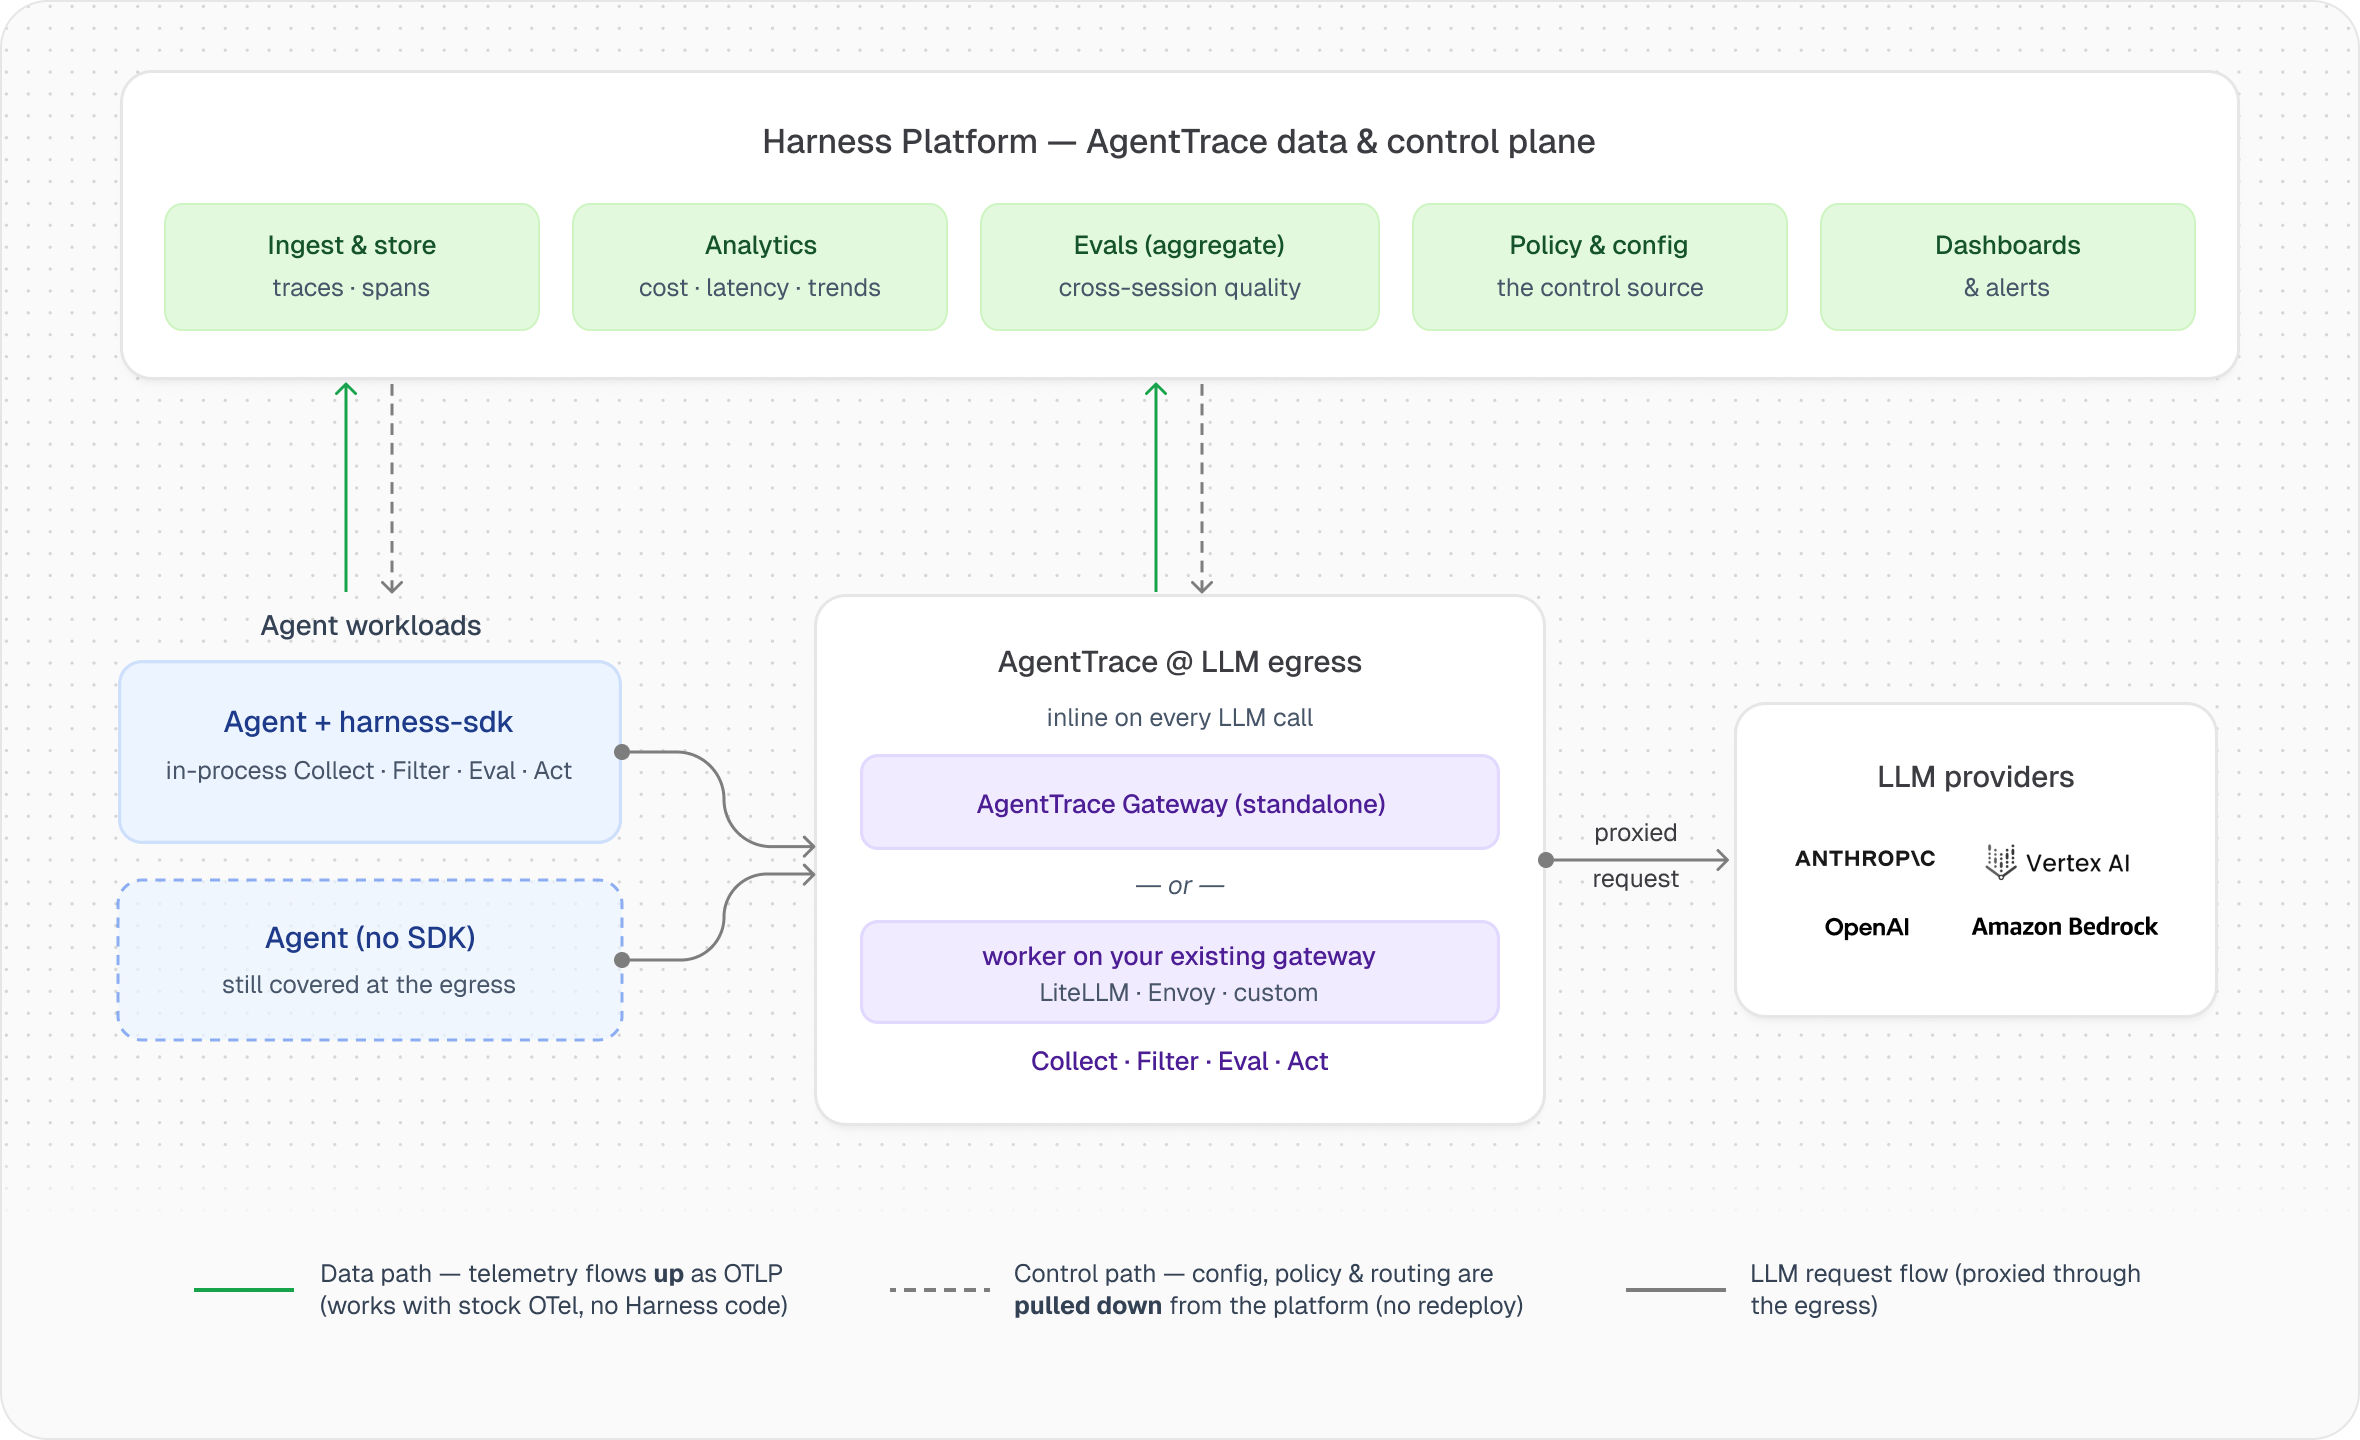
AgentTrace can run as a standalone Gateway or as a worker inside your existing gateway. Telemetry flows up as OTLP; config and policy are pulled back down — no redeploy.
The pipeline is the same everywhere it runs:
- Collect produces OpenTelemetry spans using Harness semantic conventions — a shared vocabulary for agent interactions (tool calls, LLM invocations, user messages, retrieval). The conventions are what make everything downstream possible: a filter can redact PII because the convention defines where user input lives; a runtime check can track cost because the convention defines where token counts live.
- Filter transforms spans in-flight before they leave the process — redaction, sampling, enrichment — as standard OTel SpanProcessors.
- Eval detects conditions from span data: a cost threshold breached, a security-sensitive tool call, a trajectory going in circles.
- Act enforces a response: block the call, redirect the agent, emit a warning, adapt strategy.
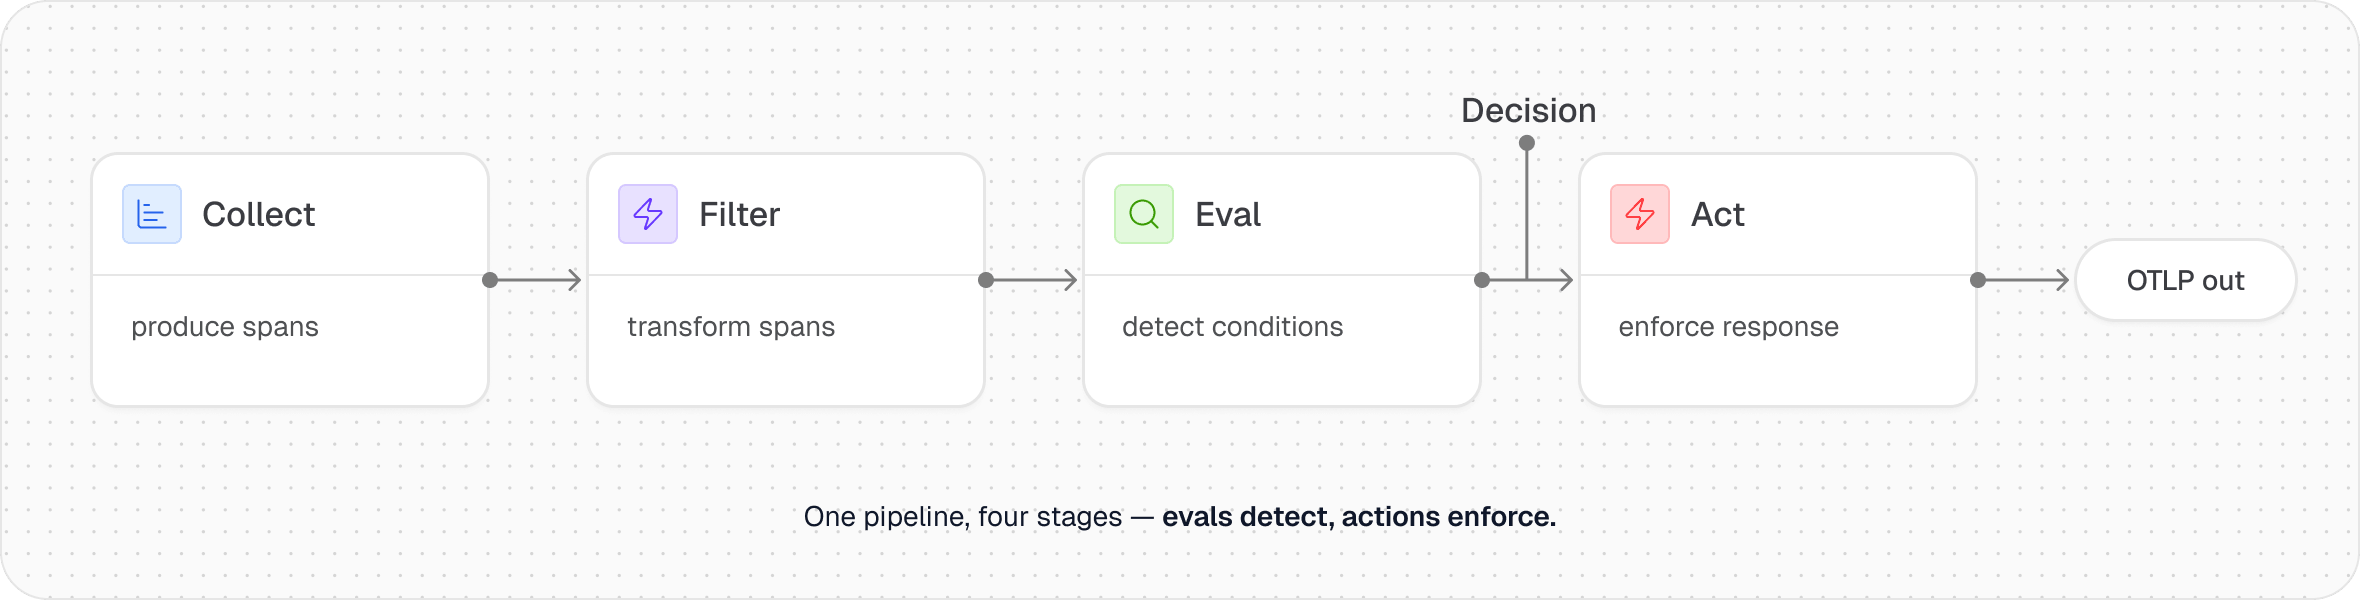
One principle holds throughout: evals detect, actions enforce. Neither does both — an eval emits a decision, an action responds to it. That separation is what keeps the framework composable.
Because Filter, Eval, and Act can run in-process, the framework does what passive tracing can't: redact PII before a span ever leaves the process, warn when a trajectory starts looping, or block a tool call that breaches policy — while the run is still happening. Much of AgentTrace's value at the client tier is exactly this: guardrails that act on the live run, not dashboards you read afterward.
A note on the word “eval,” because it does double duty. In the runtime pipeline above, an eval is an in-flight guardrail that watches a live run. In harness-evals (below), an eval is an offline quality score you run in CI or against stored traces. Same idea — judge the agent — at two speeds: one guards the run in progress, the other grades runs after the fact and gates releases.
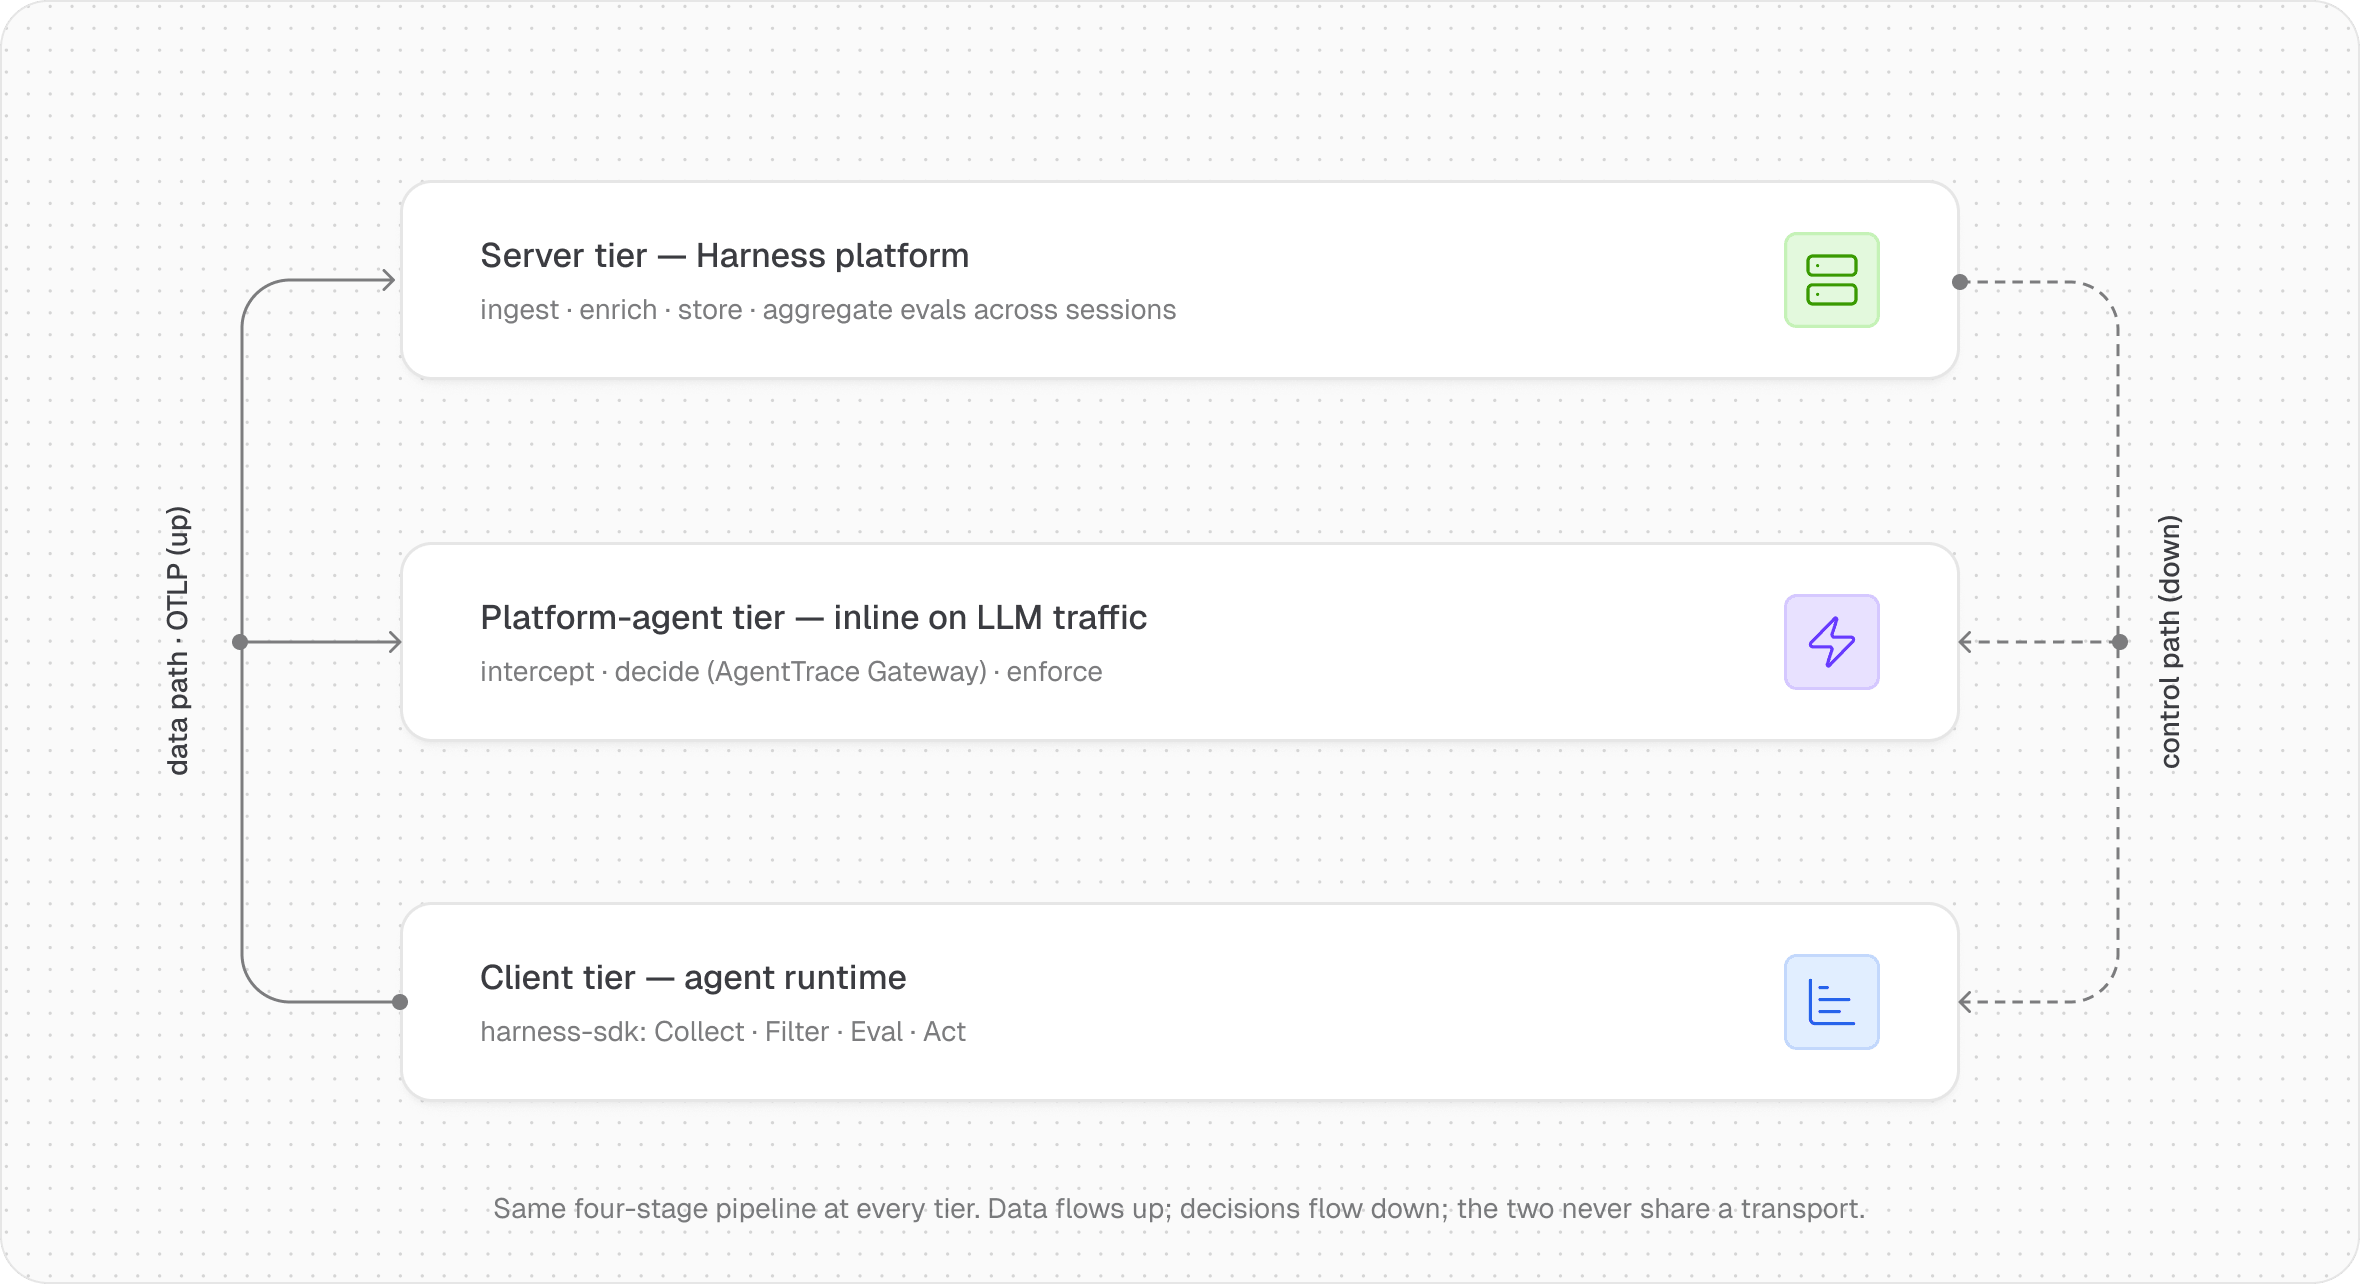
The same pipeline runs at three tiers, each with a different data window and latency budget: client-side, in the agent runtime, for guardrails that can't afford a network hop; on a platform agent, an inline intermediary that handles cross-agent concerns like budgets and rate limits (more on this below); and server-side, in the Harness platform, for aggregate patterns no single client can see — cross-session anomalies, account cost trends, fleet-wide degradation.
Two planes connect the tiers, and keeping them separate is deliberate. The data path is pure OpenTelemetry: telemetry flows up via OTLP, which means a customer running only stock OTel SDKs — no Harness client code — still gets server-side collection, storage, and evals. The control path flows down: dynamic configuration and server-side eval decisions, with no client redeployment. Data flows up, decisions flow down, and the two never share a transport.
The loop: turning production failures into regression gates
One capability the framework unlocks is worth calling out on its own, because it's what most teams are trying to build by hand.
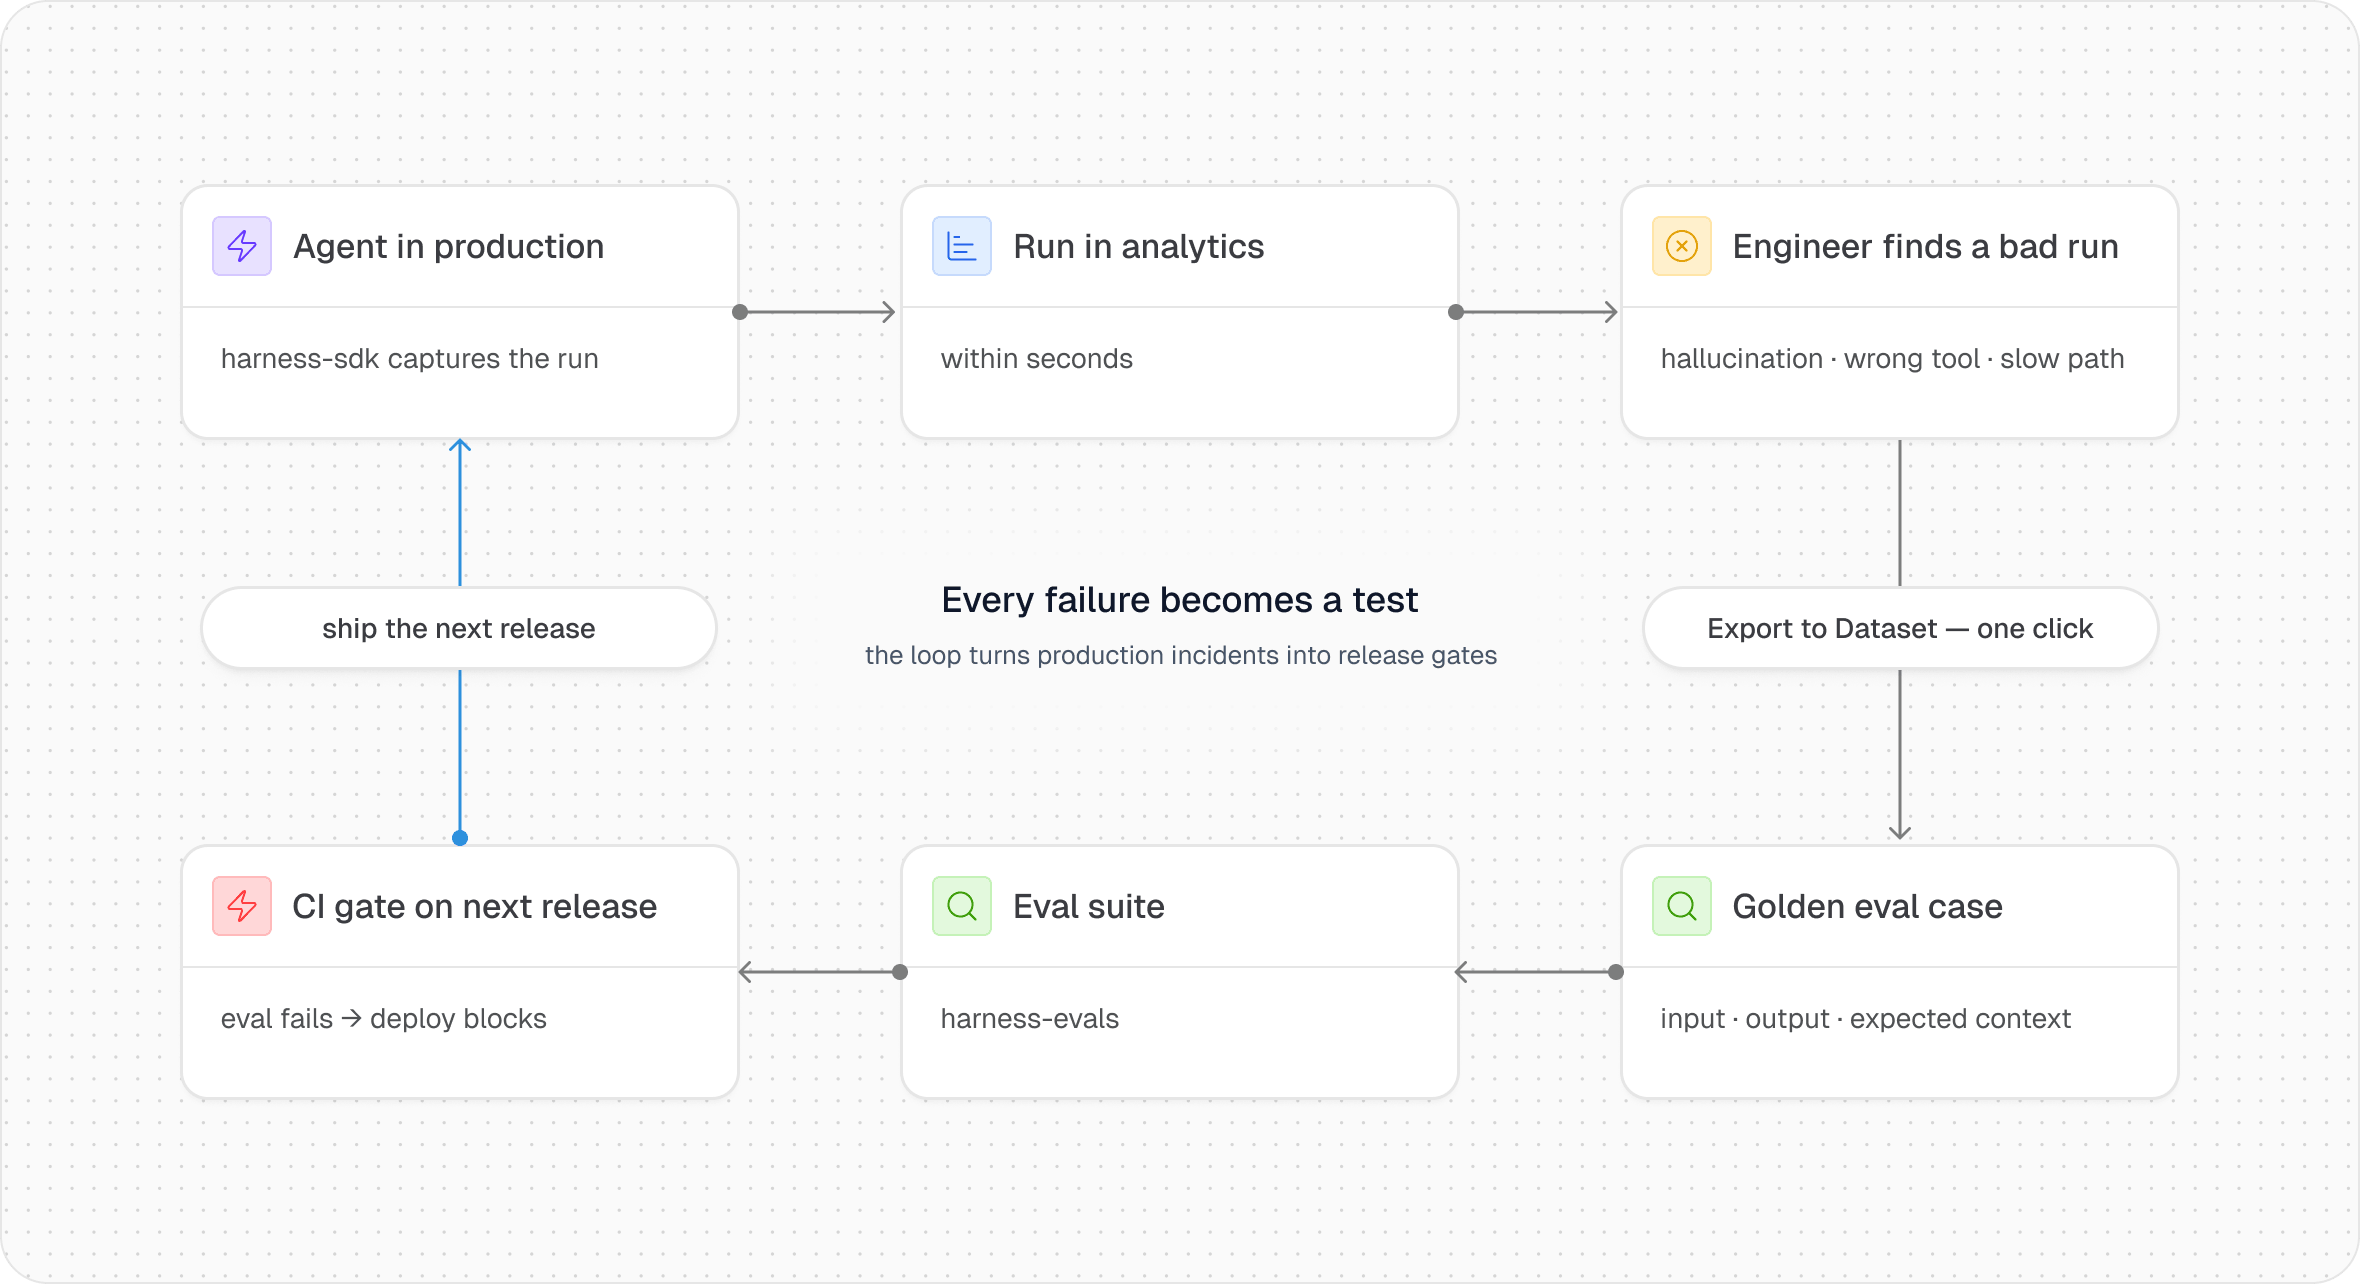
A run lands in analytics within seconds. When a user reports a problem, an engineer pulls the exact run and sees, span by span, where it went wrong — the real execution record, not a sampled approximation. The natural next move is to flag it and move on. On the Harness platform, a different move is one click away: Export to Dataset. A production run that revealed a failure — a hallucination, a wrong tool selection, an inefficient path — is promoted into a golden evaluation case, with its input/output pair extracted and retrieved context preserved.
That one action closes a loop most teams close by hand: a production failure becomes an evaluation case, the case joins your eval suite, the suite gates the next release in CI, the next release is observed in production, and the next failure feeds the suite again. If your CI suite only contains failures you thought to write in advance, it will always lag production. Export to Dataset means every failure you investigate becomes a permanent regression gate — over time the suite reflects what actually breaks, not what someone imagined might.
None of this is a novel idea — it's what good teams already do with error reporting and regression tests. The gap was that nothing connected the agent observability layer to the eval layer with a shared data model. AgentTrace makes them one system with one run identity running through both.
What we're open-sourcing
Two layers of the framework are available today under Apache 2.0 — the two you need to run this yourself, on any stack, against any backend.
harness-sdk (harness/otel-python-sdk) is the collection runtime. The Python SDK auto-instruments OpenAI, Anthropic, and LiteLLM with no code changes — wrap your process with a CLI command (harness-instrument python app.py) and set an environment variable. Output is standard OTLP, so it works with any OTel-compatible backend. Every instrumented run produces a tree of typed spans — LLM calls, tool invocations, retrieval, orchestration — with token counts, latency, cost, and model attribution. It's more than collection: a plugin model adds filter hooks (SpanProcessors) and control hooks that can block, so Collect, Filter, and Act all live here. Node.js, Go, and Java packages are in active development; those teams can export via Langtrace or any OTel SDK today.
harness-evals (harness/harness-evals) is the evaluation layer — our opinion, in code, on how agent quality should be scored: correctness, groundedness, safety, trajectory, and performance, each a transparent 0.0–1.0 metric with an explicit threshold and pass/fail. It gates CI through exit codes, absolute score floors, and baseline regression checks; plugs into pytest; reads production traces back in via OTEL and Langfuse importers; and complements DeepEval and RAGAS by adding trajectory, MCP tool-evaluation, and reliability metrics. The opinionated design choices — why trajectory is a first-class dimension, why safety never averages into a composite score — are documented in the repo.
Together they are the loop in two packages: harness-sdk captures the run, harness-evals scores it, and a shared run identity ties a production failure to the test case it becomes and the CI result that gates the next deploy.
Where it goes next: enforcement at the edge
The client SDK sees one agent process. Some guardrails are inherently cross-agent — budget caps that span teams, rate limits across sessions, model routing, spend that must survive a restart — and none can live in-process. They belong on the platform-agent tier: the same Collect → Filter → Eval → Act pipeline, but inline on the network path between your agents and their LLM providers. This is the part we're actively building; the design is settled enough to describe.
It splits into two roles — a platform agent that intercepts and enforces, and the AgentTrace Gateway, a decision service that evaluates — because the component that decides shouldn't be the one that acts. On each outbound LLM call, the platform agent intercepts the request (synchronous or streaming), hands its context to the Gateway synchronously on a tight budget (a <10 ms target, to keep first-token latency negligible), and the Gateway returns one decision: allow, block, route to a different model, or warn. The platform agent enforces it and records a span up the same OTLP data path.
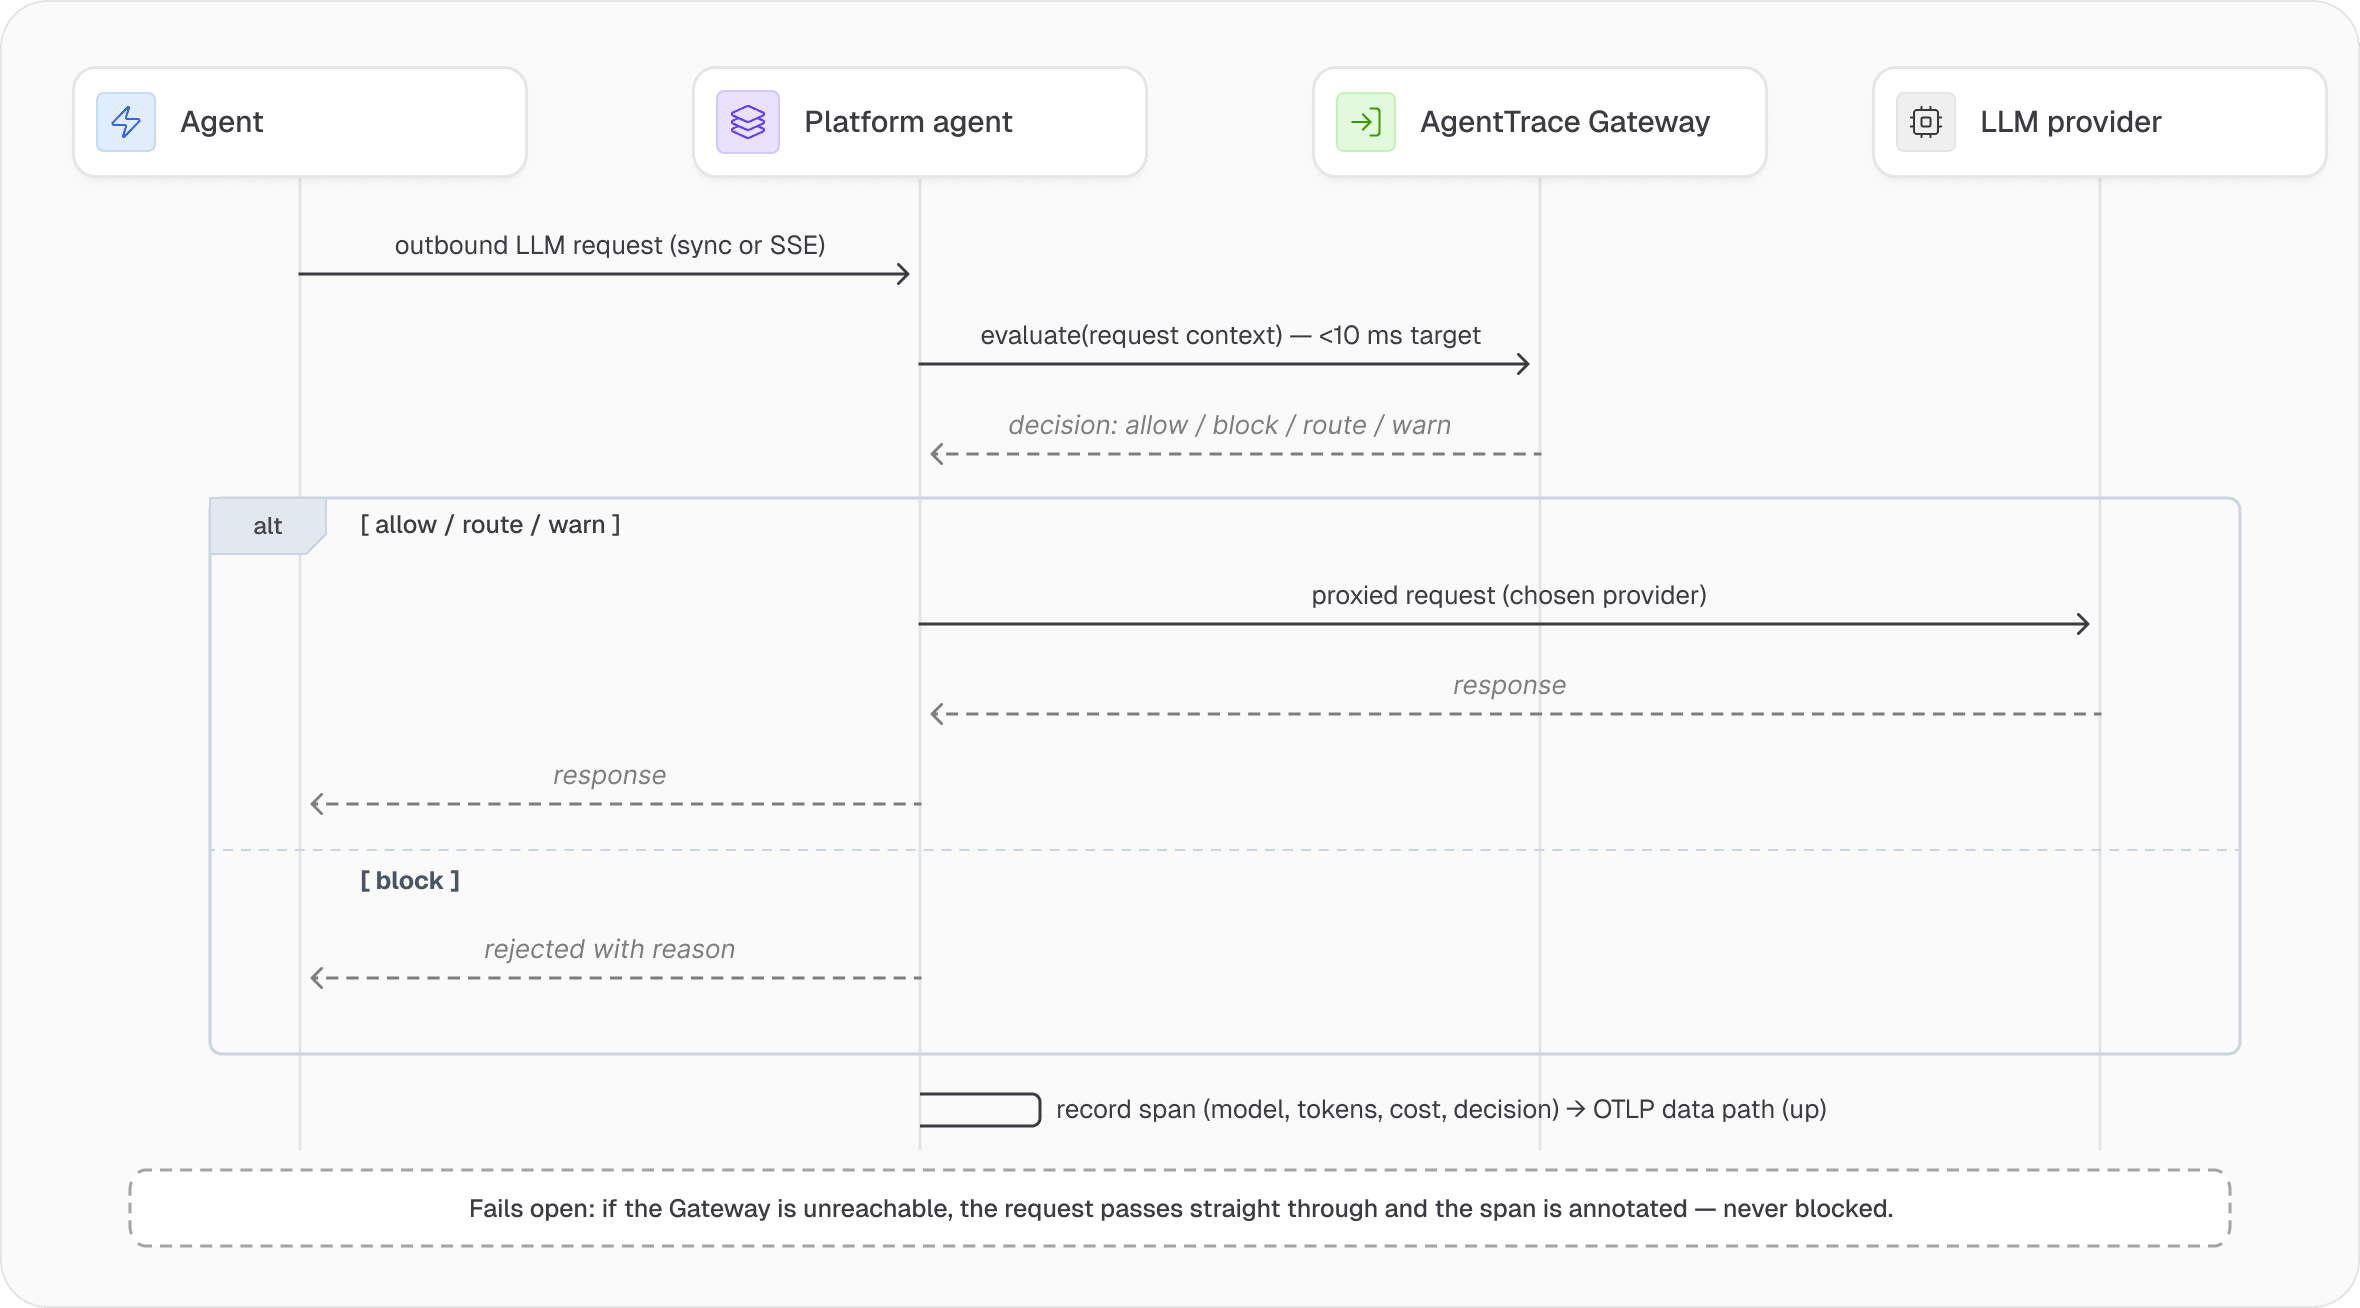
Two properties make this worth the complexity. It covers agents that never adopted the SDK: because enforcement is on the network path, any agent whose calls route through the platform agent gets observability and cost/rate enforcement with zero code changes — add the SDK later for in-process guardrails on top. And it fails open: if the Gateway is unreachable, traffic passes straight through with an annotated span rather than blocking. It starts narrow — routing, cost, and rate limiting first — with content-aware guardrails like PII and prompt-injection detection layered on as it matures.
What's actually different
We're not the first team to build LLM observability, and we won't be the last — LangSmith, Langfuse, Helicone, and others have been at parts of this longer than we have. What's different is that AgentTrace doesn't stop at observing. It scores quality and it acts: in-process guardrails on a live run, enforcement at the edge, and a loop where a production failure becomes the test that gates the next release — observability, evaluation, and guardrails on one data model instead of three tools you wire together yourself.
We're open-sourcing the runtime and the evaluation layer because a way of measuring agent quality only becomes a shared standard if anyone can run it — you can't build a common vocabulary for agent quality when the only people who can use your metrics are your customers. The foundational layers are open. Any team, any stack, any backend.
What's available now
harness-sdk and harness-evals are on PyPI under Apache 2.0:
pip install harness-sdk
pip install harness-evals
With extras for LLM auto-instrumentation and OTLP export:
pip install "harness-sdk[anthropic,openai,litellm]"
pip install "harness-evals[llm,otlp]"
If you're shipping agents and don't have a good answer to “how do we know this is working in production,” start there: harness-evals in your CI pipeline and harness-sdk sending traces to any OTel backend gives you eval gating and production visibility without touching the Harness platform. If you're already on Harness, the platform wires the two together and adds the Trace Viewer, run and session views, human annotation, Export to Dataset, analytics, and CI pipeline gating on top, the full loop, managed.
The docs cover the parts we got right. We'll be honest about the parts we got wrong and we expect to find some.
FAQs
How is AgentTrace different from existing LLM observability tools like LangSmith or Langfuse?
Most tools stop at observing — showing what an agent did. AgentTrace also scores whether the work was good (via evals) and can intervene in real time (via guardrails/actions), unifying observability, evaluation, and enforcement on one data model instead of three separate tools.
What exactly gets open-sourced, and what stays Harness-platform-only?
harness-sdk (collection/instrumentation) and harness-evals (offline quality scoring) are open-sourced under Apache 2.0 and work standalone. The Harness platform adds the Trace Viewer, run/session views, human annotation, Export to Dataset, analytics, and CI gating on top — the "full loop, managed."
Do I need to change my code to use it?
For harness-sdk, no, it auto-instruments OpenAI, Anthropic, and LiteLLM by wrapping your process with a CLI command and setting an environment variable. For agents that never adopt the SDK, the upcoming platform-agent tier can still enforce guardrails at the network level with zero code changes.
What's the difference between a "run," a "session," and the two meanings of "eval"?
A run is every model/tool call in a single execution; a session is every run in one user interaction. "Eval" means two things at two speeds: an in-flight guardrail watching a live run (runtime pipeline) versus an offline quality score run in CI or against stored traces (harness-evals).
What happens if the guardrail/decision service (the Gateway) goes down — does it block all agent traffic?
No, it fails to open. If the Gateway is unreachable, traffic passes straight through with an annotated span rather than blocking, so enforcement issues don't create an availability outage.