
Engineers have been shipping pieces of "the graph" for years. Service maps. Dependency graphs. Knowledge graphs. RDF triples. The newest entrant is the context graph, and the reason it shows up now is specific: software is increasingly executed by agents, and agents need a model of how work actually happens, not just an index of what exists.
This post is a practical, vendor-neutral walkthrough of context graphs: what they are, what separates them from a knowledge graph, the components you'll end up building, and the pitfalls that bite teams who try to ship one. I'll be drawing on engineering writing from Glean and Harness where they've published useful frames, but the design decisions apply regardless of stack.
The shift from "what" to "how"
A knowledge graph answers questions about state. What services exist. Which team owns which repo. Which ticket is linked to which incident. The graph is a snapshot of relationships at a point in time.
A context graph answers a different question. How does work flow through this organization? When a P1 fires, what sequence of actions usually resolves it? When a deal moves from "pilot created" to "closed-won," what steps are between those states, who runs them, and how long do they take? When a service hits an error rate threshold, what's the typical path from alert to mitigation?
The Glean engineering team puts it concisely: "what" exists vs. "how" change happens. Their model treats actions as first-class nodes in the graph, with edges encoding causality and correlation. Other formulations exist, but the central idea is consistent across them.
Three layers that usually compose a context graph
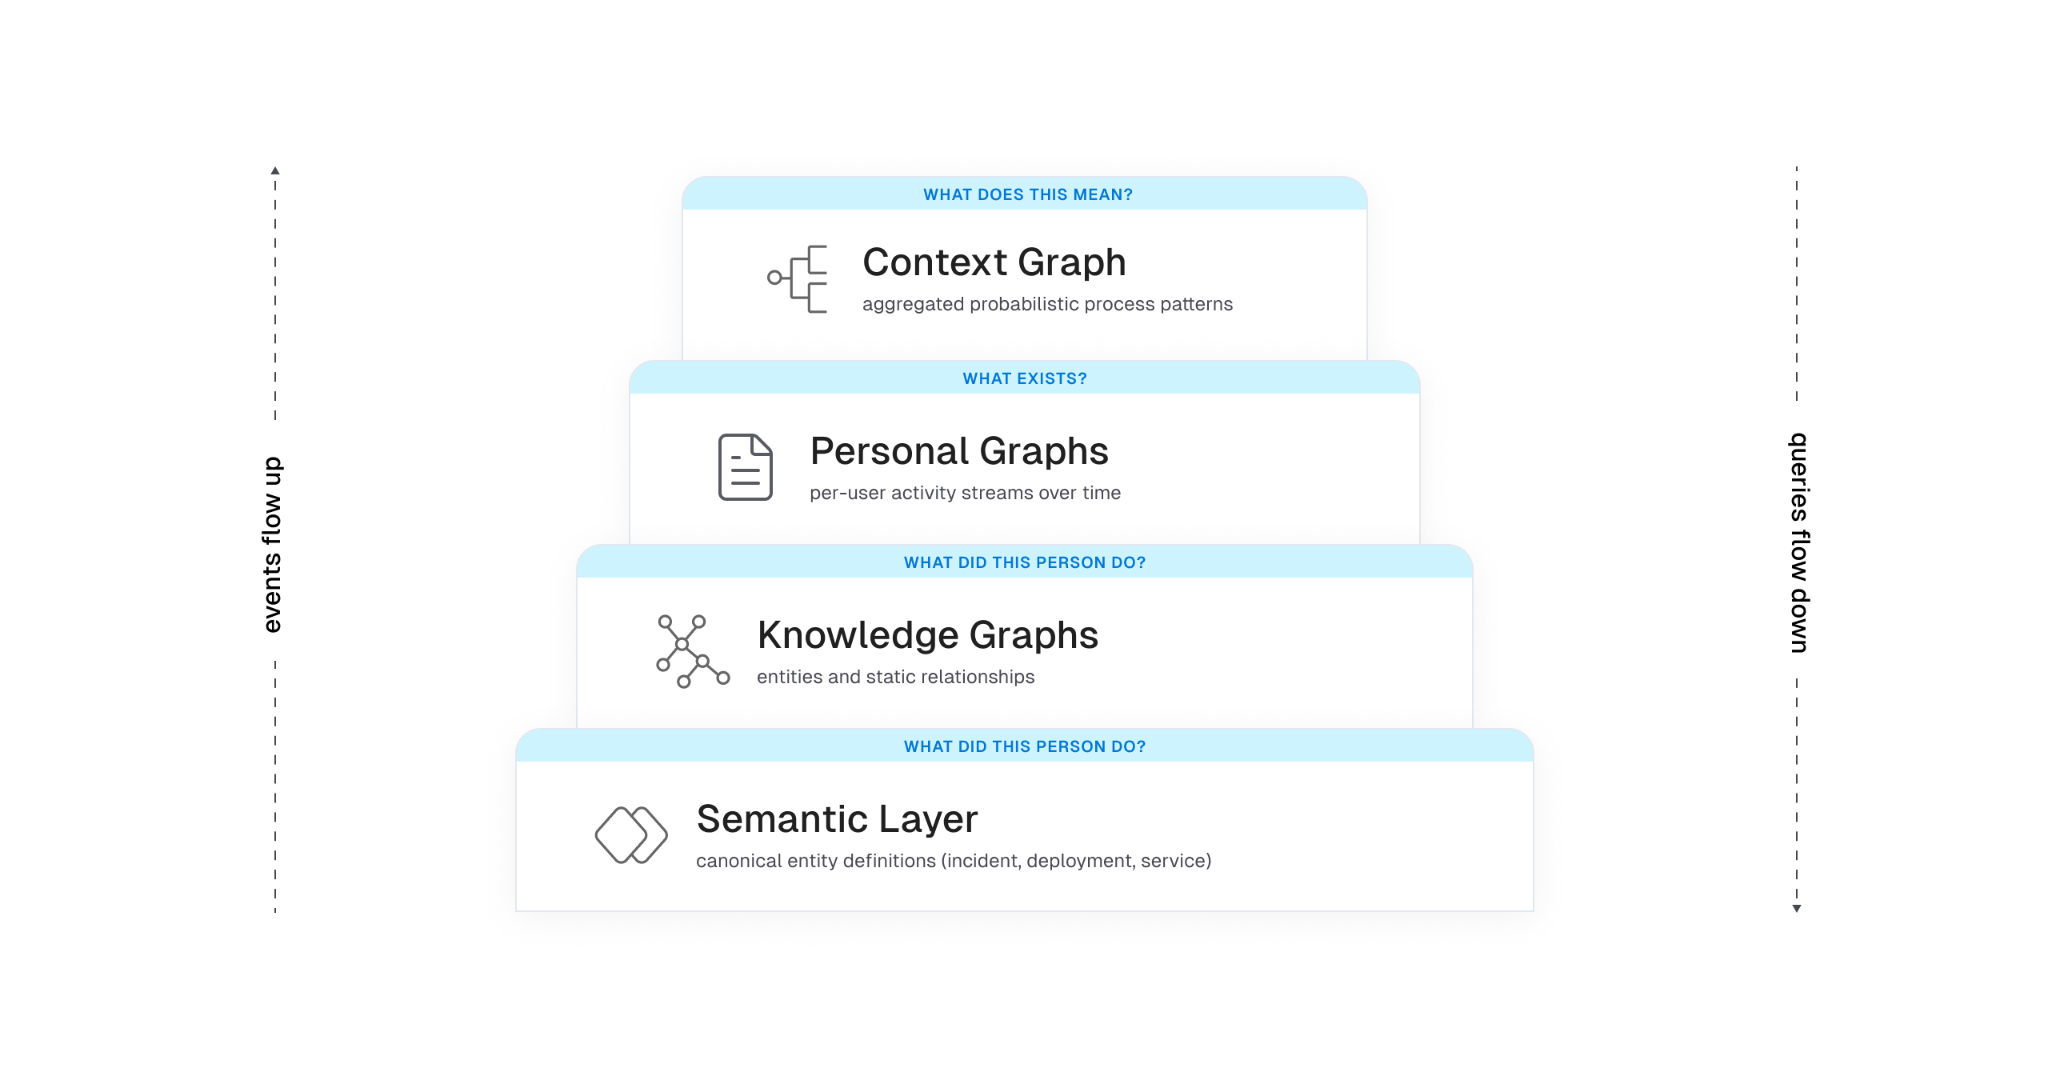
Most production designs end up with a layered architecture, even if teams don't always name the layers the same way:
Layer 1: knowledge graph. Entities and the static relationships between them. Service A depends on service B. User U owns repo R. Ticket T is linked to incident I. This is the substrate. Without it, you don't know that "ACME Inc" in your CRM and "Acme" in support is the same customer, and any aggregate analysis turns to mush.
Layer 2: personal graph (or activity stream). A per-user temporal sequence of actions: viewed doc, edited file, commented on PR, joined channel, deployed service. The signals are noisy on their own. Real work is messy. People context-switch constantly, reuse the same document across efforts, and abandon threads only to pick them back up days later. The job at this layer is to stitch raw events into coherent units of work.
Layer 3: context graph. Aggregate, anonymized patterns derived from many personal graphs. This is where you get statements like "P1 incidents in this product area resolve in 30 minutes 80% of the time and almost always pass through these four steps." It is a probabilistic model of organizational process, not a static workflow definition.
Another way to look at the same architecture: a context graph is two intertwined graphs operating over the same entities. One is structural — nodes and edges representing the static relationships in your organization. The other is executional — transitions and actions that move those entities through their lifecycle over time. The context graph emerges from their combination. Neither graph alone is sufficient: the structural one tells you what could be touched in a given situation, the executional one tells you what actually gets touched, and only the intersection produces a model that's useful to an agent. The three layers above are one way to slice this; the structural/executional split is another, and they map onto each other cleanly. Layer 1 is mostly structural, Layer 2 is mostly executional, and Layer 3 is where the two are joined under a shared semantic frame.
Sitting under all three is a semantic layer that defines what each thing actually means: an "incident" in the graph maps to a specific schema, with specific attributes and lifecycle states, regardless of which tool emitted the event. Without this, you're shoveling JSON between systems and hoping the LLM figures it out.
Why this is not the same as a knowledge graph
This question comes up constantly, so it's worth being precise. A knowledge graph is structural. It models entities and explicit relationships. A context graph adds time and behavior. It models the temporal sequences of actions that move entities through their lifecycle.
You can build a useful knowledge graph without any context graph. People have been doing it for decades with RDF, property graphs, ontologies, and graph databases. What you can't build without a context graph is a model of how work actually happens in your organization.
Concretely, a knowledge graph might tell you:
- service payments-api depends on auth-service
- auth-service is owned by team iam
- the on-call for iam this week is Priya
A context graph layered on top adds:
- 65% of payments-api outages last quarter were caused by config changes in auth-service
- the typical mitigation involves rolling back the change, paging the iam on-call, then reviewing the deploy in postmortem
- time from alert to mitigation is bimodal: under 15 minutes when the alert correlates with a recent auth-service deploy, 45+ minutes otherwise
Each of those statements requires walking entity relationships and looking at temporal action sequences. Neither layer is sufficient on its own.
Why this is not process mining either
There's a related comparison worth making, because process mining shows up often in conversations about this and the differences are easy to miss. Traditional process mining assumes relatively structured enterprise workflows running through bounded event systems — ERP, CRM, BPM platforms with consistent event logs and a finite set of process types. The job is to reconstruct an actual process from those logs and then report or optimize against a predefined target. The environment is controlled. The schemas are known. The processes have names.
Context graphs operate in a different environment. The work being modeled is fragmented across chat, docs, tickets, source control, observability tools, calendars, and increasingly agent actions themselves. There is no single event log, no shared schema across tools, and no predefined target workflow to compare against. The underlying systems weren't designed to emit process traces; the traces have to be inferred from messy signals across tools that don't know about each other and weren't built to be joined.
The objective also differs. Process mining tends toward reporting and optimization of workflows you already know exist. A context graph is trying to build an adaptive, agent-consumable model of how work actually happens across structured and unstructured systems — including the parts that no one has ever formally defined as a process. The output isn't a dashboard for a process owner; it's a substrate for agent reasoning that updates as the organization changes.
Put another way: process mining is an analytics problem in a controlled environment. Context graphs are a behavioral modeling problem in an uncontrolled one. The system isn't mining workflows. It's learning organizational behavior, and most of that behavior was never written down.
Why agents need this
LLMs can already call tools. The harder problem is that they don't know which tools to call, in what order, on which entities, to accomplish a real task in your environment. They have no model of your organization's process.
Documentation describes intent. Systems of record capture state. Neither captures the actual flow of work. When you ask an agent to "investigate this alert," "draft this proposal," or "onboard this customer," it has to assemble the workflow itself, usually with limited success.
A context graph fills the gap. It gives an agent a learned model of "what tends to happen and in what order" for the situations the agent encounters. Instead of hard-coding workflows in playbooks, the system surfaces the most probable path for the current scenario, and the agent can deviate when the situation warrants.
There's a related constraint that the Harness engineering team frames well: the context window is RAM, and RAM is finite. Every token spent on infrastructure noise is a token that can't be spent on reasoning. A context graph is only useful if the agent can pull just the relevant slice of it into context at the moment it's needed. Loading the whole graph blows the budget.
What an event in the graph actually looks like
There's no standard schema yet, but the shape that recurs across implementations is roughly this. An abstracted trace step (the kind that gets aggregated into the context graph) might look like:
{
"trace_id": "trace_8f2a...",
"step_index": 3,
"timestamp_relative_ms": 142000,
"action_type": "comment",
"tool_family": "ticketing",
"entities": {
"incident_id": "INC-2391",
"service_id": "payments-api",
"team_id": "iam"
},
"process_tags": ["investigate_alert", "p1_response"],
"outcome": null,
"duration_ms": 86000
}
Two things to notice. First, no raw text. No message bodies, no doc contents, no user identifiers. The aggregation is over abstracted steps, not raw activity. Second, knowledge graph entity IDs are first-class on every step. That's how the context graph stays tied to the substrate. Without those IDs, the patterns you mine are interesting but not actionable.
Building one: components that matter
There's no canonical architecture for context graphs yet. The components that recur across teams shipping one are roughly these.
1. Deep connectors and event capture
You can't model what you can't observe. The first investment is connector coverage broad enough to capture change events across the tools where work actually happens: source control, CI/CD, ticketing, chat, docs, calendars, observability, identity. Snapshot data is necessary but not sufficient. You need the event stream of changes over time.
This is harder than it sounds. Each tool has its own API, rate limits, and idea of what "changed" means. Identity reconciliation alone is its own minor industry. The same human is priya@example.com in Slack, priya.k@example.com in GitHub, and Priya Kumar (Engineering) in your HRIS. Until you can prove those are the same person, your aggregates lie to you.
2. The semantic layer
Before you put events in a graph, you need agreement on what entities mean. A deployment event from your CD tool, a release from your CI tool, and a change in your ITSM system might describe the same physical action, or three different ones. Without a canonical model, downstream queries are unreliable.
Harness's framing is useful here: the semantic layer is the source of truth for the structure and meaning of the data, and it enforces consistent definitions across tools. This is not supporting infrastructure. It is the substrate the rest of the system depends on. Every aggregation, every query, and every agent decision downstream inherits its meaning from this layer. Get it wrong and the layers above don't fail loudly; they produce confidently wrong output. You can implement it with formal ontologies, JSON Schema, protobuf, or a registry of resource types. The implementation choice is less consequential than the discipline of treating the canonical model as load-bearing and making every connector conform to it.
3. Trace stitching and task segmentation
Raw event streams are not directly useful. A given person edits a doc, switches to Slack, opens a PR, runs a build, comes back to the doc. Are those one task or three? The graph needs to carve continuous activity into bounded units of work.
The approaches that work in practice combine cheap signals (shared titles, links between artifacts, time windows, channel names) with an LLM step that looks at sequences of events and infers semantic boundaries: "this cluster looks like investigating an alert," "these actions look like drafting a spec." The output is a labeled task with a coarse type, a duration, and a set of entities touched.
The cheap signals do most of the work. The LLM step is for cases where the cheap signals disagree or run out. Reverse the order and you'll burn a lot of tokens for marginal gains.
4. Aggregation and pattern mining
Once you have many personal task traces, you aggregate. Normalize each trace into a sequence of anonymized steps: action type, tool family, knowledge graph entities involved, derived process tags, lightweight timing. Compute similarity between traces. Group similar traces. Mine the most common paths.
The output is a probabilistic model: for situations of type X, the typical sequence is A, B, C with probabilities p1, p2, p3, and timing distributions T1, T2, T3.
The word "probabilistic" is doing real work in that sentence, and it's worth pausing on. The graph is not canonical truth and shouldn't be presented to downstream consumers as one. Real organizational processes are noisy, overlapping, partially observable, and constantly evolving. The same situation can resolve through three different paths depending on who's on call, what week of the quarter it is, and which subsystem happened to fail first. A model that collapses that reality into a single deterministic process will quietly mislead the agents that consume it, and the failure mode is the worst kind: confident, plausible, wrong.
Good implementations carry the uncertainty forward rather than papering over it. Each inferred path gets a confidence score that reflects how well the underlying traces actually support it. Temporal weighting decays older traces so the model tracks recent reality instead of the org chart from six quarters ago. Competing paths for the same situation are kept as parallel hypotheses with their own probabilities, not collapsed into the highest-frequency one. Sparse situations are flagged as low-confidence rather than presented with false precision.
The agent consuming the graph then has to reason under that uncertainty: pick the most probable path when confidence is high, surface alternatives when it isn't, and fall back to first-principles reasoning when the situation is novel enough that the graph has no strong signal. The graph's job is to make the uncertainty legible to the agent above it, not to hide it behind a single most-likely answer.
The Glean blog calls out a useful constraint here: only treat a pattern as viable if it appears across at least k distinct users and n independent traces. Below that threshold, you're modeling individuals, not processes, and you're at real risk of leaking PII through deanonymization. Pick your k and n before you ship, not after.
5. Storage that supports both structured and semantic access
Pure graph stores are great for traversal but rigid for free-form text. Pure vector stores are great for semantic similarity but blind to structure. A hybrid approach is what most teams converge on: graph entities and edges for relationships, with text chunks tagged by entity IDs that get embedded for semantic search.
This is the same pattern that underpins KG + RAG systems more generally. The graph provides depth (relationships, lineage, ownership). The vector index provides breadth (matching free-form queries to relevant content). The semantic layer ties them together so that "the auth incident from yesterday" resolves to a specific node, not a set of approximately-relevant text fragments.
PLACEHOLDER: hybrid storage diagram. Show two parallel stores at the bottom (a graph database with nodes/edges, and a vector index with embeddings). Above them, a query layer that takes a natural-language question, decomposes it, hits both stores, and returns a unified result. Show entity IDs as the join key between the two stores. Optional: a third lane showing "process traces" stored as ordered sequences referencing the same entity IDs.
6. The feedback loop
A context graph that stops learning is a static playbook with extra plumbing. The architecture only pays off if agent and human actions feed back in as new traces. When an agent runs a workflow, the outputs (which tools it called, in what order, with what result, whether the user accepted the output) become training signal. Successful runs reinforce the patterns. Failed runs flag anti-patterns where the model's predicted path didn't match reality.
This is where the system starts to get interesting from a reinforcement-learning angle. The graph functions as a policy the agent samples actions from, and that policy updates as the agent acts. The Glean piece makes a good operational point on this: if your agents run outside the system that owns the graph, the graph evolves one way and agent behavior evolves another. You end up with two divergent versions of reality. The graph and the orchestration layer have to share a feedback path.
The OS analogy is more useful than it looks
Sunil Gattupalle at Harness frames the agent loop as an operating system. The mapping is more than rhetorical, and it does real design work for context graphs too:
- The context window is RAM. Finite. Everything the agent can see right now lives here.
- Tool calls are syscalls. Structured I/O between the agent and the rest of the world.
- The agent harness (MCP server, framework, custom orchestrator) is the kernel. It mediates access to underlying systems and enforces policy.
- The knowledge and context graphs are the filesystem. Persistent structured storage the agent can query.
- Schema discovery is virtual memory. The agent doesn't load every type definition upfront. It pages in metadata when it needs it.
If you take that mapping seriously, the design constraints fall out cleanly. You don't dump the whole context graph into the agent's context window any more than you would cat the entire filesystem into RAM. You build query primitives that let the agent pull the slice it needs.
The Harness MCP redesign is a useful concrete example. The team went from 130+ endpoint-shaped tools to 11 generic verbs (list, get, create, update, execute, describe, diagnose, and a handful of others) backed by a registry that dispatches to the right resource type. The tool count stays constant; capability grows in the registry. Whatever your stack, the underlying lesson holds: keep the agent's "menu" small, push capability into queryable backends, and let the agent reason about what to fetch rather than parse a giant tool catalog.
The same lesson applies to context graphs. You don't expose 50 tools that each query one slice of the graph. You expose a small set of generic query verbs (describe_process, find_similar_traces, get_typical_path) and let the graph itself hold the variety.
PLACEHOLDER: agent loop / OS mapping diagram. Two columns side by side. Left column: classic OS stack (process → syscalls → kernel → drivers → hardware). Right column: agent stack (LLM reasoning → tool calls → harness/kernel → resource registry → backend systems and graphs). Horizontal arrows showing the analogous components.
Pitfalls worth watching
Patterns that go wrong in real implementations:
Storing events without entity resolution. If you can't reliably say two different event streams are about the same logical entity, your aggregation is meaningless. Identity reconciliation is unglamorous and load-bearing.
Treating the context graph as static. Process changes constantly. Tools come and go. Teams reorg. If your graph stops ingesting and re-aggregating, it ages out fast. Anything older than a quarter is suspect for active processes.
Underinvesting in the semantic layer. Without a canonical model of what entities and actions mean, graph rot accelerates. New tools get integrated with ad-hoc mappings. Queries return inconsistent results. Engineers stop trusting it.
Hard-coding workflows on top of the graph. The whole point is that the system learns process. If you turn around and embed a fixed playbook on every common path, you've built a regular workflow engine with extra plumbing.
Ignoring k-anonymity in aggregation. Aggregate process insights derived from a small number of users are deanonymized personal graphs in disguise. Pick a threshold and enforce it before you ship.
Letting context drift from execution. This is the divergence problem above. The graph that informs the agent and the system the agent acts in have to share a feedback path, or they will desynchronize within weeks.
Loading the wrong thing into context. A 50KB process description in the agent's working memory is 50KB you don't have for reasoning. Design the graph's query API to return small, focused slices. If the only way to use the graph is to dump it, the agent will degrade.
How to evaluate one
A common question once you have a context graph is whether it's actually useful. Some signals worth tracking:
Coverage. What fraction of meaningful work in your org is represented in the graph? If your most expensive processes aren't in it, the graph isn't helping where it matters.
Path agreement. When an expert is asked to describe how X usually happens, does their description match the graph's most probable path for X? This is a sanity check for trace stitching and aggregation. Disagreement is informative either way: either the graph is wrong, or the expert is describing the ideal rather than what really happens.
Agent task completion. Agents grounded in the graph should complete relevant tasks at higher success rates than agents using only documentation or only tool descriptions. If they don't, the graph is too noisy or too sparse, and you have a calibration problem upstream.
Time-to-fresh. How long after a real-world process changes does the graph reflect it? If it takes weeks, you have built a museum, not a model.
Context cost. What's the average number of tokens an agent spends pulling relevant context from the graph for a given task? Track this over time. If it's growing, your query API is leaking abstraction.
A question I haven't seen good answers to yet
There isn't a standard schema for context graphs the way there is for distributed traces (OpenTelemetry) or feature stores. Every team rolls their own. That's fine for now because the design space is still being explored, but it makes federation across organizations and tools harder than it needs to be. The closest adjacent standard is OCSF for security events, which has the right shape but the wrong domain.
If you're building a context graph today, document your schema with the same rigor you'd apply to a public API. Future-you, and any other team that integrates with your graph, will appreciate it.
Closing
Context graphs sit at the intersection of three things engineers have been shipping pieces of for years: knowledge graphs, activity streams, and agentic systems. The new and useful synthesis is the combination. A context graph captures how work actually happens, not just what exists, and it gives agents a structured, queryable model of process to ground their reasoning in.
Whether you call it a context graph, a process graph, a behavioral graph, or just an aggregate activity model, the design constraints are the same. Capture events at depth. Resolve entities to canonical forms. Stitch traces into tasks. Aggregate patterns under privacy thresholds. Store hybrid (graph plus vector). Treat agent execution as both consumer and producer of the graph. Keep the agent's working memory clean.
The teams building this well aren't reinventing graph databases. They're applying old systems-engineering principles (small stable interfaces, demand paging, content-addressable storage, feedback loops) to a problem that's only become tractable in the last couple of years.
References
- David Huynh and Pradeep Vaghela, "How do you build a context graph?", Glean Engineering blog
- Sunil Gattupalle, Rohan Gupta, and Shubham Jindal, "Architecting MCP for AI Agents: Lessons from Our Redesign", Harness Engineering blog
- Sunil Gattupalle, "The Agent Loop Is the New OS: Design Philosophy of the Harness MCP Server", Harness Engineering blog
- Sunil Gattupalle, "Knowledge Graph + RAG: A Unified Approach to DevOps Intelligence", Harness Engineering blog

All this author’s posts
Dewan Ahmed is a Principal Developer Advocate at Harness, a company that aims to enable every software engineering team in the world to deliver code reliably, efficiently and quickly to their users. Before joining Harness, he worked at IBM, Red Hat, and Aiven as a developer and QA lead.

All this author’s posts
Sunil is an Engineering Architect focused on building production-grade AI and data platforms at scale.