A hands-on investigation into CI performance and reliability, including Test Intelligence, quarantine, caching, and parallel execution.

TL;DR
- Test time is not pipeline time. The lab saw a 52x gap between the Vitest run (~2s) and the Harness pipeline (~100s), with initialization alone swinging from 6s to 42s between executions. Measure where the time actually goes before optimizing the test runner.
- A green rerun is not a fix. Retries turn 2 passed / 2 failed into 4 passed on paper, but they hide how often a test is unstable. Quarantine (via the Harness Test Analysis Plugin) is the honest middle path: known flakes stop blocking merges, unknown failures still fail the build.
- Fix state, then shard, then skip. Shared mutable state turned 4 passing tests into 2 failures; isolation fixed it without weakening assertions. Only after tests are deterministic do parallel shards and Harness Test Intelligence (which skipped 4 of 21 unrelated tests on a scoped code change) pay off.
CI test suite performance is deceptive. A pipeline can have tests that finish in under two seconds and still feel painfully slow. Worse, it can be slow and unreliable: developers wait for a result, see a failed test, press rerun, and hope the next attempt is green.
We wanted to understand where that time goes and what actually helps. So we built a small CI performance lab on Harness Cloud using Node.js, TypeScript, and Vitest, then added a separate Java/JUnit project to exercise Harness Test Intelligence (which analyses your code changes and skips tests that cannot be affected). The goal was not to produce an impressive percentage. It was to recreate the kinds of problems engineers encounter and measure the difference between faster tests, faster pipelines, and more trustworthy feedback.
This is a controlled lab, not a production workload. That distinction matters, because the most useful findings were about understanding where the time actually goes before changing anything. If you are a platform engineer or tech lead investigating why CI takes longer than the test suite, or why flaky tests keep blocking merges despite retries, this is the walkthrough.
1. Test time vs pipeline time: the 52x gap nobody measures
The first measurement was test execution time versus the entire Harness pipeline.
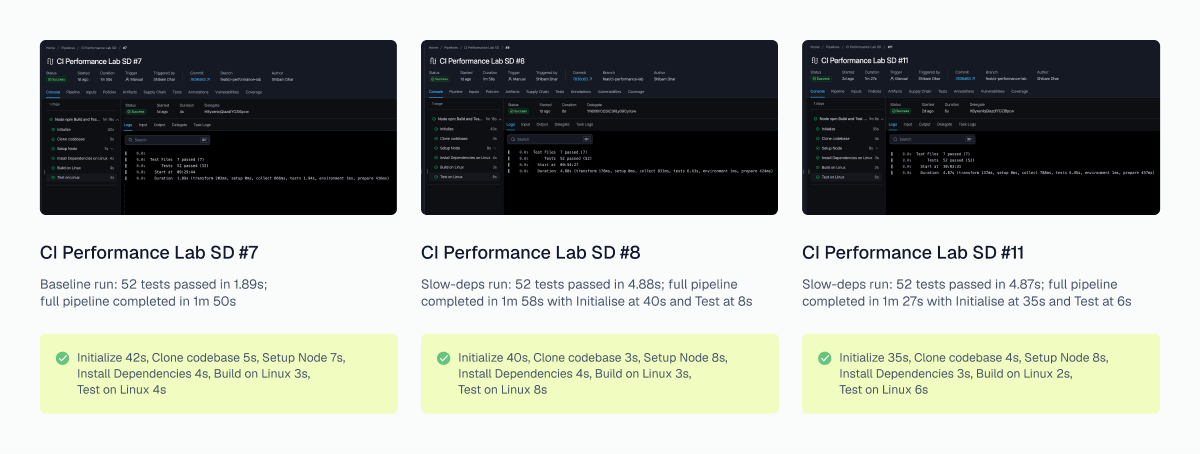
The lab ran five baseline executions of a 52-test Vitest suite, followed by five executions with synthetic delays introduced inside the tests. The delays stood in for slow work; they were not real network dependencies.
| Workload | Average Vitest time | Average pipeline time |
|---|---|---|
| Baseline (5 runs) | 1.902s | 101.2s |
| Synthetic delayed tests (5 runs) | 4.874s | 78.6s |
The tests became about 2.56 times slower, yet the overall pipeline averaged less time in the delayed group. That is not an optimization result. It is a warning against treating the duration of one step as the duration of CI.
Two executions illustrate the mismatch: both spent about 4.9 seconds in Vitest, but one pipeline took 118 seconds, and another took 44. Their initialization steps alone took 40 and 6 seconds, respectively.
Where Harness helps: Its execution timeline and step logs let you inspect initialization, checkout, dependencies, test execution, and reporting separately. Before changing the test runner or buying more compute, find which portion of the pipeline is actually consuming time.
2. Flaky tests, retries, and why green does not mean fixed
A green rerun feels reassuring. It should not be confused with a fix.
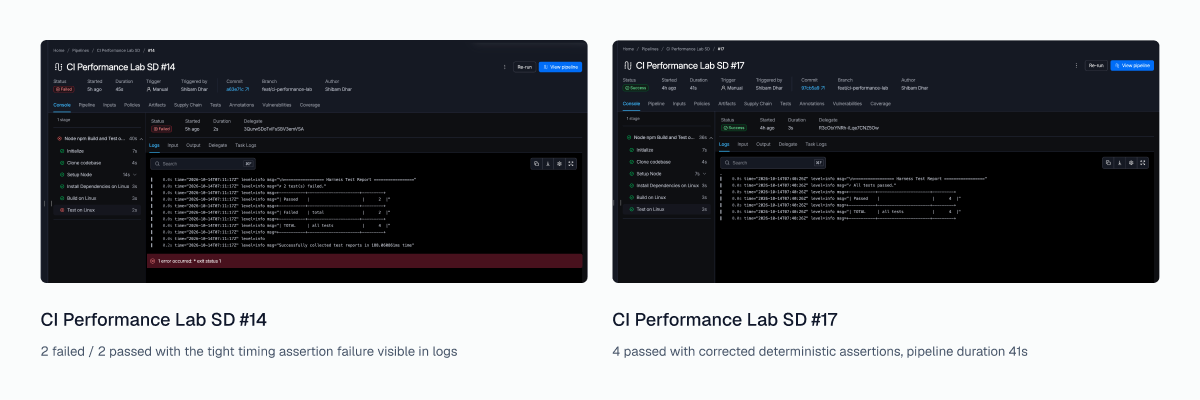
In the flaky-test experiment, the same four-test scenario initially produced two passes and two failures. Enabling a retry produced four passing results after one additional test attempt. Replacing the problematic patterns with corrected tests gave four passes without relying on a retry.
| Harness run | What happened |
|---|---|
| #14, flaky tests | 2 passed, 2 failed |
| #16, retries enabled | 4 passed after 1 retry |
| #17, corrected tests | 4 passed without the intentional flaky behaviour |
A timing-sensitive assertion used an unrealistically tight three-millisecond budget. That makes the outcome depend on the execution environment rather than application correctness. Retries can reduce disruption, but they also conceal how often a test is unstable. The broader question of what to trust in AI-generated test output is one we explored in Catch AI Regressions Before They Ship with AI Evals in CI/CD.
DeNA documented a much larger version of this problem: an E2E CI suite that sometimes required repeated runs, with pipeline times over 20 minutes, before the team tackled sources of nondeterminism and reported bringing the run down to around seven minutes. That is an independent engineering example, not a Harness result. Read DeNA's account.
Quarantining known flaky failures without ignoring every failure
When fixing an unreliable test immediately is not practical, the next question is how to avoid blocking every build without allowing genuine regressions through.
For that, we used the Harness Test Analysis Plugin. It reads JUnit XML reports and compares failed test names against a quarantine list. The test-running step is configured to ignore its own failure so that the analysis step can make the policy decision.
The lab tested two reproducible scenarios:
| Scenario | Test results | Test Analysis result |
|---|---|---|
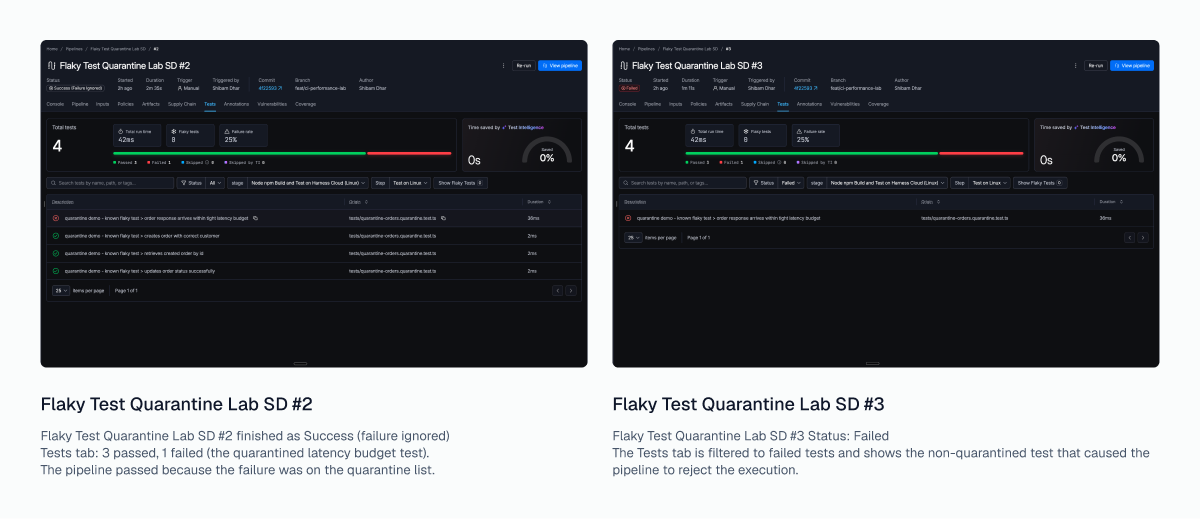
| A: Known failure only | 3 passed, 1 quarantined failure | Passed |
| B: Known + unexpected failure | 3 passed, 1 quarantined + 1 non-quarantined failure | Failed, as intended |
In Scenario A, the plugin explicitly logged that the failing test was quarantined. In Scenario B, it identified a test not on the quarantine list and rejected the execution. Quarantine is selective, not a blanket instruction to ignore errors.
The v1 pipeline used a container-based run step after the test step:
- id: testAnalysis
  name: Test Analysis
  run:
    container:
      image: plugins/test-analysis:latest
    with:
      test_globs: ci-performance-lab/reports/quarantine.xml
      quarantine_file: ci-performance-lab/quarantine.yml
      fail_on_quarantine: true
The preceding run-test step generated the JUnit XML and set on-failure to ignore. We also added a runtime boolean input to enable Scenario B and analyze a separate quarantine-demo.xml report. The official documentation illustrates a type: Plugin step; we validated the container-based v1 pattern above.
One important caveat: to make the policy test reproducible, the final quarantine example uses a deliberately failing assertion rather than waiting for a real intermittent timing failure. It validates quarantine handling, not automated flaky-test detection. Real quarantined tests should have owners, expiry dates, and a plan to fix them.
3. Shared state: why tests pass alone but break together
Sometimes the problem is not time at all. It is state.
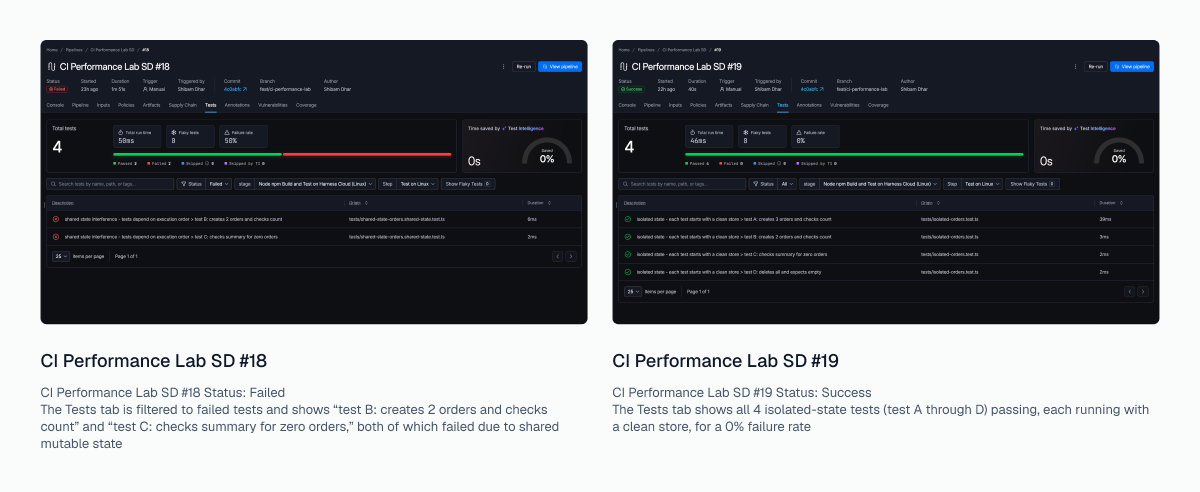
The next experiment introduced four tests that shared a mutable in-memory order store. In the state-polluted version, two of four tests failed because earlier tests left data behind. With fresh application state for each test, all four passed under the same assertions.
| Test setup | Result |
|---|---|
| Shared mutable state, execution #18 | 2/4 failed |
| Isolated state, execution #19 | 4/4 passed |
This was a sequential test-isolation experiment, not a concurrency stress test. Harness exposed the assertion failures and made it straightforward to compare executions side by side. The fix was in test setup: give each test a clean state rather than weakening its expectations.
RunPod's engineering team reached a related conclusion at a much larger scale. Its integration tests used the same account, preventing safe parallel execution. After giving workers isolated identities and restructuring long-running test files, RunPod reported an early production merge-queue median improvement from 10.1 to 4.5 minutes. Read the case study.
Fix shared-state assumptions before applying more parallelism. Faster concurrency against shared data simply produces failures faster.
4. Parallel shards and the initialization overhead that ate the speedup
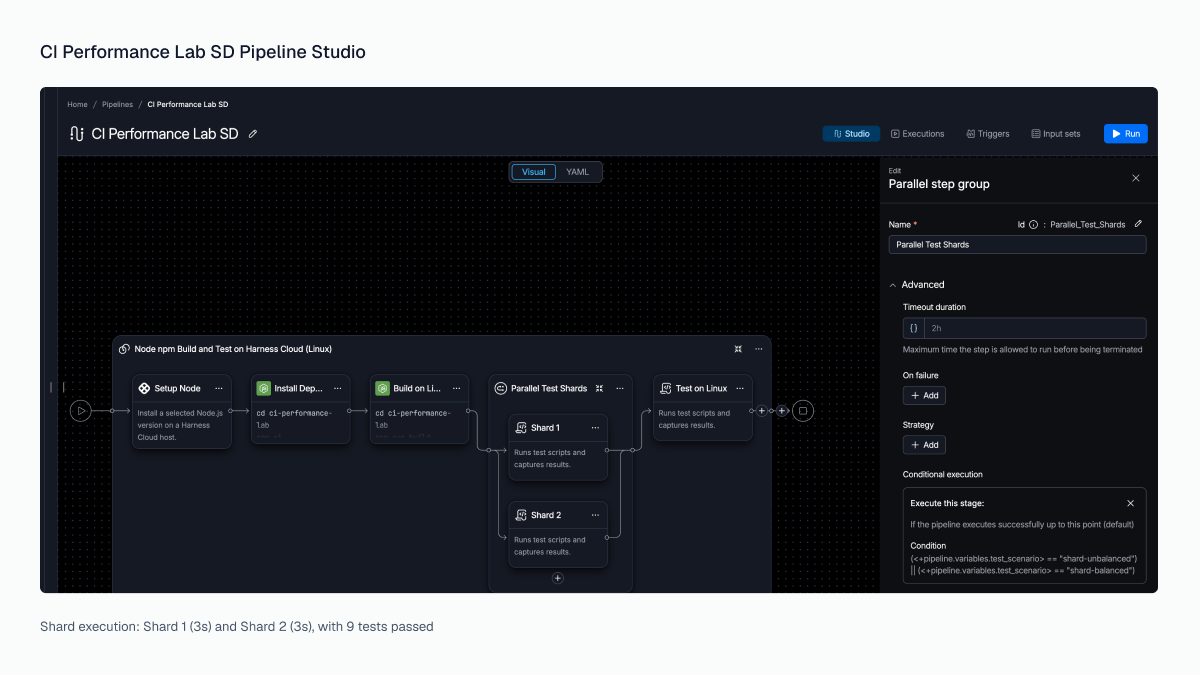
We split the same 16 tests across two parallel Harness steps. The first arrangement put 11 tests on one shard and five on the other. A more balanced arrangement distributed seven and nine.
| Measurement | Unbalanced | Balanced |
|---|---|---|
| Tests across shards | 11 / 5 | 7 / 9 |
| Slowest shard's Vitest time | 1.23s | 1.20s |
| Harness parallel-group duration | 5s | 5s |
The allocation became more even. At this scale, the parallel group finished in the same time, which tells you something useful: for small suites, initialization overhead dominates and sharding pays off only once test volume is large enough to outweigh it. Harness makes that trade-off visible by reporting each shard's duration independently.
For a larger example of what can happen when the slowest shard is the bottleneck, Flakiness.io reported reducing WordPress Gutenberg's Playwright runtime from 35 to 23 minutes by balancing shards using test-duration data. Read the Gutenberg case study.
Where Harness helps: Parallel steps provide a place to run independent test partitions and inspect their individual durations. Whether balancing helps depends on the shape and size of the workload, and on what dominates the overall pipeline. The Introduction to Parallel Steps university course walks through the configuration in detail.
5. Dependency caching: what a cache hit actually costs
Dependency caching is often an early CI optimization, but it needs a real before-and-after measurement.
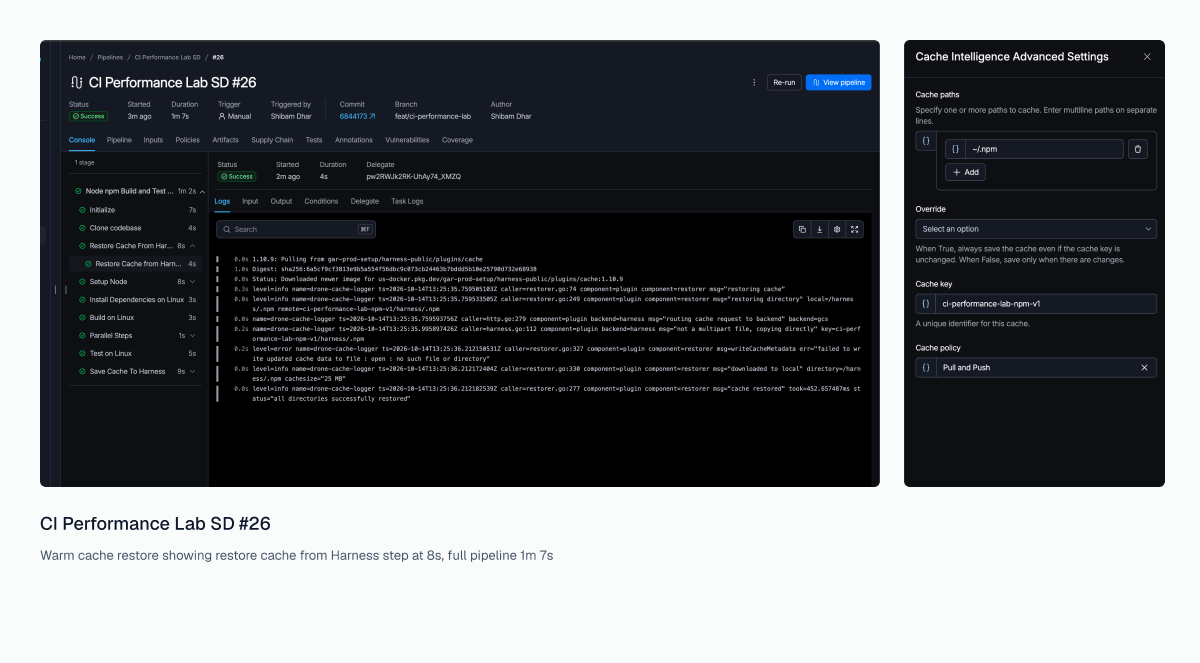
We enabled Harness Cache Intelligence for npm and learned an unexpectedly practical lesson: verify the package manager's actual cache location rather than assuming the home directory resolves as expected. In this Harness Cloud environment, the relevant npm cache path was /harness/.npm. Once the correct path was used, a cache was saved and restored successfully.
| Measurement | Initial successful save, #25 | Warm restore, #26 |
|---|---|---|
| Dependency install step | 4s | 3s |
| Cache restore step | Initial miss | 8s |
| Entire pipeline | 70s | 67s |
The warm run installed dependencies one second faster, with eight seconds spent in cache restore. The real value here is visibility: Harness breaks out restore time, install time, and save time as separate steps, so you can see exactly whether caching pays for itself in your dependency profile rather than guessing.
Where Harness helps: Cache Intelligence can persist and restore common dependencies. The decision to keep a cache policy should still be based on representative warm, cold, and changed-dependency builds, not on the existence of a cache hit alone.
6. Test Intelligence: skipping the tests a code change cannot reach
This is where the lab went beyond inspecting pipeline timings to show selective test execution in a working Harness configuration.
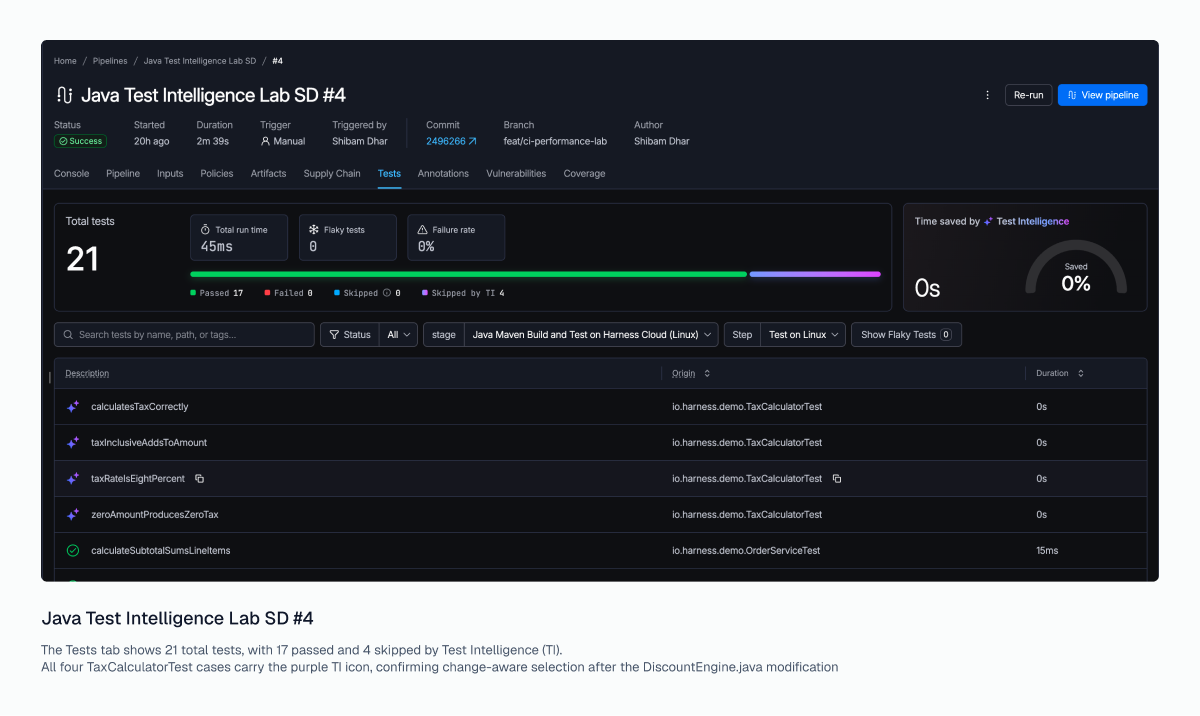
A separate Java/Maven/JUnit project provided 21 tests distributed across three test classes:
OrderServiceTest: 12 testsDiscountEngineTest: 5 testsTaxCalculatorTest: 4 testsThe idea was straightforward: change the discount code, then check whether Harness Test Intelligence avoids running the unrelated tax tests.
The Test Intelligence configuration
- Create a Java/Maven Build stage on Harness Cloud Linux, with code cloning enabled into the default
/harnessworkspace. - Add Setup Java and a build step that executes
cd ti-java-demo && mvn -B -DskipTests package. - Add Test on Linux as a
run-teststep, executingcd ti-java-demo && mvn test. - Enable Test Intelligence in that test step and point JUnit reporting to
ti-java-demo/target/surefire-reports/*.xml. - Run a baseline, then push a production-code change and run again against the updated branch.
The Test Intelligence documentation describes the Test step and the required default checkout workspace. The Introduction to Test Intelligence university course covers setup end to end. Language/framework support matters, which is why this demo uses Java/JUnit rather than treating our separate Vitest suite as automatically supported.
What Harness actually ran
| Result | Baseline execution #3 | Modified-code execution #4 |
|---|---|---|
| Total tests represented | 21 | 21 |
| Executed and passed | 21 | 17 |
| Skipped by Test Intelligence | 0 | 4 |
| Failed | 0 | 0 |
| Full pipeline duration | 56s | 159s |
After a change confined to DiscountEngine.java, Harness selected the 12 OrderServiceTest and five DiscountEngineTest cases, while skipping all four TaxCalculatorTest cases. The execution logs also showed that Harness generated and uploaded a non-empty call graph with 52 nodes.
That is a 19% reduction in executed test count (4 of 21) on a 21-test suite. The time saving at this scale is negligible, which is expected: Test Intelligence is built for repositories where the full suite takes minutes, not seconds. The verified result is that Harness made the intended change-aware selection, and that selection scales with your test surface.
Applying this sequence to your own pipeline
The temptation is to turn on every optimization
at once. A narrower sequence works better: first separate test time from pipeline overhead, then fix nondeterministic and shared-state failures, then measure expensive work worth caching or parallelizing. Once the tests and execution model are reliable, use change-aware selection to avoid work that genuinely is not relevant.
Faster feedback and trustworthy feedback are different outcomes. Harness provided the observability to find slow steps, the quarantine boundary to separate known flaky failures from real regressions, and the call-graph analysis to skip irrelevant tests. The fixes themselves came from what that visibility revealed: bad assertions, shared state, startup overhead. That is the pattern. Harness shows you where the time goes; you decide what to change.
If you are investigating CI test suite performance on a slow or unreliable pipeline, start with one execution: identify where the time goes, check which failures are genuinely nondeterministic, and change one thing at a time. Then compare the result in the pipeline execution history rather than trusting a percentage on its own. Once CI feedback is fast and trustworthy, the next constraint is usually deployment: that is where Harness CD pipelines pick up.
If you are new to Harness CI, Building Your First CI Pipeline covers the setup from a fresh Git repo through to a Docker image push. Then fork the lab and run it against your own pipeline: harness-community/harness-sample-apps, branch feat/ci-performance-lab.
Lab notes: All experiments used a controlled sample application in harness-community/harness-sample-apps on branch feat/ci-performance-lab. The flaky-quarantine policy demonstration used deliberately failing assertions; the Java Test Intelligence demonstration used a separate JUnit fixture. Measurements are from the specified Harness executions, not benchmark claims for other projects or environments.